


Week 3: Work and Energy |
|
|
165 |
|
To outline the solution, following a previous homework problem, we write: |
|
|||
F − mg = ma |
(329) |
|||
or |
F − mg |
|
|
|
a = |
|
(330) |
||
m |
||||
|
|
|||
We integrate twice to obtain (starting at y(0) = 0 and v(0) = 0):
v(t) = at = |
|
F − mg |
t |
|
|
|
|
|
|||||||||||
|
|
|
|
|
|
|
|
|
|
m |
|
|
|
|
|
|
|
||
y(t) = |
1 |
at2 |
|
= |
1 |
|
F − mg |
t2 |
|
|
|||||||||
2 |
|
|
|
|
|
|
|||||||||||||
|
|
|
|
|
2 |
|
|
m |
|
|
|
|
|
||||||
From this we can find: |
|
|
|
|
|
|
|
|
|
|
|
|
|
|
|
|
|||
Emech(tr ) = mgy(tr) + |
1 |
mv(tr)2 |
|
|
|
|
|
||||||||||||
|
|
|
|
|
|
||||||||||||||
2 |
µ |
m |
r |
¶ |
|||||||||||||||
2 |
|
|
|
m |
|
|
|
r |
2 |
|
|||||||||
|
1 |
|
F − mg |
|
|
|
|
1 |
|
|
F − mg |
|
|
2 |
|||||
= mg |
|
t2 + |
m |
|
t |
|
|
||||||||||||
|
|
|
|
|
|
|
|||||||||||||
=1 µF g − mg2 + F 2 + mg2 − 2F g¶ t2
2 m r
= |
1 |
¡F 2 − F mg¢ tr2 |
2m |
Now for the power:
P= F · v = F v(t)
=F 2 − F mg t m
We integrate this from 0 to tr to find the total energy delivered by the rocket engine:
W = Z0 |
P dt = |
2m ¡F 2 − F mg¢ tr2 = Emech(tr ) |
|
|
tr |
1 |
|
(331)
(332)
(333)
(334)
(335)
(336)
For what it is worth, this should also just be W = F × y(tr ), the force through the distance:
W = F |
× |
1 |
|
F − mg |
t2 |
= |
1 |
¡ |
F 2 |
− |
F mg t2 |
(337) |
|
|
2m |
||||||||||
|
2 m r |
|
|
¢ r |
|
|||||||
and it is.
The main point of this example is to show that all of the definitions and calculus above are consistent. It doesn’t matter how you proceed – compute Emech, find P (t) and integrate, or just straight up evaluate the work W = F y, you will get the same answer.
Power is an extremely important quantity, especially for engines because (as you see) the faster you go at constant thrust, the larger the power delivery. Most engines have a limit on the amount of power they can generate. Consequently the forward directed force or thrust tends to fall o as the speed of the e.g. rocket or car increases. In the case of a car, the car must also overcome a (probably nonlinear!) drag force. One of your homework problems explores the economic consequences of this.
3.7: Equilibrium
Recall that the force is given by the negative gradient of the potential energy:
~ |
~ |
(338) |
F = − U |
||
166 |
|
|
|
|
|
|
|
Week 3: Work and Energy |
or (in each direction87): |
|
|
|
|
|
|
|
|
Fx = − |
dU |
|
dU |
|
|
dU |
|
|
|
, |
Fy = − |
|
, |
Fz = − |
|
(339) |
|
dx |
dy |
dz |
||||||
or the force is the negative slope of the potential energy function in this direction. As discussed above, the meaning of this is that if a particle moves in the direction of the (conservative) force, it speeds up. If it speeds up, its kinetic energy increases. If its kinetic energy increases, its potential energy must decrease. The force (component) acting on a particle is thus the rate at which the potential energy decreases (the negative slope) in any given direction as shown.
In the discussion below, we will concentrate on one-dimensional potentials to avoid overstressing students’ calculus muscles while they are still under development, but the ideas all generalize beautifully to two or three (or in principle still more) dimensions.
|
U(x) |
|
|
F |
|
|
F |
|
b |
a |
x |
|
F = 0 Equilibrium |
|
Figure 42: A one-dimensional potential energy curve U (x). This particular curve might well represent U (x) = 12 kx2 for a mass on a spring, but the features identified and classified below are generic.
In one dimension, we can use this to rapidly evaluate the behavior of a system on a qualitative basis just by looking at a graph of the curve! Consider the potential energy curves in figure 42. At the point labelled a, the x-slope of U (x) is positive. The x (component of the) force, therefore, is in the negative x direction. At the point b, the x-slope is negative and the force is correspondingly positive. Note well that the force gets larger as the slope of U (x) gets larger (in magnitude).
The point in the middle, at x = 0, is special. Note that this is a minimum of U (x) and hence the x-slope is zero. Therefore the x-directed force F at that point is zero as well. A point at which the force on an object is zero is, as we previously noted, a point of static force equilibrium – a particle placed there at rest will remain there at rest.
In this particular figure, if one moves the particle a small distance to the right or the left of the equilibrium point, the force pushes the particle back towards equilibrium. Points where the force is zero and small displacements cause a restoring force in this way are called stable equilibrium points. As you can see, the isolated minima of a potential energy curve (or surface, in higher dimensions) are all stable equilibria.
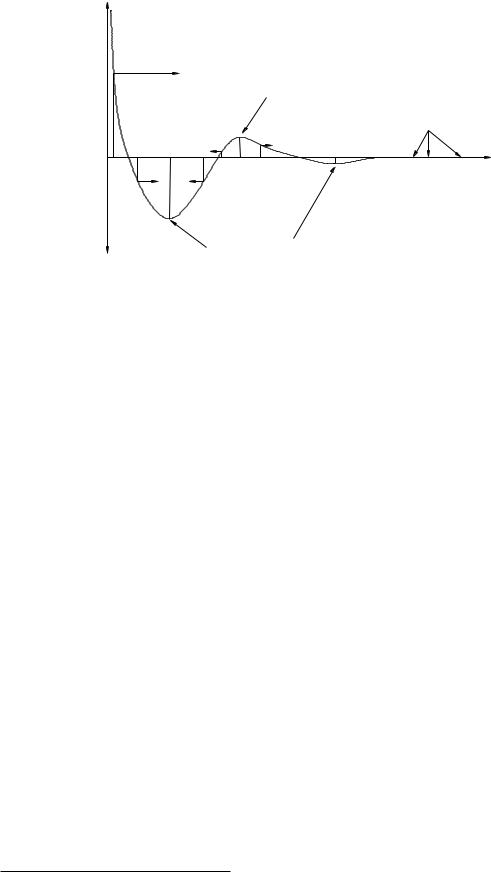
Figure 43 corresponds to a more useful “generic” atomic or molecular interaction potential energy. It corresponds roughly to a Van der Waals Force88 between two atoms or molecules, and exhibits a number of the features that such interactions often have.
87Again, more advanced math or physics students will note that these should all be partial derivatives in correspondance with the force being the gradient of the potential energy surface U (x, y, z), but even then each component is the local slope along the selected direction.
88Wikipedia: http://www.wikipedia.org/wiki/Van der Waals Force.
Week 3: Work and Energy |
167 |
U(r) |
|
F |
Unstable Equilibrium |
|
|
|
Neutral Equilibrium |
|
r |
|
Stable Equilibrium |
Figure 43: A fairly generic potential energy shape for microscopic (atomic or molecular) interactions, drawn to help exhibits features one might see in such a curve more than as a realistically scaled potential energy in some set of units. In particular, the curve exhibits stable, unstable, and neutral equilibria for a radial potential energy as a fuction of r, the distance between two e.g. atoms.
At very long ranges, the forces between neutral atoms are extremely small, e ectively zero. This is illustrated as an extended region where the potential energy is flat for large r. Such a range is called neutral equilibrium because there are no forces that either restore or repel the two atoms. Neutral equilibrium is not stable in the specific sense that a particle placed there with any nonzero velocity will move freely (according to Newton’s First Law). Since it is nearly impossible to prepare an atom at absolute rest relative to another particle, one basically “never” sees two unbound microscopic atoms with a large, perfectly constant spatial orientation.
As the two atoms near one another, their interaction becomes first weakly attractive due to e.g. quantum dipole-induced dipole interactions and then weakly repulsive as the two atoms start to “touch” each other. There is a potential energy minimum in between where two atoms separated by a certain distance can be in stable equilibrium without being chemically bound.
Atoms that approach one another still more closely encounter a second potential energy well that is at first strongly attractive (corresponding, if you like, to an actual chemical interaction between them) followed by a hard core repulsion as the electron clouds are prevented from interpenetrating by e.g. the Pauli exclusion principle. This second potential energy well is often modelled by a Lennard-Jones potential energy (or “6-12 potential energy”, corresponding to the inverse powers of r used in the model89 . It also has a point of stable equilibrium.
In between, there is a point where the growing attraction of the inner potential energy well and the growing repulsion of the outer potential energy well balance, so that the potential energy function has a maximum. At this maximum the slope is zero (so it is a position of force equilibrium) but because the force on either side of this point pushes the particle away from it, this is a point of unstable equilibrium. Unstable equilibria occur at isolated maxima in the potential energy function, just as stable equilibria occur at isolated minima.
Note for advanced students: In more than one dimension, a potential energy curve can have “saddle points” that are maxima in one dimension and minima in another (so called because the potential energy surface resembles the surface of a saddle, curved up front-to-back to hold the
89Wikipedia: http://www.wikipedia.org/wiki/Lennard-Jones Potential. We will learn the di erence between a “potential energy” and a “potential” later in this course, but for the moment it is not important. The shapes of the two curves are e ectively identical.
168 |
Week 3: Work and Energy |
rider in and curved down side to side to allow the legs to straddle the horse). Saddle points are unstable equilibria (because instability in any direction means unstable) and are of some conceptual importance in more advanced studies of physics or in mathematics when considering asymptotic convergence.
3.7.1: Energy Diagrams: Turning Points and Forbidden Regions
U(r) |
|
|
|
|
Ea |
|
|
|
|
|
|
Classically forbidden domains (shaded) |
|
|
Eb |
c |
c |
|
|
|
a b |
b |
b |
r |
|
|
K < 0 forbidden |
|
|
Ec |
|
|
|
|
|
|
|
Quadratic region |
|
|
|
|
K = E − U > 0 allowed |
|
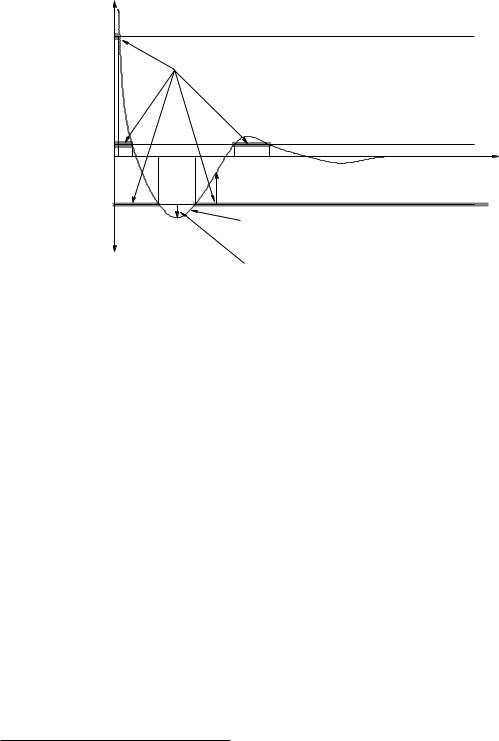
Figure 44: The same potential energy curve, this time used to illustrate turning points and classically allowed and forbidden regions. Understanding the role of the total energy on potential energy diagrams and how transitions from a higher energy state to a lower energy state can “bind” a system provide insight into chemistry, orbital dynamics, and more.
We now turn to another set of extremely useful information one can extract from potential energy curves in cases where one knows the total mechanical energy of the particle in addition to the potential energy curve. In figure 44 we again see the generic (Van der Waals) atomic interaction curve this time rather “decorated” with information. To understand this information and how to look at the diagram and gain insight, please read the following description very carefully while following along in the figure.
Consider a particle with total energy mechanical Ea. Since the total mechanical energy is a constant, we can draw the energy in on the potential energy axes as a straight line with zero slope
– the same value for all r. Now note carefully that:
K(r) = Emech − U (r) |
(340) |
which is the di erence between the total energy curve and the potential energy curve. The kinetic energy of a particle is 12 mv2 which is non-negative. This means that we can never observe a particle with energy Ea to the left of the position marked a on the r-axis – only point where Ea ≥ U lead to K > 0. We refer to the point a as a turning point of the motion for any given energy – when r = a, Emech = Ea = U (a) and K(a) = 0.
We can interpret the motion associated with Ea very easily. An atom comes in at more or less a constant speed from large r, speeds and slows and speeds again as it reaches the support of the potential energy90, “collides” with the central atom at r = 0 (strongly repelled by the hard core
90The “support” of a function is the set values of the argument for which the function is not zero, in this case a finite sphere around the atom out where the potential energy first becomes attractive.
Week 3: Work and Energy |
169 |
interaction) and recoils, eventually receding from the central atom at more or less the same speed it initially came in with. Its distance of closest approach is r = a.
Now consider a particle coming in with energy Emech = Eb. Again, this is a constant straight line on the potential energy axes. Again K(r) = Eb − U (r) ≥ 0. The points on the r-axis labelled b are the turning points of the motion, where K(b) = 0. The shaded regions indicate classically forbidden regions where the kinetic energy would have to be negative for the particle (with the given total energy) to be found there. Since the kinetic energy can never be negative, the atom can never be found there.
Again we can visualize the motion, but now there are two possibilities. If the atom comes in from infinity as before, it will initially be weakly attracted ultimately be slowed and repelled not by the hard core, but by the much softer force outside of the unstable maximum in U (r). This sort of “soft” collision is an example of an interaction barrier a chemical reaction that cannot occur at low temperatures (where the energy of approach is too low to overcome this initial repulsion and allow the atoms to get close enough to chemically interact.
However, a second possibility emerges. If the separation of the two atoms (with energy Eb, recall) is in the classically allowed region between the two inner turning points, then the atoms will oscillate between those two points, unable to separate to infinity without passing through the classically forbidden region that would require the kinetic energy to be negative. The atoms in this case are said to be bound in a classically stable configuration around the stable equilibrium point associated with this well.
In nature, this configuration is generally not stably bound with an energy Eb > 0 – quantum theory permits an atom outside with this energy to tunnel into the inner well and an atom in the inner well to tunnel back to the outside and thence be repelled to r → ∞. Atoms bound in this inner well are then said to be metastable (which means basically “slowly unstable”) – they are classically bound for a while but eventually escape to infinity.
However, in nature pairs of atoms in the metastable configuration have a chance of giving up some energy (by, for example, giving up a photon or phonon, where you shouldn’t worry too much about what these are just yet) and make a transistion to a still lower energy state such as that represented by Ec < 0.
When the atoms have total energy Ec as drawn in this figure, they have only two turning points (labelled c in the figure). The classically permitted domain is now only the values of r in between these two points; everything less than the inner turning point or outside of the outer turning point corresponds to a kinetic energy that is less than 0 which is impossible. The classically forbidden regions for Ec are again shaded on the diagram. Atoms with this energy oscillate back and forth between these two turning points.
They oscillate back and forth very much like a mass on a spring! Note that this regions is labelled the quadratic region on the figure. This means that in this region, a quadratic function of r − re (where re is the stable equilibrium at the minimum of U (r) in this well) is a very good approximation to the actual potential energy. The potential energy of a mass on a spring aligned with r and with its equilibrium length moved so that it is re is just 12 k(r − re)2 + U0, which can be fit to U (r) in the quadratic region with a suitable choice of k and U0.