


26 Part I – High-Fluid Content Liver Lesions
13 Hemangioma VI – Multiple with Perilesional Enhancement
Hemangiomas may be multiple in up to 10 % of cases. Multiple hemangiomas generally consist of a few scattered lesions. They often have atypical imaging features, including unusual appearance at US and CT, with or without perilesional enhancement or wedgeshaped transient arterial enhancement. Some lesions may be exophytic and may contain fibrotic septa. These findings in combination with multiplicity may mimic metastases, particularly at US and (single-phase) CT. Distinction from hepatic metastases is critical to avoid improper patient management.
Literature
1.Vilgrain V, Boulus L, Vullierme MP, et al. (2000) Imaging of atypical hemangiomas of the liver with pathologic correlation. Radiographics 20:379 – 397
2.Mitchell DG, Saini S, Weinreb J, et al. (1994) Hepatic metastases and cavernous hemangiomas: distinction with standard and triple-dose gadote- ridol-enhanced MR imaging. Radiology 193:49 – 57
3.Jang HJ, Kim TK, Park SJ, et al. (2003) Hepatic hemangioma: atypical appearances on CT, MR imaging, and sonography. AJR Am J Roentgenol 180:135 – 141
MR Imaging Findings
At MR imaging, multiple hemangiomas show low signal intensity on T1-weighted sequences and high signal intensity on T2-weight- ed sequences with well-defined margins; the surrounding liver may show signs of diffuse fatty infiltration. In the arterial phase, the lesions show variable enhancement including the typical peripheral nodular enhancement in some lesions, homogeneous enhancement in other lesions, with or without perilesional or wedge-shaped enhancement. In the delayed phase, all lesions show invariably persistent enhancement of the entire lesion with sharp margins with complete homogeneous enhancement of the surrounding liver (Figs. 13.1, 13.2). In some lesions, the presence of flow within some lesions may further improve the specificity of MR imaging (see Fig. 13.2E).
Differential Diagnosis
Multiplicity of hepatic lesions is often associated with liver metastases. Due to the lack of consistent soft tissue characteristics and routine multiphasic contrast-enhanced examinations, ultrasound and CT are often inconclusive in patients with multiple hepatic hemangiomas (Fig. 13.3). At MR imaging, a combination of high signal on T2-weighted images and persistent enhancement in the delayed phase facilitate the differentiation from (hypervascular) metastases.
Management
Based on MR imaging, unnecessary biopsies and diagnostic delay can be avoided.
13 Hemangioma VI – Multiple with Perilesional Enhancement 27
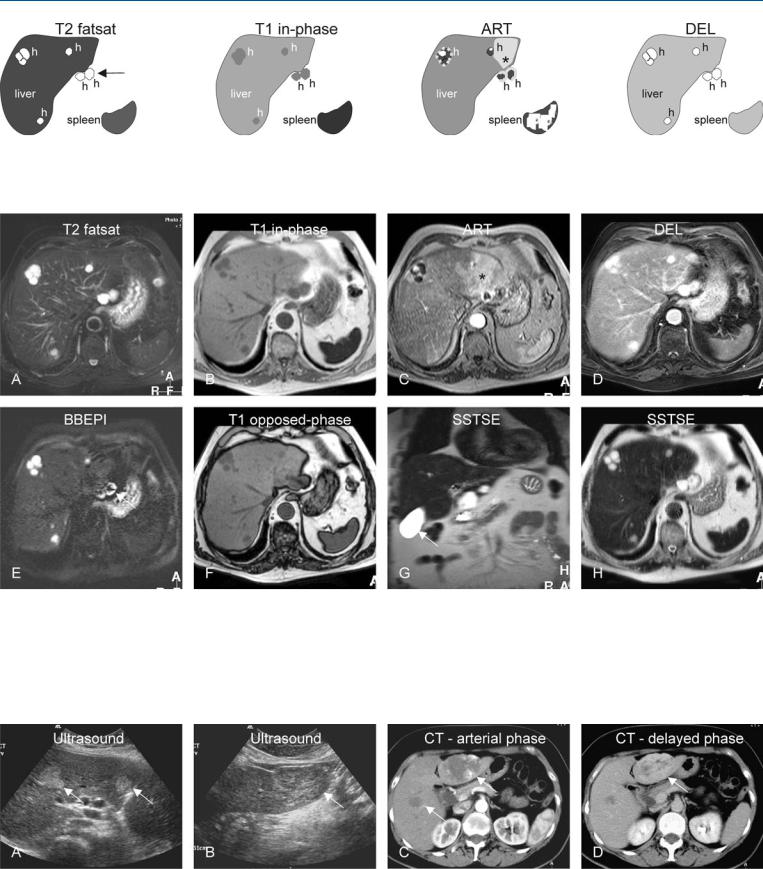
Fig. 13.1. Hemangioma, multiple, drawings. T2 fatsat: hemangiomas (h) appear very bright due to iron deposition in the liver and the spleen; two lesions are exophytic (arrow); T1 in-phase: hemangiomas are hypointense;
Fig. 13.2. Hemangioma, multiple, MRI findings. A Axial TSE image (T2 fatsat): Hemangiomas appear very bright with the abnormally darker liver and spleen due to iron deposition. Note that two lesions are exophytic (arrow). B Axial in-phase image (T1 in-phase): Hemangiomas are hypointense; the spleen appears very dark due to iron deposition. C Axial arterial phase image (ART): Hemangiomas show typical peripheral nodular enhancement. Note a wedge-shaped enhancement (*). D Axial delayed phase image (DEL):
the spleen appears very dark due to iron deposition; ART: hemangiomas typically show a peripheral nodular enhancement; wedge-shaped enhancement (*); DEL: hemangiomas retain contrast
Hemangiomas retain contrast. E Axial flow-sensitive black-blood EPI image (BBEPI): The exophytic hemangiomas show central darkening due to flow (bulk motion), which is confirmatory for exophytic hemangiomas (arrow). F Axial opposed-phase image (T1 opposed-phase): The liver shows mild diffuse steatosis. G Coronal and H axial SSTSE images (SSTSE): Due to the dark liver, hemangiomas appear more like high fluid-containing structures such as cysts (compare to the fluid in the gallbladder, arrow)
Fig. 13.3. Hemangioma, multiple (another patient known with colon carcinoma and misdiagnosed at CT with multiple metastases), ultrasound and CT findings. A US shows two echogenic lesions (arrows). B US shows a third lesion with mixed appearance (arrow). C Subsequent CT in the arterial phase: Two hem-
angiomas show peripheral nodular enhancement (arrows), which were mistaken for metastases. D CT in delayed phase: At least the larger lesion shows persistent enhancement, which is typical for an hemangioma
28 Part I – High-Fluid Content Liver Lesions
14 Hemorrhage
Liver-related hemorrhage or bleeding may be located within the liver (intrahepatic) or outside the liver (subcapsular or extracapsular). The location of the hemorrhage may be related to the mechanism of injury or volume of blood. Most collections occur after penetrating trauma or as a complication of interventional or surgical procedure. Spontaneous liver-related hemorrhage is a well known complication of solid liver lesions (see next case, p. 30). In addition, it can occur in coagulation disorders, during anticoagulation therapy, or as a complication of HELLP (hemolysis, elevated liver enzymes, low platelets) syndrome.
MR Imaging Findings
The MR imaging appearance of hemorrhage is related to the presence of different stages of blood breakdown products within the collections. Acute hemorrhage (within 2 – 3 days) shows fluid signal intensity behavior that is consistent with intracellular deoxyhemoglobin: fluid collection is homogeneous, and low on T1as well as markedly low on T2-weighted images. Subacute hemorrhage (within 3 – 5 days) shows fluid signal intensity behavior that indicates the presence of intracellular methemoglobin: fluid collection is intermediate to bright on T1and dark on T2-weighted images. In later stages, hemorrhage may have a T1 bright central part (intracellular methemoglobin) with a T1 as well as a T2 dark rim of hemosiderin (Figs. 14.1 – 14.3). Gradually, hemorrhage may resolve completely or remain visible as a focal abnormality predominantly composed of hemosiderin. Dark fluid collection on T2 is a distinctive feature of (sub)acute hemorrhage, which is particularly important in patients with suspected HELLP syndrome. CT and US findings of hemorrhage are often non-specific and may not provide adequate information.
Differential Diagnosis
In ambiguous cases, the differential diagnosis may include: (1) pyogenic liver abscess (recent hemoglobin levels as well as clinical history important); (2) cystic neoplasm (look for the enhancing wall and solid structures); and (3) solid tumor with hemorrhage (see p. 30).
Management
If hemorrhage occurs as a complication of a procedure, follow-up with imaging is recommended. If hemorrhage is a result of an underlying disease or condition, it is obvious that the focus of treatment will be the underlying cause.
Literature
1.Balci NC, Semelka RC, Noone TC, Ascher SM (1999) Acute and subacute liver-related hemorrhage: MR findings. Magn Reson Imaging 17: 207 – 211
2.McGill DB, Rakela J, Zinsmeister AR, et al. (1990) A 21 year experience with major hemorrhage after percutaneous liver biopsy. Gastroenterology 99:1396 – 1400
3.Schroeder MD, Brandsetter MD, Vogelsang H, et al. (1997) Massive intrahepatic hemorrhage as first manifestation of PAN. Hepatogastroenterology 44:148 – 152
14 Hemorrhage 29
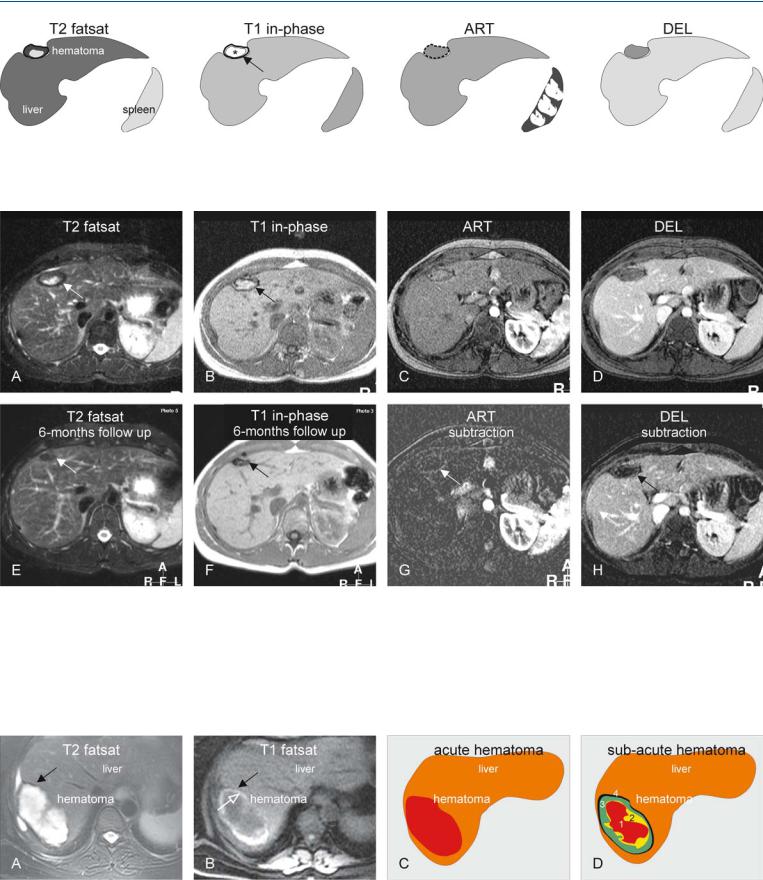
Fig. 14.1. Hematoma, drawings. T2 fatsat: hematoma shows a bright (fluidlike) area centrally with a dark rim mainly composed of hemosiderin; T1 inphase: hematoma shows high signal centrally mainly caused by methemo-
Fig. 14.2. Hemorrhage, typical MRI findings. A Axial fat-suppressed T2-w TSE image (T2 fatsat) shows a hematoma (arrow) with high signal centrally and a thick dark rim (representing mainly hemosiderin). B Axial in-phase image (T1 in-phase): The hematoma is typically bright centrally (*) due to the T1-shortening effect of methemoglobin and the dark rim is caused by hemosiderin (arrow). C Axial GRE image in the arterial phase (ART): The enhancement is difficult to assess due to the high signal prior to the contrast injection. D Axial delayed phase (DEL): The hematoma appears to remain
globin (*), which is surrounded by a dark rim of hemosiderin (arrow); ART: hematoma shows no enhancement; DEL: hematoma remains unenhanced
unenhanced. E Axial TSE image (T2 fatsat at 6 months) shows the hematoma with decreased size and signal (arrow). F Axial in-phase image (T1 in-phase at 6 months) shows the hematoma predominantly composed of hemosiderin (arrow). G A subtraction image (arterial phase) shows convincingly the lack of enhancement (arrow). H A subtraction image (delayed phase) confirms that the hematoma remains unenhanced (arrow), facilitating its distinctions from a hemorrhagic tumor
Fig. 14.3. Hemorrhage, MRI appearance and schematic explanation. A, B Hemosiderin rim appears dark on T2 as well as on T1 (susceptibility effect), which is followed by another rim with very bright signal on T1 (open arrow) due to T1 shortening of methemoglobin. C Acute hematoma behaves very similarly
to simple fluid at MR imaging. D Subacute hematoma is often composed of
(1) oxyhemoglobin; (2) deoxyhemoglobin; (3) methemoglobin; and (4) hemosiderin, with a characteristic combination of signal intensities

30 Part I – High-Fluid Content Liver Lesions
15 Hemorrhage – Within a Solid Tumor
Several solid liver lesions, including hepatocellular adenomas, hepatocellular carcinomas, and some (neuroendocrine) liver metastases, may show hemorrhage. The distinction between hemorrhage and solid parts may be important for diagnosis, follow-up, and treatment. At US and CT, it may be challenging to make a distinction between the solid and hemorrhagic components of the liver lesion. As hematomas have a distinct appearance, MR imaging is particularly helpful in the identification and distinction of the hemorrhage within liver tumors.
Literature
1.Casillas VJ, Amendola MA, Gascue A, et al. (2000) Imaging of nontraumatic hemorrhagic hepatic lesions. Radiographics 20:367 – 378
2.Prasad SR, Wang H, Rosas H, et al. (2005) Fat-containing lesions of the liver: radiologic-pathologic correlation. Radiographics 25:321 – 331
3.Kelekis NL, Semelka RC, Woosley JT (1996) Malignant lesions of the liver with high signal on T1-weighted MR images. J Magn Reson Imaging 6: 291 – 294
MR Imaging Findings
The MR imaging appearance of hemorrhage is related to the presence of different stages of blood breakdown products within the collections (please see Chap. 14). Particularly subacute hemorrhage shows fluid signal intensity behavior that indicates the presence of intracellular methemoglobin: fluid collection is intermediate to bright on T1and dark on T2-weighted images. Particularly solid liver lesions will have predominantly low signal intensity on T1-weighted images, whereas hemorrhage will stand out with high signal intensity. This is especially the case on the T1-weighted sequences with fat suppression. Solid liver lesions often have increased heterogeneous signal intensity on T2-weighted images and show variable enhancement after injection of gadolinium. The combination of findings on T1and T2-weighted, and contrast-en- hanced, images facilitates distinction with a high level of confidence (Figs. 15.1, 15.3). At US and CT, distinguishing between hemorrhage and various solid components may be difficult (Fig. 15.3).
Differential Diagnosis
Other common liver lesions that may show high signal on T1-weighted sequences include fat containing lesions such as hepatocellular adenomas and carcinomas (apply chemical shift imaging and/or fat suppression for distinction from hemorrhage), melanoma metastases (apply fat suppression for distinction), and proteincontaining liver lesion (usually less bright than hemorrhage).
15 Hemorrhage – Within a Solid Tumor 31
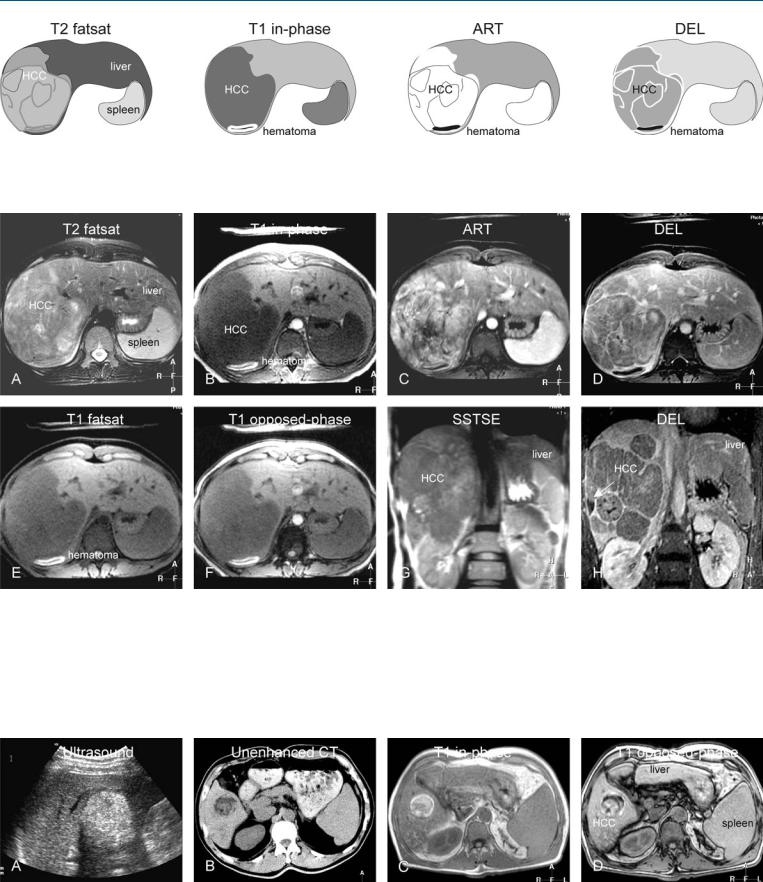
Fig. 15.1. Hematoma within a hepatocellular carcinoma (HCC) in a non-cirrhotic liver, drawings. T2 fatsat: large HCC is visible without detectable hematoma; T1 in-phase: hematoma is very bright compared to other tissues, due to the
Fig. 15.2. Hematoma within an HCC in a non-cirrhotic liver, MRI findings. A Axial TSE image (T2 fatsat): A large, heterogeneous HCC is visible in a non-cir- rhotic liver, without detectable hematoma. B Axial in-phase image (T1 inphase): Hematoma is very bright compared to other tissues, due to the presence of methemoglobin. C Axial arterial phase image (ART): Hematoma shows no enhancement; HCC shows intense heterogeneous enhancement. D Axial delayed phase image (DEL): Hematoma remains unenhanced; HCC shows washout with multiple enhanced intratumoral septae. E Axial fat-sup-
presence of methemoglobin; ART: hematoma shows no enhancement; HCC shows heterogeneous enhancement; DEL: hematoma remains unenhanced; HCC shows washout with enhanced septae
pressed T1 GRE image (T1 fatsat): Hematoma appears as the brightest structure in the image, mainly due to fat suppression. F Axial opposedphase image (T1 opposed-phase) shows no sign of fatty infiltration. G Coronal single-shot TSE image (SSTSE): Hematoma is not visible within the large HCC. H Coronal delayed phase image (DEL): Hematoma remains unenhanced (arrow); HCC shows washout with multiple enhanced intratumoral septae
Fig. 15.3. Hemorrhagic and fatty HCC in a cirrhotic liver (another patient), US, CT and MRI findings. A US showed an echogenic indeterminate lesion. B Unenhanced CT revealed a fatty lesion and suggested hepatocellular adenoma. C T1 in-phase MR image shows a bright lesion in a cirrhotic liver. D T1 op-
posed-phase image shows signal loss (fatty lesion) with persistent high signal (hematoma); gadolinium-enhanced images (not shown) showed an enhancing solid lesion. Based on MRI, a fatty as well as hemorrhagic HCC was diagnosed