

198 Part V – Biliary Tree Abnormalities
92 Caroli’s Disease I – Intrahepatic with Segmental Changes
Caroli’s disease is an autosomal recessive disorder comprising communicating cavernous ectasia of the intrahepatic bile ducts. The disease is considered among the ductal plate abnormalities that occur at different levels in the developing biliary tree, leading to several clinicopathologic entities. The abnormalities can be present at the level of the large ducts (Caroli’s disease), small ducts (congenital hepatic fibrosis), or both (congenital hepatic fibrosis with Caroli’s disease, also called Caroli’s syndrome). Clinically, the entity is divided as follows: type I (Caroli’s disease) that is rare and is characterized by recurrent episodes of cholangitis, and type II (Caroli’s disease associated with fibrosis) that is more frequent and is characterized by fibrosis and portal hypertension. Ultrasound (US) and computed tomography (CT) can show the multiple intrahepatic cysts in close relation to the biliary system. They fail however to actually demonstrate the communication between the two, which is important in distinguishing Caroli’s disease from polycystic liver disease or multiple abscesses. Also at endoscopic retrograde cholangiopancreatography (ERCP) and cholangiography, it may difficult to get an overview of the entire biliary tree. MR imaging provides a better view of the biliary as well as the parenchymal system non-invasively.
Literature
1.Levy AD, Rohrmann CA Jr, Murakata LA, et al. (2002) Caroli’s disease. AJR 179:1053 – 1057
2.Desmet VJ (1992) Congenital diseases of intrahepatic bile ducts: variations on the theme „ductal plate malformation.“ Hepatology 16:1069 – 1083
3.Caroli J, Soupault R, Kossakowski J, Plocker L, Paradowska M (1958) La dilatation polykystique cong´enitale des voies biliaires intrah´epatiques: essai de classification. Sem Hop Paris 34:128 – 135
MR Imaging Findings
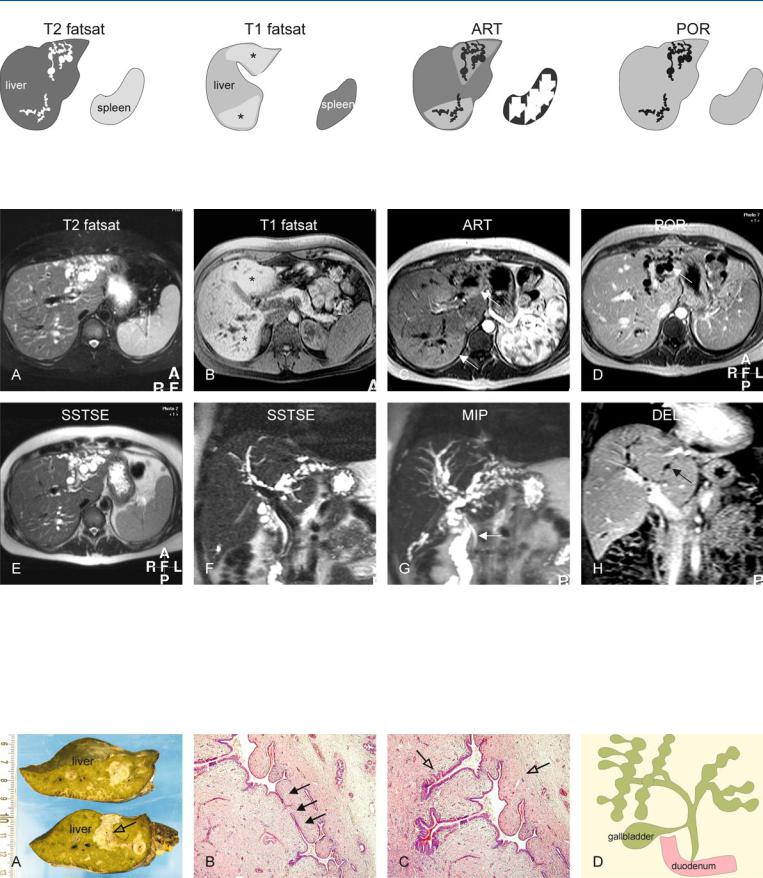
T2-weighted and magnetic resonance cholangiopancreatography (MRCP) sequences show multiple saccular dilatations of the intrahepatic bile ducts. The abnormalities may be segmental with increased signal of the parenchyma on the pre-contrast T1-weighted sequences, likely due to biliary stasis. The abnormal parenchyma may show diffuse increased periportal enhancement in the arterial phase, fading to isointensity in the delayed phase. This may indicate inflammation. On the delayed phase imaging, the unenhanced bile ducts provide another possibility to assess for communicating cysts (Figs. 92.1, 92.2).
Pathology
Gross pathology and histology of Caroli’s disease are characterized by the saccular dilatation of the biliary tree with or without fibrosis, and stasis of bile duct. Periductal inflammation and fibrosis are often present in long-standing disease (Fig. 92.3).
92 Caroli’s Disease I – Intrahepatic with Segmental Changes 199
Fig. 92.1. Caroli’s disease, drawings. T2 fatsat: typical fusiform dilatations are present in the left and right liver; T1 fatsat: (at a different anatomic level) affected areas show increased signal due to cholestasis (*); ART: increased
Fig. 92.2. Caroli’s disease, typical MRI findings. A Axial fat-suppressed T2-w TSE image (T2 fatsat): Typical fusiform dilatations of the bile ducts are visible in the left and the right liver, with atrophy on the left side. B Axial fatsuppressed T1-w image at a lower anatomic level (T1 fatsat): Increased signal of the liver parenchyma is probably caused by cholestasis (*). C Axial arterial phase image (ART): Increased enhancement around the dilated ducts is most likely caused by cholangitis (arrows). D Axial portal phase image (POR): The enhanced areas become isointense indicating their benign na-
enhancement around the dilated ducts is probably caused by cholangitis; POR: the enhanced areas become isointense confirming the benign nature of the increased arterial enhancement
ture. Note the non-enhancing dilated bile ducts (arrow). E Axial single-shot turbo spin echo image (SSTSE): The dilated ducts can be followed up to the subcapsular region of the liver. F Coronal SSTSE image (SSTSE): Typical dilatations of the bile ducts are visible. G Maximum intensity projection of the SSTSE (MIP): The full extent of the affected bile ducts is visible with sparing of the common bile duct (arrow). H Coronal delayed phase image (DEL): The fusiform dilated ducts are well visible (arrow)
Fig. 92.3. Caroli’s disease, pathology (explant of another patient with long-stand- ing disease). A Photograph of the explant shows a greenish liver due to cholestasis. The bile ducts are surrounded by fibrosis (open arrow). B, C Photomicrographs show typical fusiform dilatations and narrowing of the bile ducts
(arrows), which are surrounded by inflammatory cells (open arrows). H&E, × 100. D A drawing (based on a Caroli’s original drawing) shows typical fusiform dilatations of the biliary tree

200 Part V – Biliary Tree Abnormalities
93 Caroli’s Disease II – Involvement of the Liver and Kidneys
Caroli’s disease is a form of congenital (with likely autosomal recessive inheritance) dilatation of intrahepatic bile ducts. It usually manifests in childhood. The association of Caroli’s disease with extrahepatic bile duct dilatation may be present in up to 21 % of patients. Repeated bouts of cholangitis, stone formation, and stone passage may explain extrahepatic duct dilatation in some patients with Caroli’s disease or Caroli’s syndrome. Caroli’s disease may also occur in association with cysts in the kidneys. In such cases, Caroli’s disease should be distinguished from adult polycystic liver and kidney disease. Cholangiocarcinoma is a well-known complication of long-standing Caroli’s disease. Since the original description by Caroli et al. in 1958, a number of case reports and small series have appeared in the radiology literature describing the cholangiographic, sonographic, CT, and MR imaging features of the disease.
Literature
1.Mortele et al. (2001) Cystic focal liver lesions in the adult. Radiographics 21:895 – 910
2.Krause et al. (2002) MRI for evaluation of congenital bile duct abnormalities. JCAT 26:541 – 552
3.Desmet VJ (1992) Congenital diseases of intrahepatic bile ducts: variations on the theme „ductal plate malformation.“ Hepatology 16:1069 – 1083
4.Caroli J, Soupault R, Kossakowski J, Plocker L, Paradowska M (1958) La dilatation polykystique cong´enitale des voies biliaires intrah´epatiques: essai de classification. Sem Hop Paris 34:128 –135
5.Todani T, Watanabe Y, Narusue M, et al. (1977) Congenital bile duct cysts: classification, operative procedures, and review of thirty-seven cases including cancer arising from choledochal cyst. Am J Surg 134:263 – 269
MR Imaging Findings
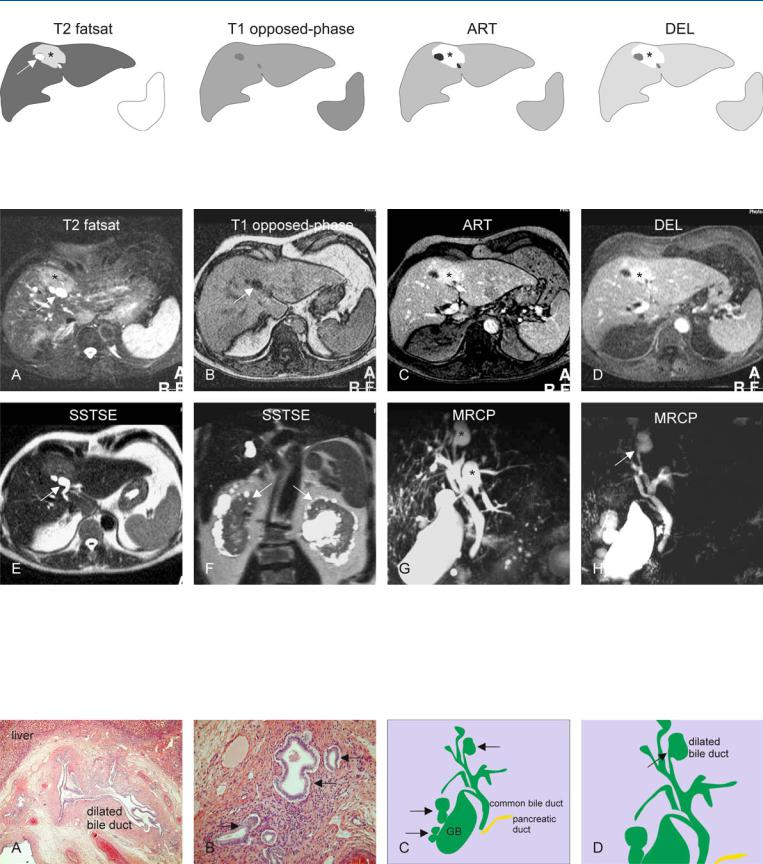
On T2-weighted images, isolated hyperintense cystic lesions may be present as part of Caroli’s disease. Occasionally, the commashaped appearance of such cystic liver lesions may suggest biliary connection. MRCP, however, allows the evaluation of the full extent of the disease. In addition, both kidneys may show cystic lesions as well. Compared to pathology, MR imaging allows the assessment of multiple organs in a single study (Figs. 93.1 – 93.3).
Differential Diagnosis
This includes primary sclerosing cholangitis (long stenoses and dilatations; 70 % have ulcerative colitis), recurrent pyogenic cholangitis, polycystic liver disease, a choledochal cyst, biliary papillomatosis, and (occasionally) obstructive biliary dilatation.
Management
This form has a very unfavorable prognosis and treatment consists of segmental liver resection or liver transplantation.
93 Caroli’s Disease II – Involvement of the Liver and Kidneys 201
Fig. 93.1. Caroli’s disease, drawings. T2 fatsat: cyst-like abnormality (arrow) is surrounded by tissue with high signal (*); T1 opposed-phase: no tissue abnormalities are visible; ART: local increased enhancement around the dilat-
Fig. 93.2. Caroli’s disease, liver and kidney involvement, MRI findings. A Axial fat-suppressed T2-w TSE image (T2 fatsat): Cyst-like dilated bile ducts (arrow) are surrounded by an area of the liver with increased signal intensity
(*). B Axial opposed-phase T1-w image (T1 opposed-phase): Dilated bile duct (arrow) is visible without parenchymal abnormalities. The area with high signal on T2 has almost normal signal on T1. C Axial arterial phase image (ART): Increased enhancement around the dilated ducts is most likely
ed ducts is probably caused by cholangitis (*); DEL: the enhanced area remains visible without getting heterogeneous, suggesting a benign lesion (*)
caused by cholangitis (*). D Axial delayed phase image (DEL) shows persistent enhancement without signs of washout of contrast (*). E Axial singleshot turbo spin-echo (SSTSE) shows typical comma-shaped dilated bile duct (arrow). F Coronal SSTSE image (SSTSE) shows cystic changes in both kidneys (arrows). G MRCP provides an overview of the dilated intrahepatic bile ducts (*) as well as the gallbladder (GB). H MRCP from another angle shows the cyst-like structures connected to the bile ducts (arrow)
Fig. 93.3. Caroli’s disease, pathology (another patient), drawings. A Photomicrograph shows dilated intrahepatic bile ducts surrounded by fibrosis and inflammation. H&E, × 100. B Photomicrograph shows typical fusiform dilatations of several bile ducts (arrows). H&E, × 200. C Drawing (based on
MRCP) shows typical dilated intrahepatic bile ducts (arrows) (GB = gallbladder). D A detailed view of the drawing shows the cyst-like dilatation with its narrow connection to the biliary tree (arrow)

202 Part V – Biliary Tree Abnormalities
94 Cholelithiasis (Gallstones)
Cholelithiasis (gallstone disease) remains one of the most common medical problems leading to surgical intervention. Gallstones represent a polygenic disorder that affects more than 30,000,000 (10 %) Americans and results in more than 750,000 cholecystectomies in the United States annually. Risk factors include age, gender, race, parity, obesity, and diabetes. A family history of gallstones also has been identified as a risk factor, suggesting that genetics play a role in gallstone formation. Genetic factors are responsible in at least 30 % of cases of symptomatic gallstone disease. Approximately three-fourths of the patients with gallstones in the United States have stones that are composed primarily of cholesterol. The pathogenesis of cholesterol gallstones is known to be multifactorial. Approximately 35 % of patients with gallstones develop complications or recurrent symptoms leading to cholecystectomy. The sensitivity of abdominal US for cholelithiasis or gallbladder stones is in excess of 95 %. The sensitivity of conventional CT in the setting of suspected choledocholithiasis ranges from 76 % to 90 %. Because up to 15 – 25 % of patients with acute calculous cholecystitis have choledocholithiasis, MRCP may play a role in gallstone disease, particularly in patients with gallstone pancreatitis, and cystic duct and gallbladder neck calculi.
MR Imaging Findings
At MR imaging, the gallstones are visible as a signal void within the bright fluid of the gallbladder on MRCP and heavily T2-weighted sequences. A combination of thin-slice, single-shot turbo or fast spin-echo and two-dimensional thick-slab MRCP sequences are essential components of the MR imaging protocol. On T1-weighted images the cholesterol stones often have high signal intensity (Figs. 94.1 – 94.3). MRCP should be performed in combination with gadolinium-enhanced imaging to demonstrate any unexpected soft tissue abnormalities such as cholecystitis or gallbladder tumors.
Management
Laparoscopic cholecystectomy is currently the standard operation for gallstone disease.
Literature
1.Cooperberg PL, Burhenne HJ (1980) Real-time ultrasonography diagnostic technique of choice in calculous gallbladder disease. N Engl J Med 302:1277 – 1279
2.Kelekis NL, Semelka RC (1996) MR imaging of the gallbladder. TMRI 8:312 – 320
3.Park MS, Yu JS, Kim YH, et al. (1998) Acute cholecystitis: comparison of MR cholangiography and US. Radiology 209:781 – 785
4.Vitellas KM, Keogan MT, Spritzer CE, et al. (2000) MR cholangiopancreatography of bile and pancreatic duct abnormalities with emphasis on the single-shot fast spin-echo technique. Radiographics 20:939 – 957
5.Shamiyeh A, Wayant W (2005) Current status of laparoscopic therapy of cholecystolithiasis and common bile duct stones. Dig Dis 23:119 – 126

94 Cholelithiasis (Gallstones) 203
Fig. 94.1. Cholelithiasis (gallstones), drawings. SSTSE: coronal image shows two small stones in the gallbladder. Normal appearance of the common bile duct and the pancreatic duct. T1 in-phase: the stones are not visible in the
Fig. 94.2. Cholelithiasis (gallstones; two different patients), typical MRI findings. A Coronal SSTSE image (SSTSE) shows two small stones in the gallbladder. Note the normal appearance of the common bile duct and the pancreatic duct. B Axial in-phase image (T1 in-phase): The stones are not visible in the gallbladder due to their similar signal intensity. C Axial SSTSE image (SSTSE): Stones are visible as signal void within the bright gallbladder. D Axial TSE (T2 fatsat): The stones show improved visibility due to fat sup-
gallbladder; SSTSE: dark stones are present within the bright gallbladder; T2 fatsat: the stones show improved visibility due to fat suppression and higher signal-to-noise ratio
pression and higher signal-to-noise ratio. E–H Another patient with multiple gallstones, which are better visible on the cross-sectional SSTSE and SSTSE fatsat images than on the MRCP images due to partial volume and other issues. 2D slab MRCP (acquisition time: 2 s) is a direct imaging with sharper definition of the gallbladder and the biliary tree. 3D MRCP is a MIP of the individual thin-sections acquired during free-breathing and respira- tory-triggering (acquisition time: 5 – 10 min!)
Fig. 94.3. Cholelithiasis, bright T1 and moving stones (two different patients), MRI findings. A Axial TSE image (T2 fatsat) shows a small stone as a signal void. B Axial T1 image (T1 fatsat): Parts of the small stone are bright, likely due to the presence of cholesterol. C Axial SSTSE image (SSTSE) shows a
large stone in the fundus of the gallbladder. D Axial SSTSE image (SSTSE fatsat) (10 min later) shows the stone in another location with more filling of the gallbladder