


40 Part IIA – Metastases: Colorectal
19 Colorectal Metastases III – Metastasis Versus Cyst
Benign liver lesions are common; the exact prevalence is unknown, but some studies suggest that benign liver masses may be found in more than 20 % of the general population. Recent studies suggest that small (< 15 mm) liver lesions seen at CT are benign in more than 80 % of patients with known malignancy. With the application of multi-row detector CT and thinner collimation, it is likely that more liver lesions will be detected that will need additional imaging for characterization, most likely with MR imaging. As colorectal liver metastases are the most common malignant liver lesions, they may concur with other common benign liver lesions such as cysts and hemangiomas. It is particularly important to distinguish benign from metastatic and primary malignant lesions.
Literature
1.Karhunen PJ (1986) Benign hepatic tumours and tumour-like conditions in men. J Clin Pathol 39:183 – 188
2.Schwartz LH, Gandras EJ, Colangelo SM, et al. (1999) Prevalence and importance of small hepatic lesions found at CT in patients with cancer. Radiology 210:71 – 74
3.Haider MA, Amital MM, Rappaport DC, et al. (2002) Multi-detector row helical CT in preoperative assessment of small (1.5 cm) liver metastases: is thinner collimation better? Radiology 225:137 – 142
4.Yoon SS, Tanabe TK (1999) Surgical treatment and other regional treatments for colorectal cancer liver metastases. Oncologist 4:197 – 208
MR Imaging Findings
At MR imaging, cysts are low in signal intensity on T1-weighted images, high in signal intensity on T2-weighted images, and retain signal intensity on longer echo time (e.g., > 120 ms) T2-weighted images. After injection of contrast, cysts do not show any enhancement. Delayed contrast-enhanced imaging may be useful to ensure that lesions are cysts and not poorly vascularized metastases that show gradual enhancement. T2-weighted sequences with long TE in combination with delayed phase images are especially effective at showing small ( 5 mm) cysts. Colorectal metastases often have a typical target-like appearance on T2-weighted images and show irregular ring-shaped enhancement after injection of gadolinium (Figs. 19.1 – 19.3).
Management
In the United States, more than 50 % of patients (in 1998, 56,000 of 131,600 patients) who die from colorectal cancer have liver metastases at autopsy. Of those who have colorectal liver metastases, 10 – 25 % are candidates for surgical resection, and the 5-year survival rate following resection of isolated colorectal liver metastases can be as high as 38 %. Without any treatment, the survival rate is less than 1 %. For the remaining 75 – 90 % of patients with liver metastases who are not amenable to surgery, several new therapies have been developed.
19 Colorectal Metastases III – Metastasis Versus Cyst 41
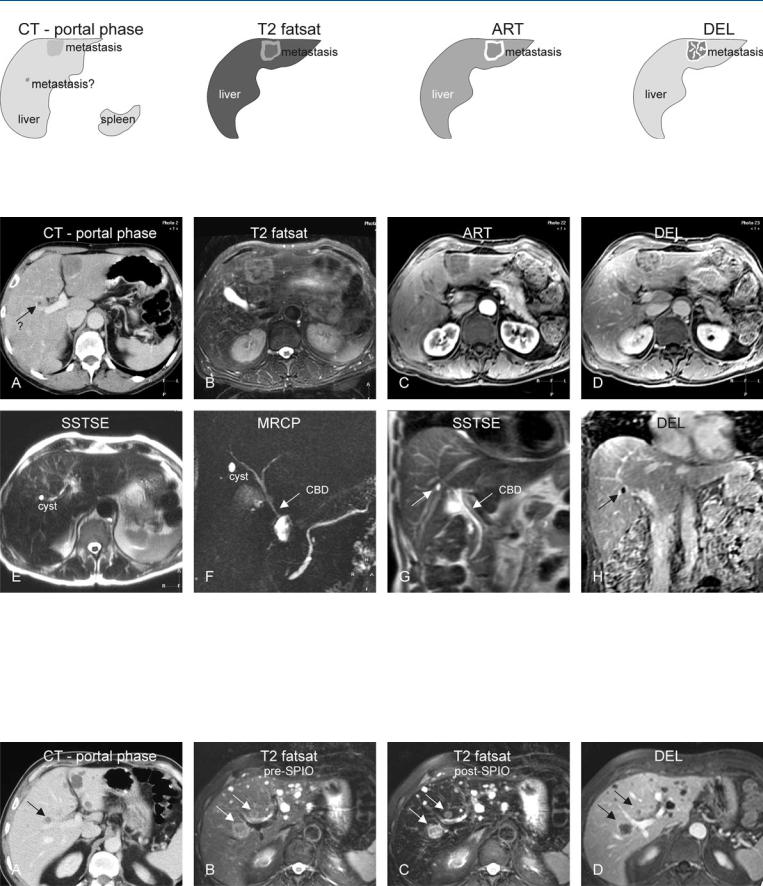
Fig. 19.1. Metastasis, colorectal, a second lesion indeterminate at CT, drawings.
CT in portal phase: metastasis is hypodense with faint enhancement; the second lesion was said to be too small to characterize with certainty; T2 fat-
Fig. 19.2. Metastasis, colorectal, a second lesion indeterminate at CT, MRI findings. A Axial CT in portal phase shows the metastasis in the left liver as a hypodense lesion with faint enhancement. A second lesion in the right liver was considered to be too small to characterize. B Axial TSE image (T2 fatsat): Metastasis is predominantly hyperintense with a typical target configuration. C Axial arterial phase image (ART): Metastasis shows typical irregular ring-shaped enhancement. D Axial delayed phase image (DEL): Metastasis becomes heterogeneous. E Axial SSTSE image with a TE of 120 ms at a
sat: metastasis has a typical target configuration; ART: metastasis shows a typical irregular ring-shaped enhancement; DEL: metastasis shows heterogeneous enhancement
different anatomic level shows the second lesion as a typical cyst with very high signal intensity. F Magnetic resonance cholangiopancreatography (MRCP) with a TE of about 1000 ms confirms the presence of a very bright, fluid containing cyst (CBD common bile duct). G Coronal SSTSE (SSTSE) shows the cyst within the right liver (arrow) and its relationship to the biliary tree. H Coronal delayed phase image (DEL) clearly shows the unenhanced small cyst (arrow)
Fig. 19.3. Metastases, colorectal, multiple lesions in another patient with indeterminate CT, MRI findings. A Axial CT in portal phase shows possible growth in one of the lesions that was considered to be a cyst (arrow) like several other liver lesions. B Axial TSE image (T2 fatsat) prior to the uptake of superparamagnetic iron oxide (SPIO): shows two metastases with typical target
configuration (arrows) and a lower signal than multiple liver cysts. C Axial TSE image (T2 fatsat) after the uptake of SPIO confirms the metastases (arrows) in a much darker liver. D Axial delayed phase image (DEL): Metastases have a typical ring-shaped enhancement (arrows)

42 Part IIA – Metastases: Colorectal
20 Colorectal Metastases IV – Metastasis Versus Hemangiomas
Colorectal metastases may concur with hemangiomas in the liver. Especially small hemangiomas and hemangiomas with atypical features like unusual (perilesional) enhancement, shunting, inflammation, intratumoral hemorrhage, and compression by adjacent structures may cause difficulty in diagnosis at US and CT. Based on T1and T2-weighted and routine dynamic gadoliniumenhanced sequences, MR imaging has the ability to make an accurate diagnosis in the majority of cases and hence to expedite the patient management.
Literature
1.Hussain SM, Semelka RC (2005) Liver masses. Magn Reson Imaging Clin N Am 13:255 – 275
2.Vilgrain V, Boulos L, Vullierme MP, et al. (2000) Imaging of atypical hemangiomas of the liver with pathologic correlation. Radiographics 20:379 – 397
3.Semelka RC, Brown ED, Ascher SM, et al. (1994) Hepatic hemangiomas: A multi-institutional study of appearance on T2-weighted and serial gad- olinium-enhanced gradient-echo MR images. Radiology 192:401 – 406
MR Imaging Findings
At MR imaging, colorectal metastases often have a typical targetlike appearance on T2-weighted images with moderately high signal intensity, and show irregular, continuous, ring-shaped enhancement in the arterial phase after injection of gadolinium, and washout in the delayed phase (see also Chap. 17 for a detailed description). Typical hemangiomas are hypointense on T1and moderately hyperintense on T2-weighted images, and show peripheral nodular enhancement. The smaller the lesion the smaller the enhanced peripheral nodules will be. In the delayed phase, most hemangiomas show persistent enhancement as opposed to metastases, which show washout in delayed phase. Therefore, a combination of T2-weighted images and enhancement pattern is very specific, and allows characterization of even very small liver lesions (Figs. 20.1 – 20.3). In a majority of such cases, biopsy may technically be challenging and is often unnecessary.
Management
State-of-the-art MR imaging allows a distinction between metastases and concurrent hemangiomas with high accuracy and can avoid unnecessary costs and delays in patient management. Currently, most centers apply a very aggressive approach toward colorectal liver metastases. Confident imaging diagnoses play an essential role in guiding such approaches. In this context, MR imaging plays a pivotal role in the management of patients with liver lesions.
20 Colorectal Metastases IV – Metastasis Versus Hemangiomas 43
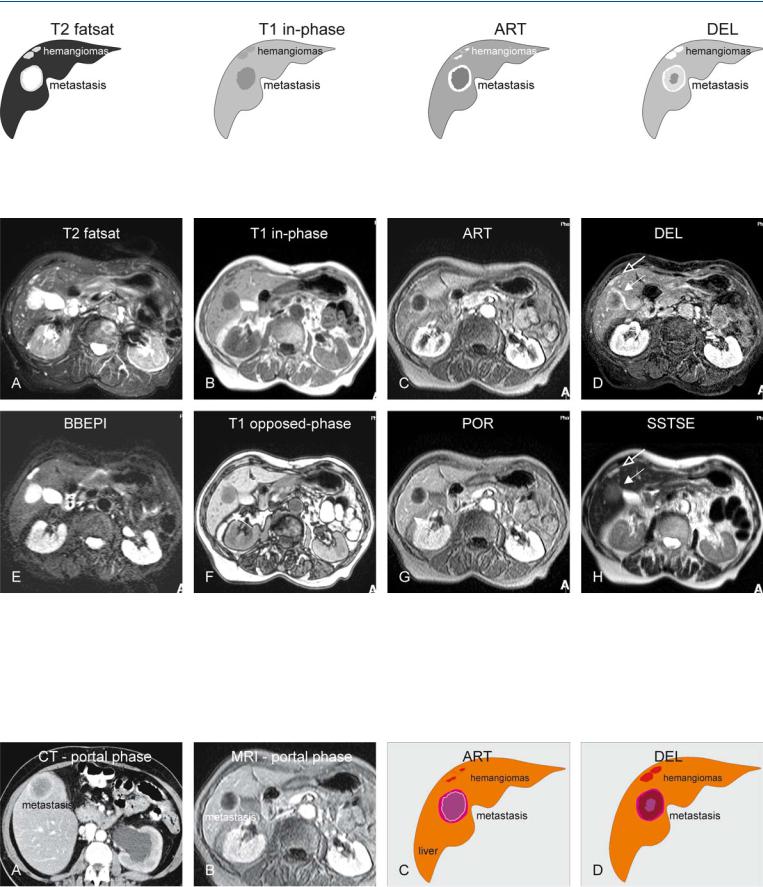
Fig. 20.1. Metastasis, with concurrent hemangiomas, drawings. T2 fatsat: metastasis and hemangiomas are hyperintense to the liver; T1 in-phase: lesions are hypointense to the liver; ART: metastasis shows an irregular ring-shaped
Fig. 20.2. Metastasis, with concurrent hemangiomas, MRI findings. A Axial fatsat T2-w TSE image (T2 fatsat): Metastasis and hemangiomas are hyperintense to the liver. B Axial in-phase T1-w image (T1 in-phase): Metastasis and hemangiomas are hypointense to the liver. C Axial arterial phase image (ART): Metastasis shows irregular ring-shaped enhancement. The enhancement of the hemangiomas is less obvious. D Axial delayed phase image (DEL): Metastasis shows heterogeneous and persistent ring-shaped enhancement (solid arrow). Hemangiomas show homogeneous enhancement (open arrow).
enhancement. The enhancement of hemangiomas is less obvious. DEL: metastasis shows heterogeneous and persistent rim enhancement. Hemangiomas show homogeneous enhancement
E Axial black-blood echoplanar imaging (BBEPI): Better conspicuity of the lesions is mainly due to the darker vessels. F Axial opposed-phase T1-w GRE image (T1 opposed-phase) shows no sign of fatty infiltration. G Axial portal phase image (POR): Hemangiomas have almost become isointense due to the progressing enhancement. H Axial SSTSE with a long TE of 120 ms shows the solid metastasis much darker (solid arrow) than the non-solid hemangiomas (open arrow)
Fig. 20.3. Metastasis, enhancement pattern on CT and MRI, and drawings. A CT in the portal phase shows a thick irregular ring-shaped enhancement. Note also the left-sided hydronephrosis caused by a recurrent colorectal tumor in the pelvic cavity. B MRI in the portal phase shows a similar enhancement
pattern. C Drawing illustrates the ring-shaped versus peripheral nodular enhancement. D Drawing illustrates the persistent ring-shaped (metastasis) and homogeneous enhancement (hemangioma)