

68 Part IIB – Metastases: Non-Colorectal
32 Neuroendocrine Tumor V – Peritoneal Spread
Peritoneal carcinomatosis has been described in association with neuroendocrine tumors. Overall peritoneal spread from neuroendocrine tumors can occur in 10 % of cases. Carcinoid tumors produce peritoneal spread in 27 % and non-gastrinoma pancreatic tumors in 11 % of cases. Peritoneal spread from gastrinoma is rare. In addition to the nature of the primary tumor, the size of the primary tumor of > 5 cm is associated with the presence of peritoneal disease from pancreatic endocrine tumors. In patients with carcinoid tumors, an ileal primary tumor is more often associated with peritoneal spread than carcinoid tumor at other locations. Patients with peritoneal metastases can also have concurrent liver metastases. However, it should be kept in mind that capsular implants may show ingrowths and mimic liver lesions at imaging. Particularly, MR imaging can accurately detect peritoneal nodules, liver capsular nodules, ascites, and presence of soft tissue masses within the mesentery as well as in the greater omentum.
Literature
1.Vasseur B, Cadiot G, Zins M, et al. (1996) Peritoneal carcinomatosis in patients with digestive endocrine tumors. Cancer 78:1686 – 92
2.Lebtahi R, Cadiot G, Sarda L, et al. (1997) Clinical impact of somatostatin receptor scintigraphy in the management of patients with neuroendocrine gastroenteropancreatic tumors. J Nucl Med 38:853 – 8
3.Krenning EP, Kwekkeboom DJ, Bakker WH, et al. (1993) Somatostatin receptor scintigraphy with [111In-DTPAD-Phe1]- and [123I-Tyr3]-octreoti- de: the Rotterdam experience with more than 1,000 patients. Eur J Nucl Med 20:716 – 31
4.Berger JF, Laissy JP, Limot O, et al. (1996) Differentiation between multiple liver hemangiomas and liver metastases of gastrinomas: value of enhanced MRI. JCAT 20:349 – 55
MR Imaging Findings
At MR imaging, the peritoneal carcinomatosis with capsular spread to the liver presents as high signal intensity on T2-weighted images with increased thickness of the peritoneal lining and irregularity of the liver capsule. Some lesions around the liver may become large and show ingrowths into the liver and may mimic liver lesions. At T1-weighted images the findings are non-specific. After injection of gadolinium, in the arterial phase, the nodular component and thickened peritoneal and capsular lining show increased enhancement which persists in the later phases. Based on the sequences with high soft tissue contrast and routine gadolinium-enhanced imaging, MR imaging provides more accurate information than other modalities including CT (Figs. 32.1 – 32.3). MR imaging can better distinguish ascites from solid components.
Differential Diagnosis
Peritoneal spread from other malignancies (ovarian, breast, colorectal). Correlation with clinical history and localization of the primary tumor may facilitate distinction.
32 Neuroendocrine Tumor V – Peritoneal Spread 69
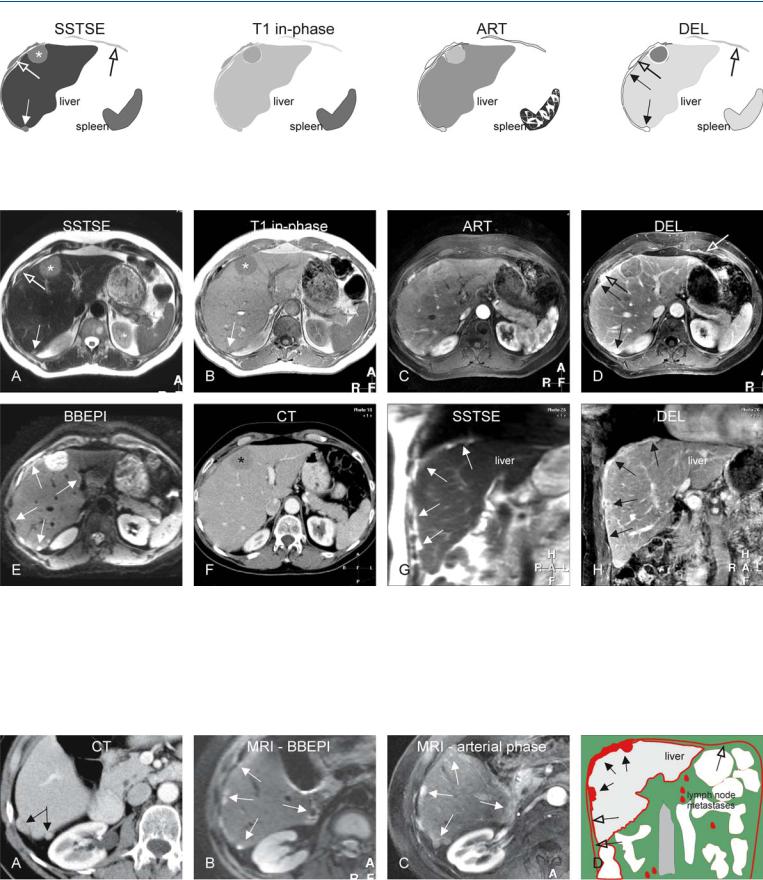
Fig. 32.1. Metastasis, neuroendocrine, peritoneal and capsular involvement, drawings. SSTSE: large (*) and a small capsular in growth (solid arrow) appear as hyperintense liver; peritoneal involvement (open arrows); T1 in-
Fig. 32.2. Metastasis, neuroendocrine, peritoneal and capsular involvement, MRI findings at 3.0T. A Axial SSTSE image (SSTSE): Capsular thickening (solid arrow) and a large ingrowth (*) are hyperintense to the liver; the peritoneal thickening appears darker (open arrow). B Axial in-phase T1-w GRE (T1 inphase): Similar appearance of the larger (*) and the smaller (arrow) capsular lesions suggests their common origin. C Axial arterial phase image (ART): The lesions show intense enhancement. D Axial delayed phase image (DEL): The capsular (solid arrows) and peritoneal (open arrows) lesions
phase: lesions are hypointense to the liver; ART: all lesions show enhancement; DEL: note the difference between the capsular (solid arrows) and the peritoneal enhancement (open arrows)
show increased and persistent enhancement. E Axial BBEPI image (T2 fatsat): Compared to SSTSE, the conspicuity of the capsular lesions (arrows) is improved. F Axial contrast-enhanced CT (CT) shows the largest lesion (*) well; the smaller capsular lesions are difficult to recognize. G Coronal SSTSE image (SSTSE) shows diffuse and irregular capsular thickening (arrows). H Coronal delayed phase image (DEL) shows abnormal capsular enhancement (arrows)
Fig. 32.3. Metastasis, neuroendocrine, peritoneal and capsular involvement, CT and MRI findings at a different anatomic level, drawing. A Axial enhanced (single phase) CT shows two capsular lesions (arrows). B Axial BBEPI image (MRI-BBEPI) shows multiple bright lesions (arrows). C Axial arterial phase
image (MRI – arterial phase) shows intense enhancement of the capsular lesions (arrows). D Drawing illustrates the capsular (solid arrows), peritoneal (open arrow) spread, and lymph node metastases

70 Part IIB – Metastases: Non-Colorectal
33Ovarian Tumor Liver Metastases – Mimicking Giant Hemangioma
Ovarian cancer has the highest mortality rate of all gynecologic malignancies, in which about 70 % of patients have peritoneal involvement at the time of diagnosis. The tumors have a tendency to show direct spread as well as intraperitoneal dissemination. The staging system is surgically based: stage I, disease being limited to one or both ovaries; stage II, extraovarian spread within the pelvis; stage III, diffuse peritoneal disease involving the upper abdomen; stage IV, distant metastases including hepatic lesions. Common sites of intraperitoneal seeding include the omentum, paracolic gutters, liver capsule, and diaphragm. Thickening, nodularity, and enhancement are all signs of peritoneal involvement. Microscopic peritoneal and liver capsular spread remain challenging to detect at imaging. Some investigators have shown that MR imaging is superior in visualization of small or equivocal peritoneal implants compared with CT.
Literature
1.Woodward PJ, Hosseinzadeh K, Saenger JS (2004) From the archives of the AFIP: radiologic staging of ovarian carcinoma with pathologic correlation. Radiographics 24:225 – 246
2.Low RN, Carter WD, Saleh F, et al. (1995) Ovarian cancer: comparison of findings with perfluorocarbon-enhanced MR imaging, In-111-CYT-103 immunoscintigraphy, and CT. Radiology 195:391 – 400
3.Low RN, Semelka RC, Worawattanakul S, et al. (1999) Extrahepatic abdominal imaging in patients with malignancy: comparison of MR imaging and helical CT, with subsequent surgical correlation. Radiology 210:625 – 632
MR Imaging Findings
At MR imaging, the intrahepatic, liver capsular and peritoneal carcinomatosis presents as high signal intensity on T2-weighted images. Liver lesions may grow diffusely and replace the entire hepatic parenchyma; capsular lesions may show ingrowths into the liver. The high signal of the liver lesions may show similarity with giant hemangiomas in the liver. On T1-weighted images the findings are non-specific. After injection of gadolinium, the liver lesions show heterogeneous enhancement in the arterial phase, which remains heterogeneous in the delayed phase due to washout of the contrast as opposed to giant hemangiomas, which typically show persistent enhancement in the delayed phase (Figs. 33.1, 33.2). Thickened peritoneum and omentum show high signal intensity on T2weighted images with persistent delayed enhancement (Fig. 33.3). MR imaging facilitates better distinction between fluid and nonfluid components.
Differential Diagnosis
Clinical correlation is recommended to differentiate from other disseminated malignancies (breast, colorectal).
Management
Early ovarian cancer is treated with comprehensive staging laparotomy, whereas advanced but operable disease is treated with primary cytoreductive surgery (debulking) followed by adjuvant chemotherapy. Patients with unresectable disease may benefit from neoadjuvant (preoperative) chemotherapy before debulking.
33 Ovarian Tumor Liver Metastases – Mimicking Giant Hemangioma 71
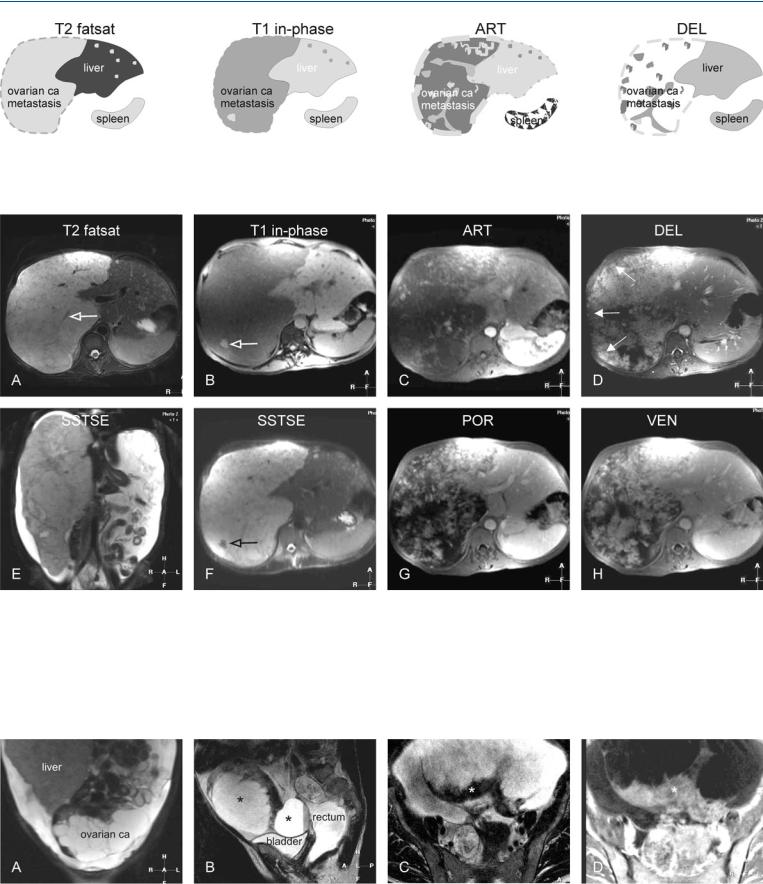
Fig. 33.1. Metastasis, ovarian carcinoma metastases, drawings. T2 fatsat: a large metastasis and several smaller lesions (left liver) are hyperintense to the liver; T1 in-phase: metastases are hypointense to the liver; ART: metastases
Fig. 33.2. Metastasis, ovarian carcinoma metastases, MRI findings. A Axial TSE image (T2 fatsat): A large metastasis and several smaller lesions (left liver) are hyperintense to the liver. Note that the larger lesions contain low signal intensity linear structures, including vessels (open arrow). B Axial in-phase image (T1 in-phase): Metastases are hypointense to the liver. The larger lesion contains an area of high signal intensity (open arrow), most likely mucin. C Axial arterial phase image (ART): Metastases show intense heterogeneous enhancement. D Axial delayed phase image (DEL): Metastasis shows
show intense heterogeneous enhancement; DEL: metastases show persistent heterogeneous enhancement. Note that the liver capsule along the larger lesion is permeated
persistent heterogeneous enhancement. Note that the liver capsule along the larger lesion is permeated and appears irregular (arrows). E Coronal SSTSE image (SSTSE) shows that the right liver is completely replaced by the tumor with abundant ascites, suggesting pseudomyxoma peritonei. F Axial SSTSE image (SSTSE) shows a small dark area with the large metastasis, consistent with mucin (open arrow). G, H Axial portal (POR) and venous (VEN) phase images show the progressive heterogeneous enhancement of the larger lesion
Fig. 33.3. Metastasis, ovarian carcinoma in the pelvis (primary tumor evaluation in the same patient), MRI findings. A Coronal TSE image through the pelvis shows the enlarged liver and the ovarian carcinoma with cystic and solid components. B Sagittal TSE image: Ovarian carcinoma consists of several
cystic and solid components (*). C, D Axial TSE and gadolinium-enhanced delayed phase images show thickened wall of one of the cysts with enhancement (*)