


96 Part IIC – Primary Solid Liver Lesions in Cirrhotic Liver
45HCC in Cirrhosis IV – Mosaic Pattern with Pathologic Correlation
Hepatocellular carcinoma (HCC) is the most common primary cancer of the liver. The overall 5-year survival rate without any treatment is less than 5 %. HCC is more frequent in the East and Southeast Asia. The incidence of HCC, however, is rising in Europe and North America. In a recent study, the incidence of HCC in the United States increased from 1.4 per 100,000 between 1976 and 1980, to 2.4 per 100,000 between 1991 and 1995. Men are affected three times as often as women and blacks twice as often as whites. The age-specific incidence of HCC has progressively shifted toward a younger population, reaching a peak at about 80 – 84 years of age between 1981 and 1985, and dropping to 75 – 79 years of age between 1991 and 1995. Large (> 2 cm) HCC may have a number of characteristic features, such as mosaic pattern, tumor capsule, extracapsular extension with the formation of satellite nodule(s), vascular invasion, and extrahepatic dissemination, including lymph node and distant metastases.
Literature
1.Hussain SM, Semelka RC, Mitchell DG (2002) MR imaging of hepatocellular carcinoma. Magn Reson Imaging Clin N Am 10:31 – 52
2.El-Serag HB, Mason AC (1999) Rising incidence of hepatocellular carcinoma in the United States. N Engl J Med 340:745 – 750
3.Kadoya M, Matsui O, Takashima T, et al. (1992) Hepatocellular carcinoma: correlation of MR imaging and histopathologic findings. Radiology 183:819 – 825
MR Imaging Findings
The mosaic pattern is present in 88 % of the lesions larger than 2 cm. On T1and T2-weighted MR images, the mosaic pattern appears as areas of variable signal intensities, whereas on gadoliniumenhanced images, the lesions enhance in a heterogeneous fashion during the arterial and later phases (Figs. 45.1, 45.2). Tumor capsule, a characteristic sign of HCC, is present in 60 – 82 % of large HCCs. The tumor capsule is hypointense on both T1and T2weighted images. Vascular invasion occurs in 24 % of large HCCs. Extrahepatic dissemination of large HCCs occurs in up to 48 % with lung metastases, lymph node metastases, bone metastases, etc.
Pathology
At gross pathology, large HCC appears as a dominant nodule among a myriad of regenerative nodules of the cirrhotic liver. The nodule may be composed of several smaller nodules (mosaic) contained within a grossly visible true fibrous capsule. At histology, the tumor may show increased cellularity, abnormal hepatocytes, thickened cell plates, and hemorrhage (Fig. 45.3).
45 HCC in Cirrhosis IV – Mosaic Pattern with Pathologic Correlation 97
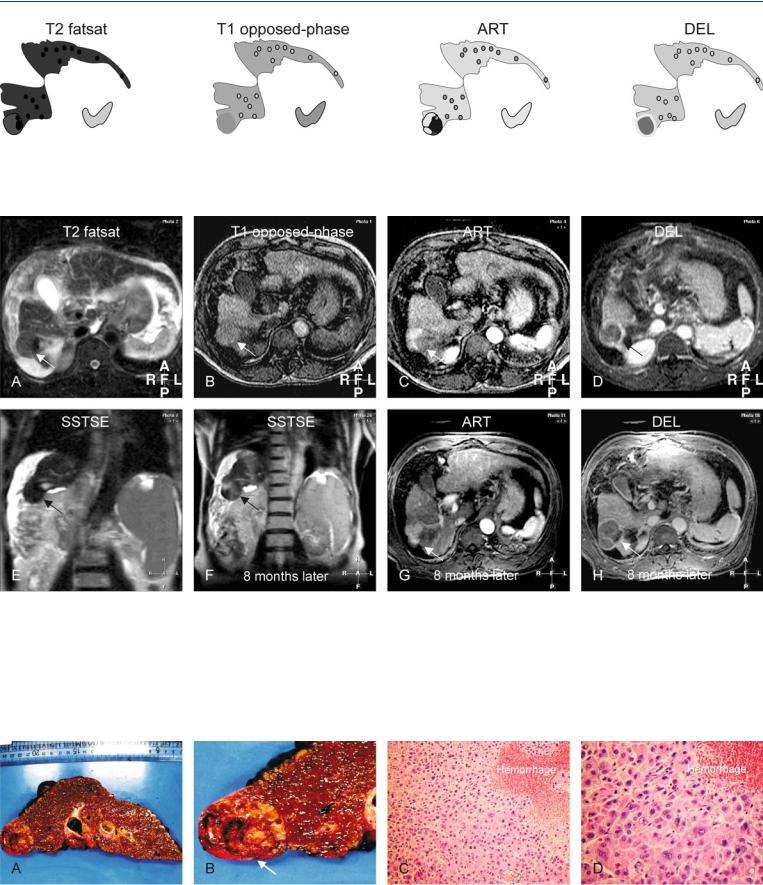
Fig. 45.1. HCC, cirrhotic liver, mosaic pattern. T2 fatsat: HCC appears as a nodule with areas of variable signal intensity (mosaic pattern) within a cirrhotic liver. T1 opposed-phase: HCC is almost isointense to the liver. ART: HCC
Fig. 45.2. HCC, cirrhotic liver, mosaic pattern, MRI findings. A Axial fat-sup- pressed T2-w TSE image (T2 fatsat): HCC nodule has areas with higher and lower (mosaic) than the cirrhotic liver (arrow). B Axial T1-w opposed-phase GRE image (T1 opposed-phase): HCC is isointense to the cirrhotic liver (arrow). C Axial arterial phase post-Gd T1-w GRE image (ART): HCC shows more enhancement in some parts and less in other parts, indicating the mosaic pattern (arrow). D Axial delayed post-Gd T1-w GRE image (DEL): HCC shows washout in the enhanced areas with enhancement of the tumor cap-
shows enhancement in some and negligible enhancement in other areas; DEL: HCC shows washout in the enhancing parts of the tumor with the enhancement of the tumor capsule
sule (arrow). E Coronal T2-w SSTSE image with a TE of 120 ms (SSTSE): HCC is isointense to the cirrhotic liver (arrow). F Coronal T2-w SSTSE image (SSTSE) 8 months later: HCC has increased in size (arrow). G Axial arterial phase post-Gd T1-w GRE image 8 months later (ART): HCC is larger in size with a mosaic enhancement pattern (arrow). H Axial delayed phase post-Gd T1-w GRE image 8 months later (DEL): HCC shows the enhanced tumor capsule and septa within a larger lesion (arrow)
Fig. 45.3. HCC with mosaic pattern, cirrhosis, direct MR-explant correlation. A
Photograph of the entire explant provides an overview of the cirrhotic liver and a large HCC. B A detailed photograph of the area with HCC (arrow) that correlates well with the T2 coronal image. C Photomicrograph of the HCC
shows thickened cell plates with abnormal hepatocytes and an area with hemorrhage. H&E, × 200. D Photomicrograph shows in detail the hepatocytes composed of abnormal nuclei and cytoplasm compatible with HCC. H&E, × 400
98 Part IIC – Primary Solid Liver Lesions in Cirrhotic Liver
46 HCC in Cirrhosis V – Typical Large with Mosaic and Capsule
Edmondson et al. divided HCCs into nodular (81 %), massive (23 %), and diffuse (3 %). In 1987, Kanai et al. proposed a new gross classification: (1) Type 1: single nodular type; (2) Type 2: single nodular type with extranodular growth; (3) Type 3: contiguous multinodular type; (4) Type 4: poorly demarcated nodular type; and (5) early HCC (< 12 mm): a lesion that does not destroy the underlying liver structure. Type 1 and 2 lesions are said to be more likely to show an expanding growth. Type 3 and 4, as well as small HCC, may predominantly display a replacing growth. Type 1 lesions show a remarkable response to minimally invasive treatment, such as transcatheter arterial embolization. The lesions with mosaic pattern may be considered as Type 3 lesions. Such lesions are a configuration of confluent small nodules separated by thin septa.
Literature
1.Edmondson HA, Steiner PE (1954) Primary carcinoma of the liver: a study of 100 cases among 18,900 necropsies. Cancer 7:462 – 503
2.Kanai T, Hirohashi S, Upton MP, et al. (1987) Pathology of small hepatocellular carcinoma: a proposal for a new gross classification. Cancer 60:810 – 819
3.Ebara M, Fukuda H, Kojima Y, et al. (1999) Small hepatocellular carcinoma: relationship of signal intensity to histopathologic findings and metal content of the tumor and surrounding hepatic parenchyma. Radiology 210:81 – 88
4.Muramatsu Y, Nawano S, Takayasu K, et al. (1991) Early hepatocellular carcinoma: MR imaging. Radiology 181:209 – 213
MR Imaging Findings
At T1-weighted images, large HCCs with a mosaic pattern may predominantly have a high signal intensity compared to the surrounding liver. These lesions may be surrounded by a low signal intensity fibrous capsule. The individual nodules within such HCCs may have a slightly variable signal, hence giving rise to the characteristic mosaic appearance. The high signal intensity on T1 may be caused by high copper protein content. On contrast-enhanced imaging, some nodules may enhance more than others, again expressing the mosaic pattern based on vascularity. On delayed contrast-en- hanced images, the individual nodules as well as the lesion may be contained within capsules (Figs. 46.1, 46.2). The possibility of fatty infiltration of the lesion can be excluded on chemical shift imaging.
Pathology
High signal intensity on T1-weighted images may be associated with well-differentiated HCC (Fig. 46.3A, B). MR imaging is well able to show HCC without tumor capsule with the suggestion of infiltrating growth pattern (Fig. 46.3C, D).
46 HCC in Cirrhosis V – Typical Large with Mosaic and Capsule 99
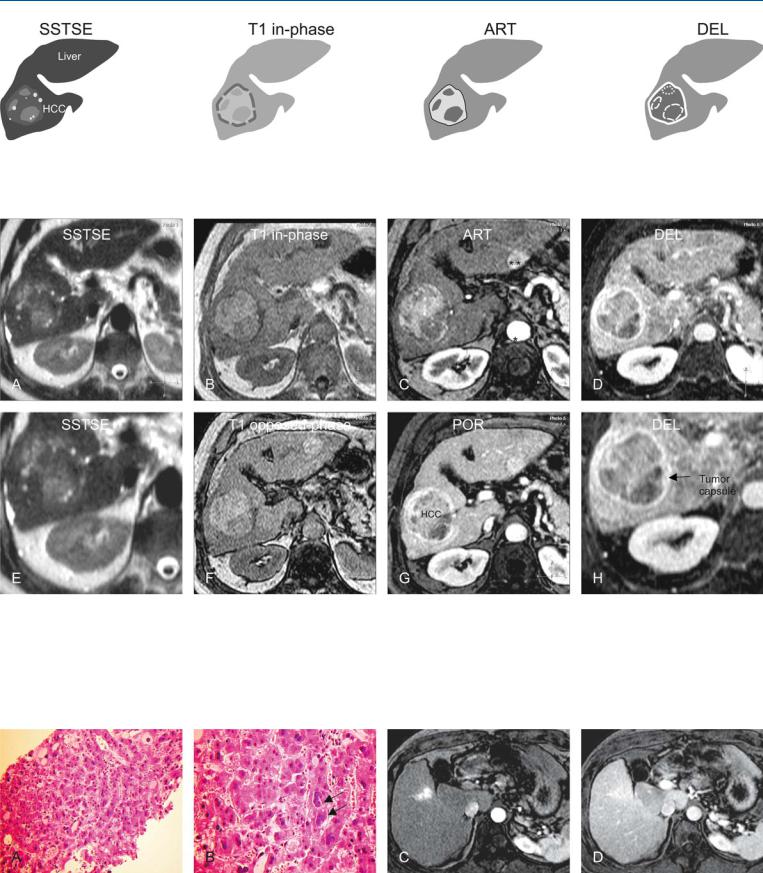
Fig. 46.1. HCC, cirrhosis, large, mosaic, drawings. SSTSE: HCC contains several nodules with variable signal intensity indicating a mosaic pattern; T1 inphase: HCC is predominantly hyperintense to the liver with a darker tumor
Fig. 46.2. HCC, cirrhotic liver, large, mosaic pattern, typical MRI findings. A Axial SSTSE image (SSTSE): HCC is predominantly hyperintense to the liver. The tumor capsule is hypointense and not visible. B Axial in-phase image (T1 inphase): HCC is predominantly hyperintense to the cirrhotic liver with a darker tumor capsule. C Axial arterial phase image (ART): HCC shows intense enhancement in some areas, indicating the mosaic pattern. D Axial delayed phase image (DEL): HCC shows washout with enhanced thick tumor
capsule; ART: HCC shows more and intense enhancement in some areas of the tumor; DEL: HCC shows washout in the enhanced areas with an enhanced thick tumor capsule
capsule. E A detailed view of the SSTSE image (SSTSE): HCC shows areas with high and low signal indicating the mosaic pattern. F Axial opposedphase T1-w GRE image (T1 opposed-phase): HCC as well as the cirrhotic liver show no signs of fatty infiltration. G Axial portal phase image (POR): HCC shows washout with enhanced thick tumor capsule. H A detailed view of the axial delayed phase 2D T1-w GRE image (DEL): HCC is surrounded by an enhanced thick tumor capsule (arrow)
Fig. 46.3. HCC, direct MR-biopsy correlation in A and B. A Photomicrograph of a US-guided biopsy from the tumor (shown above) shows thickened cell plates with abnormal nuclei, compatible with HCC. H&E, × 200. B Photomicrograph shows enlarged atypical nuclei (arrows) with abnormal cytoplasm
of the hepatocytes. H&E, × 400. C, D Arterial and delayed phase images, respectively, from another patient show an HCC with diffuse, infiltrating growth without a tumor capsule