


220 Part V – Biliary Tree Abnormalities
103Primary Sclerosing Cholangitis I – Cholangitis and Segmental Atrophy
Primary sclerosing cholangitis (PSC) is a chronic cholestatic liver disease commonly associated with inflammatory bowel disease (IBD), which is present in two-thirds of patients. It is characterized by fibrosing inflammatory destruction of intrahepatic and extrahepatic bile ducts, ultimately leading to death by liver failure and cholangiocarcinoma (10 – 30 %). PSC is considered to be an immunemediated liver disease of multifactorial and multigenetic etiology. The annual incidence is reported to be 0.91 per 100,000. Symptoms and signs of liver or biliary disease may be present. Patients have biochemical cholestasis from the time of diagnosis. Association with autoimmune hepatitis and pancreatitis has been described.
Literature
1.MacFaul GR, Chapman RW (2005) Sclerosing cholangitis. Curr Opin Gastroenterol 21:348 – 53
2.Vitellas KM, Enns RA, Keogan MT, et al. (2002) Comparison of MR cholangiopancreatographic techniques with contrast-enhanced cholangiography in the evaluation of sclerosing cholangitis. AJR 178:327 – 334
3.Revelon G, Rashid A, Kawamoto S, et al. (1999) Primary sclerosing cholangitis: MR imaging findings with pathologic correlation. AJR 173:1037 – 1042
4.Ito K, Mitchell DG, Outwater EK, et al. (1999) Primary sclerosing cholangitis: MR imaging features. AJR 172:1527 – 1533
5.Bader TR, Beavers KL, Semelka RC (2003) MR imaging features of primary sclerosing cholangitis: patterns of cirrhosis in relationship to clinical severity of the disease. Radiology 226:675 – 685
MR Imaging Findings
At MR imaging, in patients with PSC abnormal findings can be seen including (1) intrahepatic bile duct dilatation; (2) intrahepatic bile duct stenosis; (3) intrahepatic bile duct beading; (4) periportal high signal intensity on T2-weighted images with increased enhancement of the liver parenchyma on dynamic arterial-phase images, predominantly in the peripheral areas of the liver; (5) extrahepatic bile duct wall thickening and enhancement; (6) extrahepatic bile duct stenosis; (7) hypertrophy of certain segments, for instance caudate lobe and atrophy of other segments; (8) periportal lymphadenopathy; and (9) enlarged gallbladder. MR cholangiography and contrast-enhanced dynamic MR techniques are useful for revealing intraand extrahepatic signs of primary sclerosing cholangitis. Atrophy of certain segments of the liver results from recurrent cholangitis and fibrosis (Figs. 103.1 – 103.3).
Management
Medical treatment consists of ursodeoxycholic acid and immunosuppressant agents. Repeat endoscopic dilatations for dominant strictures can be carried out. In most cases, the only treatment option for PSC accompanied by inflammatory intestinal disease is liver transplantation.
103 Primary Sclerosing Cholangitis I – Cholangitis and Segmental Atrophy 221
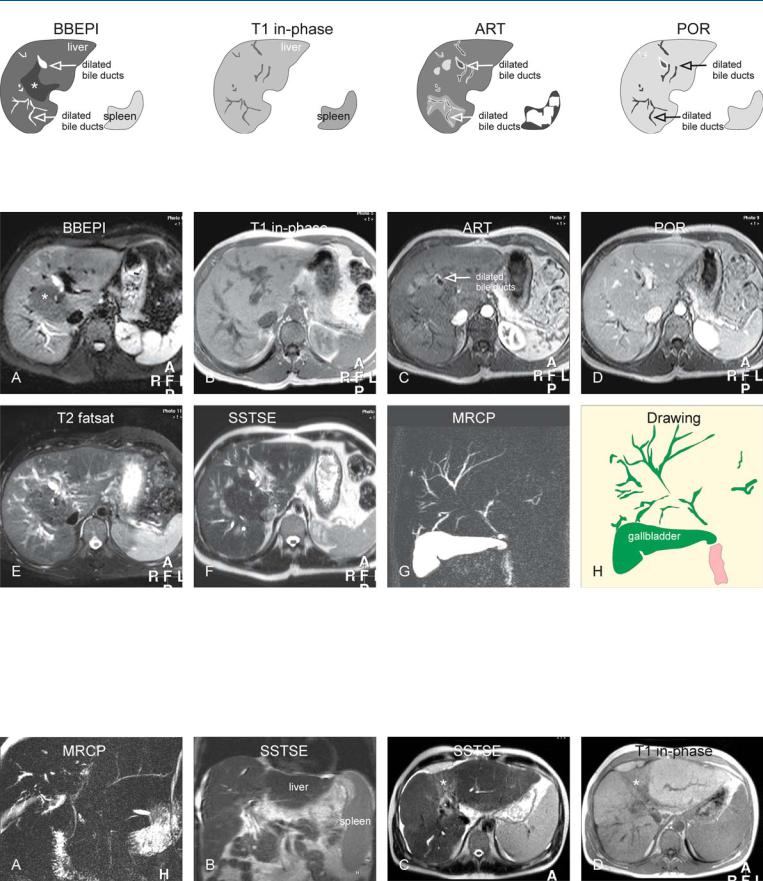
Fig. 103.1. Primary sclerosing cholangitis (PSC), drawings. BBEPI: bile ducts are dilated in the periphery of the liver with concomitant increased parenchymal signal intensity due to inflammation; normal parenchyma (*); T1 in-
Fig. 103.2. Primary sclerosing cholangitis (PSC) with cholangitis, MRI findings. A Axial BBEPI image (BBEPI): Dilated bile ducts are located in the periphery of the liver with concomitant increased signal intensity due to inflammation. Central liver has a normal signal (*). B Axial in-phase image (T1 inphase): The liver parenchyma appears quite normal. C Axial arterial phase image (ART): increased enhancement of the wall of the dilated ducts and in the parenchyma around some of the dilated ducts indicates moderate to severe cholangitis. D Axial portal phase image (POR): The enhanced areas
phase: the liver parenchyma appears normal; ART: increased enhancement around some of the dilated ducts indicates cholangitis; POR: the enhanced areas become isointense to the liver
become isointense to the liver. E Axial TSE image (T2 fatsat): The dilated bile ducts are difficult to distinguish from the intrahepatic in-plane vessels because of similar high signal intensity. F Axial SSTSE image (SSTSE): The dilated bile ducts can be followed onto the subcapsular region. G and H MRCP (MRCP) with the drawing shows typical appearance of the biliary tree with PSC. The large size of the gallbladder suggests impaired emptying, most likely due to narrowing of the common bile duct
Fig. 103.3. PSC (another patient) complicated with a fibrosis or cirrhosis, splenomegaly, ascites, and segmental atrophy due to recurrent cholangitis, MR findings. A MRCP shows typical PSC appearance of the biliary tree. B Coronal SSTSE shows the liver with fibrosis or cirrhosis, ascites, and splenomegaly.
C Axial SSTSE image shows high signal in segment IV with atrophy (*). D Axial in-phase image shows abnormally low signal in segment IV with atrophy (*)

222 Part V – Biliary Tree Abnormalities
104Primary Sclerosing Cholangitis II – With Intrahepatic Cholestasis
Primary sclerosing cholangitis (PSC) is characterized by chronic inflammation and fibrosis of bile ducts. Progressive and obliterative fibrosis of small, medium, and large bile ducts causes secondary biliary cirrhosis and cholestasis, which results in hepatic insufficiency. Primary pigmented stones occur in 30 % of patients with PSC secondary to bile stasis. Endoscopic retrograde cholangiopancreatography (ERCP) has been replaced by MR imaging and magnetic resonance cholangiopancreatography (MRCP) as the standard reference for the evaluation of bile ducts. Currently, MR imaging is the modality of choice for the evaluation of asymptomatic patients and in the early diagnosis of complications, especially cholangiocellular carcinoma, which is highly likely to develop in patients who have PSC. Both morphological changes, which can be seen in the biliary system, and parenchymal changes, which are accompanied by PSC, can be evaluated by MR imaging non-invasive- ly.
Literature
1.Fulcher AS, Turner MA, Franklin KJ, et al. (2000) Primary sclerosing cholangitis: evaluation with MR cholangiography. A case control study. Radiology 215:71 – 80
2.Vitellas KM, Enns RA, Keogan MT, et al. (2002) Comparison of MR cholangiopancreatographic techniques with contrast-enhanced cholangiography in the evaluation of sclerosing cholangitis. AJR 178:327 – 334
3.Revelon G, Rashid A, Kawamoto S, et al. (1999) Primary sclerosing cholangitis: MR imaging findings with pathologic correlation. AJR 173: 1037 – 1042
MR Imaging Findings
At MR imaging, MRCP has a high sensitivity (83 – 89 %) and specificity (92 – 99 %) for PSC. MRCP typically shows variable caliber of the intraand extrahepatic bile ducts with signs of cholestasis (high signal within dilated bile ducts on T1-weighted images. Reactive periportal lymph nodes can be seen as a bright nodular structure on the T2-weighted images. At histology, sclerosis with narrowing, dilatations, and cholestasis confirm the MR imaging findings (Figs. 104.1 – 104.3).
Differential Diagnosis
Secondary causes such as stricture, stones, or bacterial cholangitis secondary to earlier surgery, parasitic infections, ischemia, or cholangitis secondary to chemotherapy should be eliminated before diagnosing PSC.
104 Primary Sclerosing Cholangitis II – With Intrahepatic Cholestasis 223
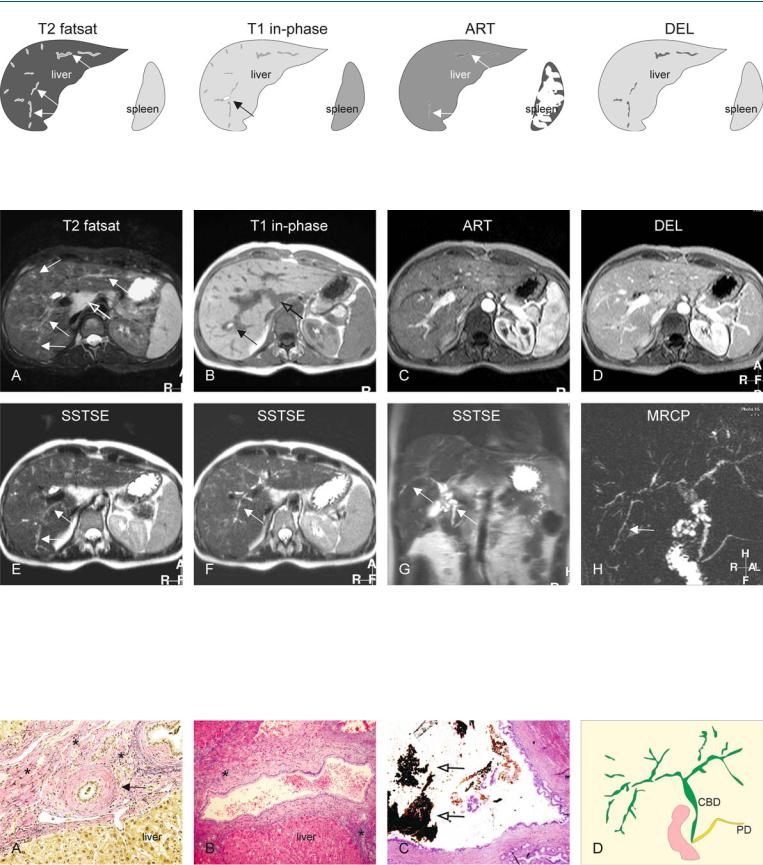
Fig. 104.1. Primary sclerosing cholangitis (PSC), drawings. T2 fatsat: typical bile ducts (arrows) with long segments of stenoses and dilatations, extending into the periphery of the liver; T1 in-phase: high signal is due to local cholesta-
Fig. 104.2. Primary sclerosing cholangitis (PSC) in a patient with ulcerative colitis, typical MRI findings. A Axial TSE image (T2 fatsat): Bile ducts with long segments of stenoses and dilatations, extending into the periphery of the liver, are typical for PSC (solid arrows). Note also enlarged reactive periportal lymph nodes (open arrow). B Axial in-phase image (T1 in-phase): High signal indicates local cholestasis in one of the dilated ducts (arrow). C Axial arterial phase image (ART): Faintly increased enhancement around some of
sis (arrow); ART: subtle increased enhancement around some of the dilated ducts indicates mild cholangitis (arrows); DEL: the enhanced areas become isointense to the liver
the dilated ducts indicates mild cholangitis. D Axial delayed phase image (DEL): The enhanced areas become isointense to the liver. E–G Intraas well as extrahepatic abnormal bile ducts (arrows) indicate a systemic disease. H MRCP (MRCP) provides an overview of the biliary tree with typical appearance of PSC. Note the elongated bile ducts with variable diameter, extending into the sub-capsular region of the liver (arrow)
Fig. 104.3. PSC, pathology (another patient), drawing. A Photomicrograph (H&E stain, 200 ×) shows a bile duct with thickened wall (sclerosis) and narrow lumen (arrow). Note also cholestasis (greenish). B Photomicrograph (H&E, 100 ×) shows a dilated bile duct surrounded by fibrosis and debris.
C Photomicrograph (H&E, 40 ×) shows a dilated duct with cholestasis (open arrows). D Drawing shows typical appearance of PSC (CBD = common bile duct; PD = pancreatic duct)