


2Part I – High-Fluid Content Liver Lesions
1 Abscesses – Pyogenic Type
Hepatic abscesses result from an infectious process of bacterial origin associated with destruction of the hepatic parenchyma and stroma in 0.006 – 2.2 % of hospital admissions. Gram-negative bacteria of colonic origin (E. coli, Klebsiella, and Enterobacter) can often be isolated from such abscesses. Pyogenic liver abscesses may result from obstruction of the biliary tract with stasis of bile and bacterial overgrowth, or as a complication of direct biliary tract infection. Hematogenous spread and bacterial seeding of the liver may occur via the portal vein secondary to abdominal infection. Other less common routes are hematogenous and direct perihepatic spread.
MR Imaging Findings
Hepatic abscess presents as a relatively complicated fluid collection, which is composed of central areas with low signal intensity on T1-weighted images and high signal intensity on T2-weighted images. Particularly, on T2-weighted images the central cavity may show septa and debris. A central fluid-containing cavity is often surrounded by a few millimeters (in most cases: 1 – 5 mm; in some cases: > 5 mm) of thick inflamed liver parenchyma (wall of the abscess), which most likely contains microabscesses. Perilesional (wedge-shaped) edema may be present. Most abscesses show early persistent enhancement of the wall (Figs. 1.1 – 1.3A, B). Although in most patients the diagnosis and follow-up is carried out on computed tomography (CT), magnetic resonance (MR) imaging is increasingly being performed on acutely ill patients; therefore, it is important for radiologists to understand the appearance of hepatic abscesses at MR imaging.
Differential Diagnosis
In ambiguous cases, the differential diagnosis may include: (1) metastases (the ring enhancement progresses in a centripetal fashion with a decrease in intensity on delayed images); (2) infected metastases (difficult to differentiate; thicker and more irregular wall; clinical history important); (3) hepatosplenic candidiasis (multiple lesions < 10 mm in diameter); (4) hydatid cysts (internal septa);
(5) echinococcus abscesses (thicker septa and daughter cysts) (Fig. 1.3C, D).
Management
Management options include: (1) percutaneous drainage; (2) open surgical drainage; and (3) antibiotic therapy. Single dominant hepatic abscess with a large fluid cavity can be treated with percutaneous drainage. Treatment should be tailored to each patient.
Literature
1.Mendez RJ, Schiebler ML, Outwater EK, Kressel HY (1994) Hepatic abscesses: MR imaging findings. Radiology 190:431 – 436
2.Balci CN, Semelka RC, Noone TC, et al. (1999) Pyogenic hepatic abscesses: MRI findings on T1and T2-weighted and serial gadolinium-en- hanced gradient-echo images. J Magn Reson Imaging 9:285 – 290
3.Perez JAA, Gonzalez JJ, Baldonedo RF, et al. (2001) Clinical course, treatment, and multivariate analysis of risk factors for pyogenic liver abscess. Am J Surg 181:177 – 186

1 Abscesses – Pyogenic Type 3
Fig. 1.1. Abscess, pyogenic type, drawings. T2 fatsat: in the right liver, a small fluid collection (high signal) is surrounded by a wedge-shaped area of edema; T1 fatsat: the fluid is slightly hypointense to the liver with faintly visible
Fig. 1.2. Abscess, pyogenic type, MR imaging findings at 3.0T. A Axial fat-sup- pressed T2-weighted turbo spin echo (TSE) image (T2 fatsat): In the right liver, a small fluid collection is surrounded by a wedge-shaped area of edema (arrows). B Axial fat-suppressed T1-weighted gradient recalled echo (GRE) (T1 fatsat): The fluid collection is hypointense to the liver with faintly visible edema. C Axial portal phase gadolinium (Gd)-enhanced three-di- mensional (3D) T1-w GRE image (POR): The fluid collection has a thick wall. D Axial delayed phase GRE image (DEL): The wall of the abscess shows
edema; POR: an evenly thick layer of liver tissue surrounding the fluid collection shows enhancement; DEL: the thick wall of the abscess remains enhanced in the delayed phase
persistent enhancement (no washout). E Axial T2-weighted single-shot TSE image (SSTSE): The central part of the abscess contains fluid due to necrosis. F Axial fat-suppressed GRE image through the kidneys (T1 fatsat): Perinephric hemorrhage (an incidental finding) shows high signal (arrow). G Coronal SSTSE image (SSTSE): The abscess is subcapsular to the liver (arrow). H Coronal delayed phase image (DEL): The wall of the abscess has a ragged appearance (arrow)
Fig. 1.3. Abscess anatomy. A A detailed view of the coronal high resolution delayed phase image (from the patient above) shows small cavities within the wall of the abscess. B Drawing of the abscess: the central cavity is filled with fluid that is surrounded by a wall of inflammation with (most likely) micro-
abscesses and edema. C Ultrasound (US) (another patient) shows a typical echinococcal cyst with daughter cysts (arrow). D CT in portal phase confirms the US findings

4Part I – High-Fluid Content Liver Lesions
2 Biliary Hamartomas (von Meyenberg Complexes)
Biliary hamartomas are benign biliary malformations, which are currently considered as part of the spectrum of fibropolycystic diseases of the liver due to ductal plate malformation. This entity is common and estimated to be present in approximately 3 % of patients. These lesions are often discovered as incidental findings during cross-sectional imaging or during palpation of the surface of the liver during laparotomy, usually in the setting of colorectal malignancy. Biliary hamartomas may be solitary or multiple, and multiple tumors can be extensive.
Literature
1.Semelka RC, Hussain SM, Marcos HB, Woosley JT (1999) Biliary hamartomas: solitary and multiple lesions shown on current MR techniques including gadolinium enhancement. JMRI 10:196 – 201
2.Semelka RC, Hussain SM, Marcos HB, Woosley JT (2000) Perilesional enhancement of hepatic metastases: correlation between MR imaging and histopathologic findings – initial observations. Radiology 215:89 – 94
3.McLoughlin MJ, Phillips MJ (1975) Angiographic findings in multiple bile-duct hamartomas of the liver. Radiology 116:41 – 43
MR Imaging
On MR images, tumors are small (usually < 1 cm), often multiple, and well defined. The high fluid content renders these lesions low signal on T1, high signal on T2, and negligible enhancement on early and late post-gadolinium images. Although this appearance resembles simple cysts, biliary hamartomas demonstrate a thin rim of enhancement on early and late post-contrast images (Figs. 2.1, 2.2).
Differential Diagnosis
The major potential diagnostic error is to misclassify these lesions as metastases due to the presence of ring enhancement. The thin enhancing rim of biliary hamartomas, visualized on imaging, may be correlated histopathologically with the presence of compressed hepatic parenchyma bordering the lesion. In contrast, the pattern of ring enhancement displayed by metastases relates histopathologically to the outermost vascularized portion of the tumor. Peritumoral enhancement is also observed in some metastases. MR imaging further corroborates the different histologic profiles of the two processes through the observation that enhancement in biliary hamartoma does not progress centrally, while enhancement in metastases most often progresses centrally.
Pathology
Histopathologically biliary hamartomas consist of a collection of small, sometimes dilated, irregular and branching bile ducts embedded in a fibrous stroma. A few of the ducts may contain inspissated bile. In general, biliary hamartomas contain no or few vascular channels (Fig. 2.3).
Management
No treatment or follow-up with imaging is required for typical biliary hamartomas.
2 Biliary Hamartomas (von Meyenberg Complexes) 5
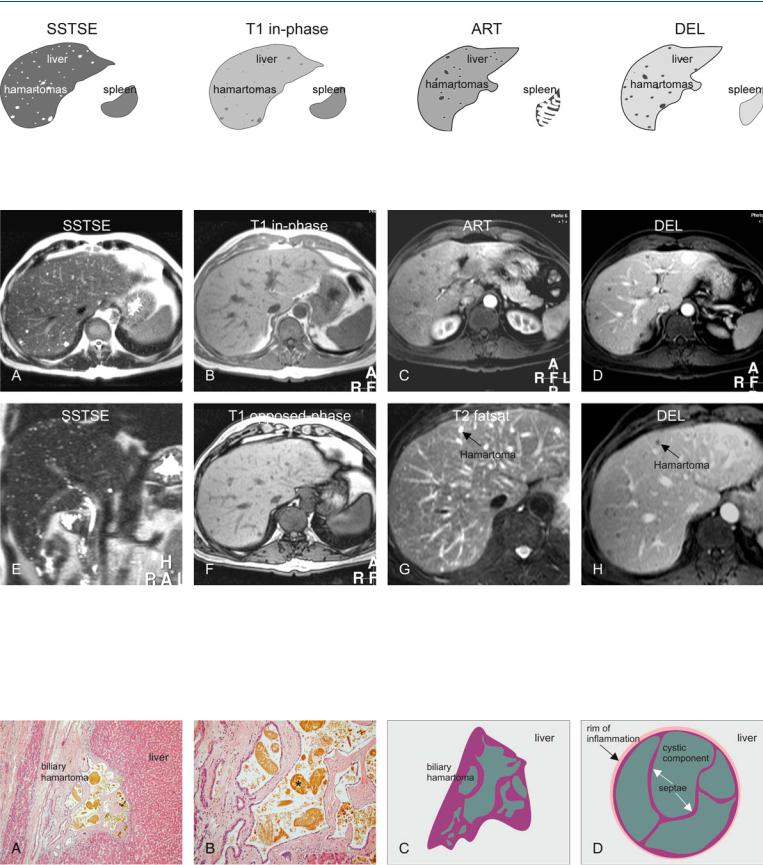
Fig. 2.1. Biliary hamartomas, drawings. SSTSE: hamartomas appear as multiple bright (cyst-like) lesions within a darker liver; T1 in-phase: hamartomas are predominantly hypointense compared to the liver; ART: hamartomas of-
Fig. 2.2. Biliary hamartomas, multiple, typical MRI findings. A Axial SSTSE image (SSTSE): Biliary hamartomas are hyperintense (cyst-like) to the liver. B Axial in-phase image (T1 in-phase): Biliary hamartomas are hypointense and less obvious than on the T2-w images. C Axial arterial phase image (ART): Biliary hamartomas show a faint rim of enhancement. D Axial delayed phase image (DEL): Biliary hamartomas remain unenhanced like cysts in the liver but may have a faint persistent rim of enhancement. E Coro-
ten show a faint rim of enhancement; DEL: hamartomas remain unenhanced like cysts in the liver but may have some residual rim of enhancement
nal SSTSE image (SSTSE): Biliary hamartomas are very bright and scattered throughout the liver, including the subcapsular region. F Axial opposedphase image (T1 opposed-phase): No fatty infiltration is present. G Detailed view of axial fat-suppressed T2-w TSE image (T2 fatsat): Biliary hamartomas may be difficult to distinguish from surrounding vessels. H Detailed view of axial delayed phase image (DEL): Biliary hamartomas are predominantly non-enhancing lesions with a faint persistent rim of enhancement
Fig. 2.3. Biliary hamartoma, histopathology and drawings. A Photomicrograph shows a biliary hamartoma that consists of a group of several small cysts filled with bile. Note the normal liver that surrounds the hamartoma. H&E, × 100. B Photomicrograph shows in detail the cystic components of the ha-
martoma filled with bile (*), which explains the high signal on T2-weighted images. H&E, × 200. C Drawing shows the collapsed biliary hamartoma in vitro. D Drawing shows the distended biliary hamartoma in vivo