

138 Part IID – Primary Solid Liver Lesions in Non-Cirrhotic Liver
65 Hepatocellular Adenoma IV – With Large Hemorrhage
Patients with hepatocellular adenomas (HCAs) can present with a number of symptoms, including pain (32 – 70 %), hemorrhage (15 – 42 %), an incidental finding at imaging (15 – 21 %), or mass on physical or surgical examination (0 – 26 %). Some women with HCA may present intrahepatic or intraperitoneal (life-threatening) hemorrhage around the menstrual period, which suggests a common hormonal influence on the vasculature of the endometrium and shredding of the endometrial tissue as well as vessels within the HCA and hemorrhage. With increasing use of the cross-sectional imaging modalities, including US, CT, and MR imaging, in the assessment of upper abdomen complaints, it is likely that HCA will be discovered as an incidental finding in more patients in the near future.
Literature
1.Rooks JB, Ory HW, Ishak KG, et al. (1979) Epidemiology of hepatocellular adenoma: the role of oral contraceptive use. JAMA 242:644 – 648
2.Terkivatan T, de Wilt JH, de Man RA, et al. (2001) Indications and longterm outcome of treatment for benign hepatic tumors: a critical appraisal. Arch Surg 136:1033 – 1038
3.Mathieu D, Bruneton JN, Drouillard J, et al. (1986) Hepatic adenomas and focal nodular hyperplasia: dynamic CT study. Radiology 160:53 – 58
4.Hussain SM, Van den Bos IC, Dwarkasing S, et al. (2006) Hepatocellular adenoma: findings at state-of-the-art magnetic resonance imaging, ultrasound, computed tomography and pathologic analysis. Eur Radiol 16:1873 – 1886
MR Imaging Findings
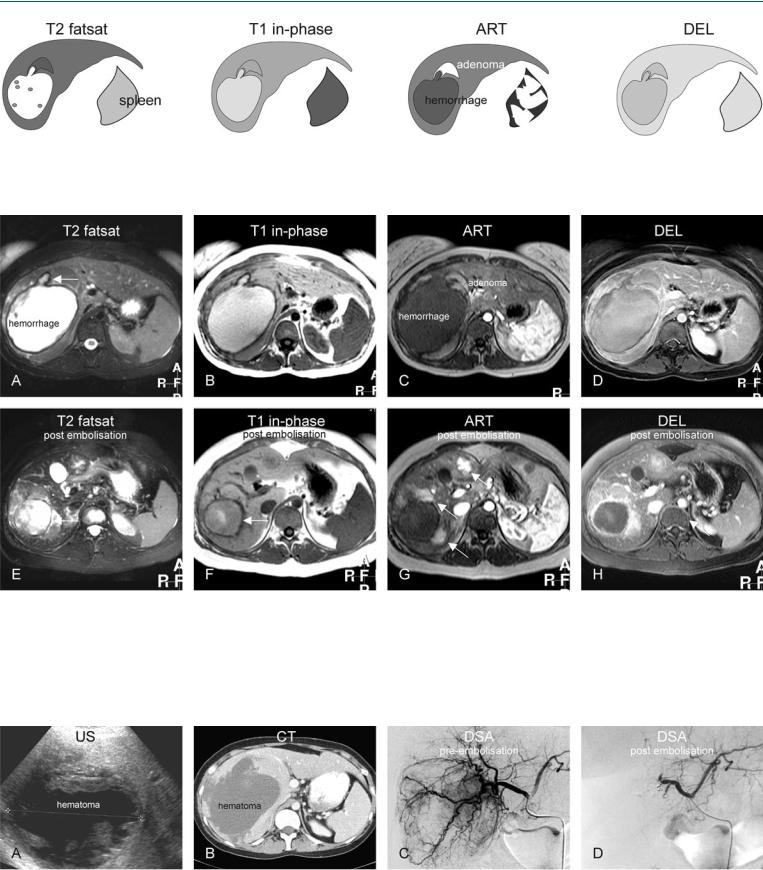
At MR imaging, hemorrhage has a characteristic appearance on T1weighted images with predominantly high signal intensity due to the presence of methemoglobin. A thin rim of low signal intensity indicates the presence of hemosiderin. On T2-weighted images, recent hemorrhage has a high signal with low signal intensity areas centrally with lower signal intensity in the periphery mainly caused by the hemosiderin. The underlying HCA may be small and may remain latent until the resolution of most of the hematoma (Figs. 65.1, 65.2). At ultrasound, the appearance is non-specific; however, at CT the hematomas present with fluid collections with relatively high density (Fig. 65.3A, B).
Management
In the case of acute hemorrhage with an underlying HCA, usually patients are carefully observed and followed with imaging. Hepatic arterial embolization can be an alternative treatment. Digital subtraction angiography prior to embolization may reveal the underlying HCA with an arterial blush and tortuous abnormal tumor vessels (Fig. 65.3C, D). Embolization may be used to control the ongoing hemorrhage but the underlying HCA can recur after a successful treatment.
65 Hepatocellular Adenoma IV – With Large Hemorrhage 139
Fig. 65.1. Adenoma, drawings. T2 fatsat: adenoma is isointense with a thin bright pseudocapsule; T1 in-phase: adenoma is slightly hyperintense to the liver; ART: adenoma shows a moderately intense homogeneous enhance-
Fig. 65.2. Twenty-four-year-old female – ruptured adenoma, MRI findings before and after embolization. A Axial fat-suppressed T2-w TSE image (T2 fatsat): A large hematoma is predominantly bright with a dark rim of hemosiderin and a stalk-like structure indicating the origin of the hematoma (arrow). B Axial in-phase T1-w GRE (T1 in-phase): Hematoma is bright to the liver. C Axial arterial phase post-Gd T1-w GRE image (ART): Adenoma shows homogeneous enhancement around the stalk-like structure. D Axial delayed
ment of the entire lesion; DEL: adenoma becomes isointense to the liver with enhancement of the pseudocapsule (compressed liver tissue and vessels)
phase image (DEL): Adenoma becomes almost isointense to the liver. E Axial fat-suppressed T2-w image after embolization (T2 fatsat): Hematoma has decreased in size (arrow). F Axial in-phase image (T1 in-phase): Hematoma has lost most of its high signal (arrow). G Axial arterial phase image (ART): Multiple (residual or recurrent) adenomas become apparent with homogeneous enhancement (arrows). H Axial delayed phase image (DEL): Adenomas become almost isointense to the liver
Fig. 65.3. Ruptured adenoma: US, CT, and DSA. A Ultrasound (US) shows a large hematoma. B Computed tomography (CT) shows the relatively dense hematoma. C Selective digital subtraction angiography (DSA) prior to embolization (4 months after the initial MRI) shows multiple areas with extensive ar-
terial enhancement (blush) of adenoma with multiple abnormal tortuous tumor arteries surrounding the lesion. D DSA after completion of the embolization procedure shows no evidence of adenomas

140 Part IID – Primary Solid Liver Lesions in Non-Cirrhotic Liver
66Hepatocellular Adenoma V – Multiple in Fatty Liver (Non-OC-Dependent)
Multiple HCA’s often occur in a fatty liver with altered shape and size. Multiple HCA’s may also be found in non-fatty livers. Small lesions may mimic metastases with fatty liver. Multiple lesions may occur with type 1 glycogen storage disease and liver adenomatosis (usually > 10 HCA). At gross pathologic sectioning, HCA’s are well demarcated yellow or tan lesions that are seldom encapsulated. The consistency is soft or friable, and areas of necrosis and hemorrhage are frequently present. All tumors are highly vascular.
MR Imaging Findings
At MR imaging, very small liver lesions within fatty or non-fatty liver can be characterized with much higher accuracy because of the high intrinsic soft tissue contrast based on the T2 characteristics and chemical shift imaging, and the ability to visualize enhancement patterns on the routine gadolinium-enhanced dynamic imaging. On follow-up after stopping oral contraceptives (OC), the lesions may remain unchanged. Large exophytic lesion may be characterized as hepatic lesions by identifying the feeding vessels (Figs. 66.1, 66.2). At US, HCA’s within a fatty liver will appear hypoechoic due to the increased echogenecity of the bachground liver, and may mimic a wide variety of lesions, including liver metastases. At CT, multiple HCA’s may appear hyperdense on the unenhanced as well as enhanced scans because of the low density of the fatty liver.
Literature
1.International Working Party (1995) Terminology of nodular hepatocellular lesions. Hepatology 22:983 – 993
2.Anthony PP (2002) Tumours and tumour-like lesions of the liver and biliary tract: aetiology, epidemiology and pathology. In: MacSween RNM, Burt AD, Portmann BC, et al. (editors). Pathology of the liver. Fourth edition. Churchill Livingstone pp. 711 – 775
3.Flejou JF, Barge J, Menu Y, et al. (1985) Liver adenomatosis. An entity distinct from liver adenoma? Gastroenterology 89:1132 – 1138
4.Hussain SM, Van den Bos IC, Dwarkasing S, et al. (2006) Hepatocellular adenoma: findings at state-of-the-art magnetic resonance imaging, ultrasound, computed tomography and pathologic analysis. Eur Radiol 16: 1873 – 1886
Pathology
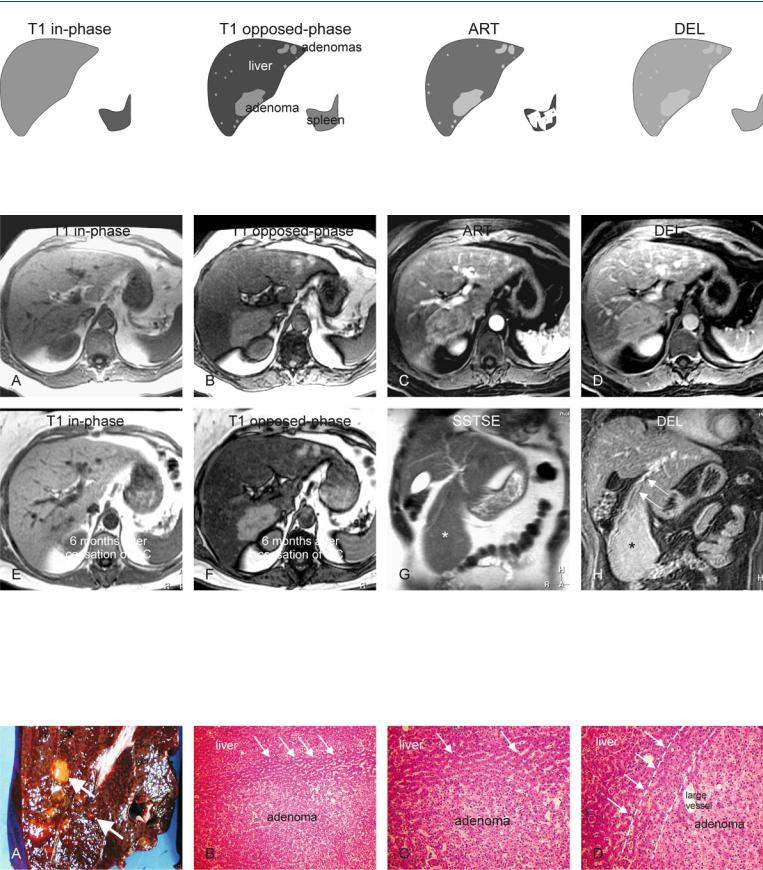
Histologically, there is no difference among the adenomas arising as single lesions, multiple lesions (2-6 lesions), and liver adenomatosis (> 10 lesions) (Fig. 66.3). The difference between “multiple” and “adenomatosis” is arbitrary. Previously, some reports had suggested that liver adenomatosis occurred in a different population and the change in size of these adenomas did not depend on the OC use. Recent reports as well as our own experience contradict this. Therefore, it is likely that “hepatocellular adenomas” and “liver adenomatosis” are two manifestations of the same underlying disease.
66 Hepatocellular Adenoma V – Multiple in Fatty Liver (Non-OC-Dependent) 141
Fig. 66.1. Multiple adenomas, drawings. T1 in-phase: no lesions are visible. Adenomas are isointense to the liver; T1 opposed-phase: multiple larger as well as very small adenomas are present in the entire liver, which shows
Fig. 66.2. Multiple adenomas, before and after OC: MRI findings. A Axial inphase T1-w GRE (T1 in-phase): Adenomas are isointense to the liver. B Axial opposed-phase T1-w GRE (T1 opposed-phase): Multiple larger and smaller adenomas become visible due to strong signal drop in the fatty liver. C Axial arterial phase T1-w GRE image (ART): Adenomas show homogeneous enhancement. D Axial delayed phase GRE image (DEL): Adenomas become isointense to the liver. E Axial in-phase T1-w GRE (T1 in-phase): 6 months
strong fatty infiltration; ART: adenomas show homogeneous enhancement; DEL: adenomas become almost isointense to the liver. Note that none of lesions shows tumor capsule
follow-up after stopping OC. No change is visible. F Axial opposed-phase T1-w GRE (T1 opposed-phase): 6 months follow-up after stopping OC. Adenomas remain unchanged in size, number, and signal intensity. G Coronal T2-w SSTSE (SSTSE): A large exophytic adenoma is visible originating from segment IVB of the liver (*). H Coronal delayed phase (DEL): Adenoma (*) clearly receives its vasculature from the liver (arrows)
Fig. 66.3. Pathology and histology of multiple adenomas (from a different patient). A Photograph of a resected specimen shows multiple adenomas (arrows) within normal liver. B Photomicrograph shows the transition with compressed liver (between the lines indicated by arrows), surrounding the
adenoma. H&E, × 100. C Photomicrograph shows an adenoma with mononuclear cells, surrounded by compressed liver (arrows). H&E, × 200. D Photomicrograph: The pseudocapsule is formed by compressed liver (lines and arrows). H&E, × 200

142 Part IID – Primary Solid Liver Lesions in Non-Cirrhotic Liver
67Hepatocellular Adenoma VI – Multiple in Fatty Liver (OC-Dependent)
The exact pathogenesis of HCA is not known. Based on a detailed pathologic analysis of various types of lesions that occur in patients with liver adenomatosis, a number of different types of lesions were observed in the same liver. Based on these observations, the following sequence of events was hypothesized: focus → group of foci → nodule → microadenoma → adenoma.
Malignant transformation of HCA into HCC has been described in the literature by several groups. Most authors have reported transformation of an existing HCA into HCC. At this point in time, it is not quite clear if all HCAs eventually can transform into HCCs. Also the exact characteristics of HCAs that eventually may undergo malignant transformation are not well known. Currently, most authors consider increase in size of the lesion at imaging, increased serum alpha-fetoprotein, and suspicious findings at fine-needle aspiration biopsy as signs of malignant transformation of HCA. According to some authors, some HCAs can undergo changes similar to liver cell dysplasia (LCD). In principle, HCA is not pre-malignant and may undergo reversible change after withdrawal of oral contraceptive (OC), whereas LCD is an irreversible, pre-malignant change and will eventually progress to HCC (HCA-LCD-HCC sequence). After stopping OC, HCAs may show a decrease in size.
Literature
1.Gyorffy EJ, Bredfeldt JE, Black WC (1989) Transformation of hepatic cell adenoma to hepatocellular carcinoma due to oral contraceptive use. Ann Intern Med 110:489 – 490
2.Tao LC (1991) Oral contraceptive-associated liver cell adenoma and hepatocellular carcinoma: cytomorphology and mechanism of malignant transformation. Cancer 68:341 – 347
3.Ferrell LD (1993) Hepatocellular carcinoma arising in a focus of multilobular adenoma: a case report. Am J Surg Pathol 17:525 – 529
4.Foster JH, Berman MM (1994) The malignant transformation of liver cell adenomas. Arch Surg 129:712 – 717
5.Lepreux S, Laurent C, Blanc JF, et al. (2003) The identification of small nodules in liver adenomatosis. J Hepatol 39:77 – 85
MR Imaging Findings
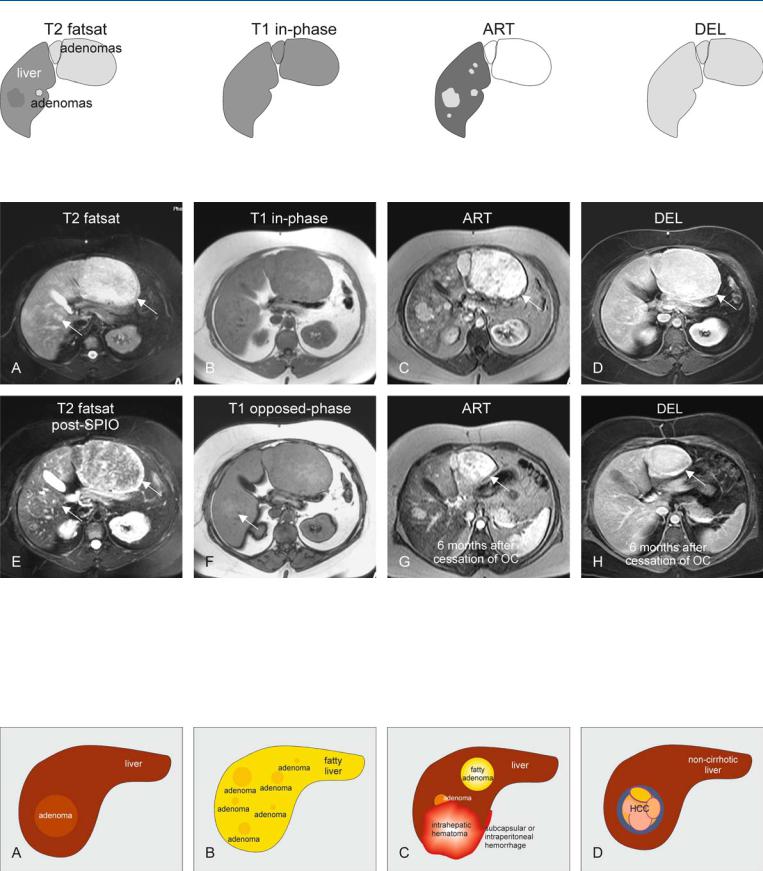
At MR imaging, multiple HCA within a single liver may vary in signal intensity on T2-weighted images. The liver as well as the lesions may contain a variable amount of fat on opposed-phase images. Arterial phase is perhaps the most sensitive sequence to detect lesions. On the delayed phase images, the lesions should not show any washout or enhanced tumor capsule (Figs. 67.1, 67.2). MR imaging can display many faces of hepatocellular adenomas. (1) A non-fatty single lesion in a non-fatty liver: the lesion appears very similar to the surrounding liver. (2) Multiple HCAs within a fatty liver. (3) Fatty HCA and small HCAs associated with intraand extrahepatic hematomas. (4) Hepatocellular carcinomas (HCC) may arise from HCAs or at the same anatomic location after regression of HCA. Note the confluent nodules of HCC contained within a thick fibrous tumor capsule (Fig. 67.3).
67 Hepatocellular Adenoma VI – Multiple in Fatty Liver (OC-Dependent) 143
Fig. 67.1. Multiple adenomas, drawings. T2 fatsat: some adenomas are hyperintense, others isointense and at least one is slightly hypointense to the liver;
Fig. 67.2. Forty-three-year-old female – multiple adenomas, before and after OC: MRI findings. A Axial fat-suppressed TSE image (T2 fatsat): Multiple adenomas (arrows) are slightly hyperintense to the liver. B Axial in-phase T1-w GRE (T1 in-phase): Adenomas are isointense to the liver. C Axial arterial phase post-Gd T1-w GRE image (ART): Adenomas show homogeneous intense enhancement. D Axial delayed post-Gd T1-w GRE image (DEL): Adenomas become isointense without any central scar or capsular enhancement. E Axial fatsat T2-w TSE after SPIO (SPIOT2 fatsat): Adenomas show
T1 in-phase: all adenomas are isointense; ART: multiple adenomas show homogeneous enhancement; DEL: all adenomas become isointense to the liver
uptake of iron indicating the presence of Kupffer cells and primary origin of the lesions (arrow). F Axial opposed-phase T1-w image (T1 opposed-phase): The liver shows some fatty infiltration rendering some of the lesions hyperintense (arrow). G Axial arterial phase post-Gd T1-w image 6 months after stopping OC (ART): Adenomas show significant decrease in size (arrow). H Axial delayed post-Gd T1-w GRE image (DEL): Adenomas remain homogeneous in delayed phase (arrow)
Fig. 67.3. The many faces of hepatocellular adenoma (HCA). A Single HCA that is very similar to the surrounding liver parenchyma, and hence difficult to recognize on imaging. B Multiple HCA (adenomatosis) in a fatty liver. C Fat-
ty HCA and HCA associated with intraand extrahepatic hemorrhage. D Adenoma-like HCC may arise as a complication of HCA or long-term oral contraceptive use

144 Part IID – Primary Solid Liver Lesions in Non-Cirrhotic Liver
68HCC in Non-Cirrhotic Liver I – Small with MR-Pathologic Correlation
Hepatocellular carcinomas (HCCs) usually occur in patients with cirrhosis with an underlying viral hepatitis or alcohol abuse. HCC in cirrhosis typically shows a stepwise carcinogenesis (regenerative nodule-dysplastic nodule-HCC). In Europe and North America, HCC in non-cirrhotic livers may be present in up to 40 % of patients with HCC. HCC in non-cirrhotic livers is believed to occur according to de-novo carcinogenesis: a microscopic focus of HCC gradually develops into full-grown HCC. HCCs in non-cirrhotic livers are likely to be a solitary and relatively large dominant encapsulated mass with a central scar. However, mid-sized lesions do occur at imaging. It is important to recognize HCC in non-cirrhotic liver because these lesions are amenable to surgery even with a large size with good clinical outcome.
Literature
1.Okuda K, Nakashima T, Sakamoto K, et al. (1982) Hepatocellular carcinoma arising in noncirrhotic and highly cirrhotic livers: a comparative study of histopathology and frequency of hepatitis B markers. Cancer 49:450 – 455
2.Nakayama M, Kamura T, Kimura M, et al. (1998) Quantitative MRI of hepatocellular carcinoma in cirrhotic and noncirrhotic livers. Clin Imaging 22:280 – 283
3.Winston CB, Schwartz LH, Fong Y, et al. (1999) Hepatocellular carcinoma: MR imaging findings in cirrhotic and noncirrhotic livers. Radiology 210:75 – 79
4.Hussain SM, Semelka RC, Mitchell DG (2002) MR imaging of hepatocellular carcinoma. Magn Reson Imaging Clin N Am 10:31 – 52
MR Imaging Findings
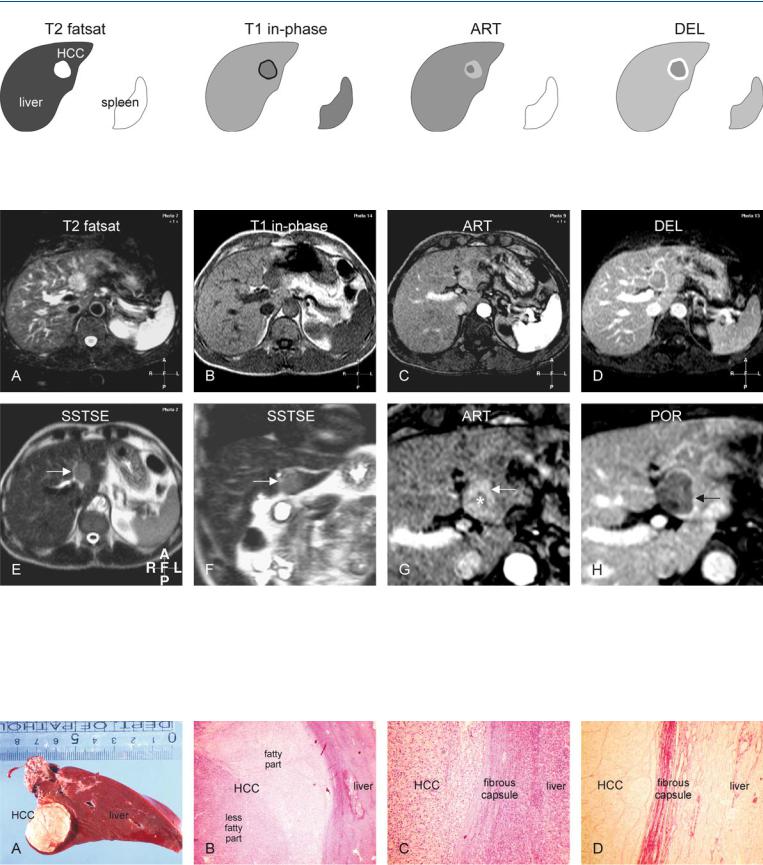
At MR imaging, HCCs in non-cirrhotic livers have often moderately high signal intensity on T2-weighted images and low signal intensity on T1-weighted images, and in this respect may resemble metastases. The lesions show heterogeneous enhancement in the arterial phase, and washout with capsular enhancement in the delayed phase (Figs. 68.1, 68.2).
Pathology
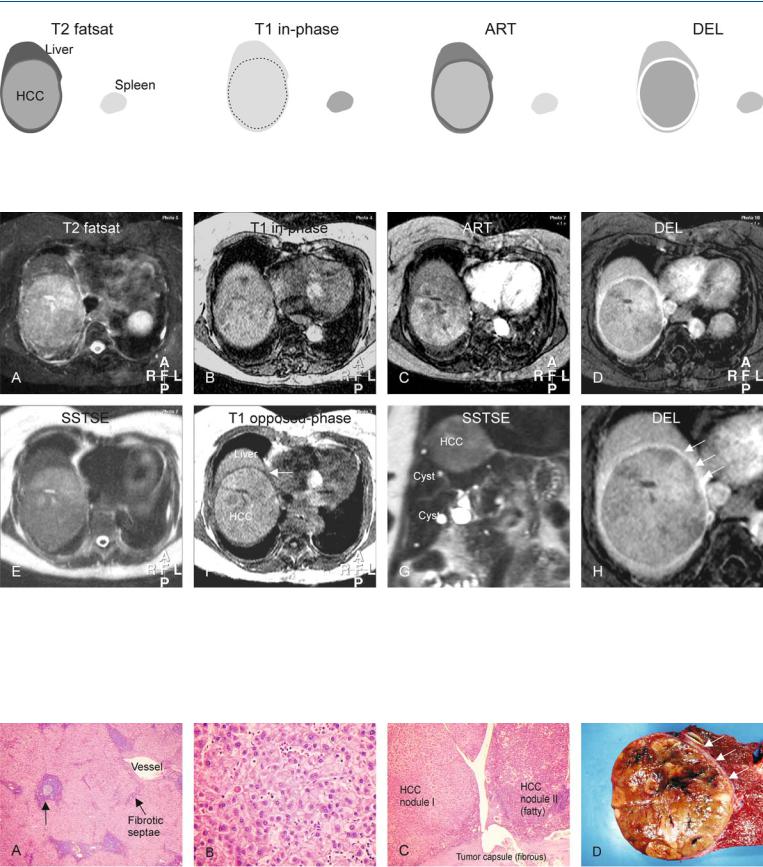
At gross pathology, midsized HCC in non-cirrhotic liver appears as a yellowish dominant nodule in a normal liver with smooth edges and normal color. At histology, the nodule may have great similarities to their cirrhotic counterparts and may contain subnodules with variable amounts of fat and a fibrous tumor capsule (Fig. 68.3).
68 HCC in Non-Cirrhotic Liver I – Small with MR-Pathologic Correlation 145
Fig. 68.1. HCC, non-cirrhotic liver, medium-sized, drawings. T2 fatsat: HCC is hyperintense compared to the liver; T1 in-phase: HCC is hypointense with a dark tumor capsule; ART: HCC is more enhanced in the peripheral than in
Fig. 68.2. HCC, non-cirrhotic, medium-sized, MRI findings. A Axial fat-sup- pressed T2-w TSE image (T2 fatsat): HCC is hyperintense compared to the liver. B Axial in-phase T1-w GRE (T1 in-phase): HCC is slightly hypointense compared to the liver with a darker tumor capsule. C Axial arterial phase post-Gd 2D T1-w GRE image (ART): HCC is more enhanced in the peripheral than in the central part. D Axial delayed phase 3D T1-w GRE image (DEL): HCC shows washout with enhancement of the tumor capsule. E Axial T2-w
the central part (mosaic pattern); DEL: HCC shows washout with enhancement of the tumor capsule
SSTSE image (SSTSE): HCC is slightly hyperintense compared to the liver (arrow). F Coronal SSTSE image (SSTSE): HCC becomes more hypointense due to its solid nature (arrow). G Axial arterial phase GRE image (ART): HCC is more enhanced in the peripheral (arrow) than in the central part (*). H Axial delayed phase GRE image (POR): HCC shows washout with enhancement of the tumor capsule (arrow)
Fig. 68.3. HCC, non-cirrhotic liver, medium-sized, direct MR-pathology correlation. A Photograph of the resected specimen with the normal liver (non-cir- rhotic liver) and an HCC. B Photomicrograph of the HCC shows two parts of the HCC with a thick capsule. H&E, × 40. C Photomicrograph shows HCC
surrounded by a thick capsule. H&E, × 100. D Photomicrograph more clearly shows the stained fibrous tissue composing the thick tumor capsule. Sirius red stain, × 100

146 Part IID – Primary Solid Liver Lesions in Non-Cirrhotic Liver
69HCC in Non-Cirrhotic Liver II – Large with MR-Pathologic Correlation
Hepatocellular carcinomas (HCCs) in non-cirrhotic patients are more likely to be solitary than in patients with cirrhosis (72 % vs. 27 %). The lesions are significantly larger than in cirrhotic livers and are well-circumscribed masses in 57 % of cases (median size: 8.8 cm). Central scar is more frequent in HCC in non-cirrhotic than in cirrhotic liver (50 % vs. 6 %). Smaller satellite nodules are present in only 6 % of cases. Venous invasion is substantially more common in patients with cirrhosis (41 %) than in patients without underlying liver disease (15 %) and thus potentially promotes transhepatic hematogenous tumor spread. HCC originating in a non-cirrhotic liver is more likely to involve lymph nodes.
Literature
1.Okuda K, Nakashima T, Sakamoto K, et al. (1982) Hepatocellular carcinoma arising in noncirrhotic and highly cirrhotic livers: a comparative study of histopathology and frequency of hepatitis B markers. Cancer 49:450 – 455
2.Winston CB, Schwartz LH, Fong Y, et al. (1999) Hepatocellular carcinoma: MR imaging findings in cirrhotic and noncirrhotic livers. Radiology 210:75 – 79
3.Bismuth H, Chiche L, Castaing D (1995) Surgical treatment of hepatocellular carcinoma in non-cirrhotic liver: experience in 68 liver resections. World J Surg 19:35 – 41
4.Smalley S, Moertel C, Hilton J, et al. (1988) Hepatoma in the noncirrhotic liver. Cancer 62:1414 – 1424
MR Imaging Findings
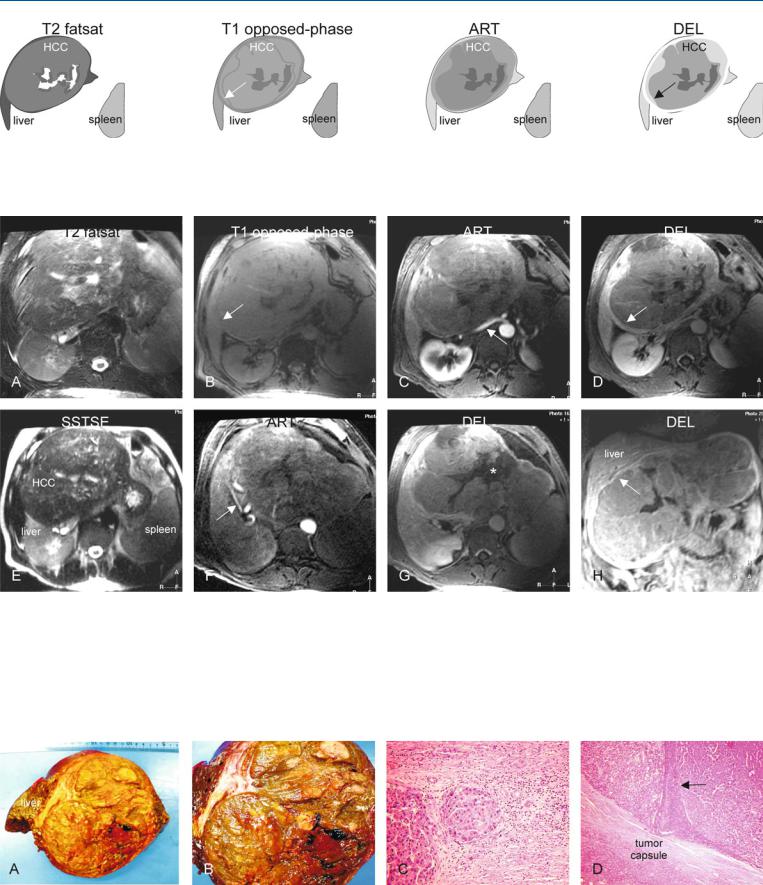
At MR imaging, HCC in non-cirrhotic liver will typically present as a large hyperintense lesion on T2-weighted images. Unencapsulated lesions are likely to show satellite nodules. On opposed-phase T1-weighted images, the lesions may be surrounded by a rim of compressed, non-fatty, liver parenchyma within a fatty liver. Due to neoangiogenic activity, the lesions contain large tumor vessels which can be seen on gadolinium-enhanced images in the arterial phase, particularly after postprocessing (Figs. 69.1, 69.2). MR imaging can provide an exact road-map for surgical resection. MR-path- ologic correlation may provide evidence for the vasoinvasive growth which is most likely the basis for the satellite nodules (Fig. 69.3).
Management
For HCC in cirrhotic livers, the size of a lesion is an important variable for both treatment planning and patient outcome. Lesions larger than 5 cm in diameter have been shown to be associated with a poorer prognosis after hepatic resection. For HCC in non-cirrhot- ic livers this may not be true. In one study, 72 % of patients with HCC in non-cirrhotic livers (median size > 8 cm) underwent partial resection. These patients may develop late recurrence, but aggressive surgery is nonetheless justified. Surgical procedures may consist of major hepatectomy (three segments or more). Operative mortality and morbidity were 2.9 % and 19.0 %, respectively. The 1-, 3-, 5-, and 10-year survivals and the survivals without recurrence were 74 %, 52 %, 40 %, and 26 % and 69 %, 43 %, 33 %, and 19 %, respectively.
69 HCC in Non-Cirrhotic Liver II – Large with MR-Pathologic Correlation 147
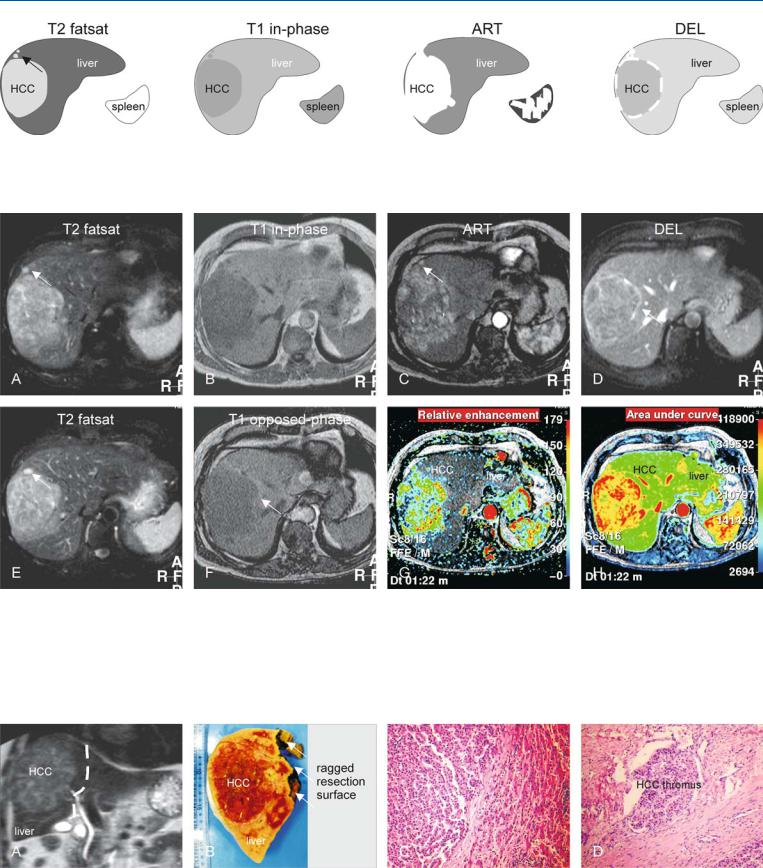
Fig. 69.1. HCC, non-cirrhotic, drawings. T2 fatsat: HCC is hyperintense to the liver; note the satellite nodule in the periphery of the tumor (arrow); T1 inphase: HCC is hypointense to the liver; ART: HCC shows intense heteroge-
Fig. 69.2. HCC, non-cirrhotic, large, typical MRI findings. A Axial TSE image (T2 fatsat): HCC is hyperintense to the liver with similar satellite nodules (arrow). B Axial in-phase image (T1 in-phase): HCC is hypointense to the liver. C Axial arterial phase image (ART): HCC as well as the satellite nodules (arrow) show intense heterogeneous enhancement. D Axial delayed phase image (DEL): HCC shows washout with enhancement of the tumor capsule that partially surrounds the HCC (arrow). E Axial TSE image (T2 fatsat) at a
neous enhancement; DEL: HCC shows washout with enhancement of the discontinuous tumor capsule
different anatomic level: note a satellite nodule at the level of the tumor capsule (arrow). F Axial opposed-phase image (T1 opposed-phase): Subtle fatty liver has decreased its signal with persistent high signal in the perilesional compressed liver parenchyma (arrow). G Pixelwise color-coded display of the relative enhancement shows the intratumoral arterial vessels. H Pixelwise color-coded display of the area-under-the-curve shows the total amount of contrast of the liver and the HCC, which is much larger
Fig. 69.3. HCC, non-cirrhotic, direct MR-pathology correlation. A Coronal SSTSE image shows the liver, HCC, and the resection surface (white dashed line). B Photograph of the right-sided hemihepatectomy specimen shows a large HCC that is – in part – surrounded by a tumor capsule. C Photomicrograph
shows two adjacent HCC nodules that are separated by a septum. H&E, × 100. D Photomicrograph shows an HCC thrombus within a large peritumoral vessel, which explains – in part – the presence of satellite nodules. H&E, × 100
148 Part IID – Primary Solid Liver Lesions in Non-Cirrhotic Liver
70HCC in Non-Cirrhotic Liver III – Large Lesion with Inconclusive CT
The fundamental limitation of CT is its lack of intrinsic soft tissue contrast and its moderate sensitivity to the presence of intravenous contrast. For detection and characterization, CT mainly relies on high in-plane spatial resolution and vascularity of liver lesions. Small liver lesions (< 2 cm), which are now more often detected on current multidetector CT (MDCT) with thinner collimations, generally cannot be characterized with confidence at CT. Because of the high prevalence of benign liver lesions, the majority of these will be cysts, hemangiomas, biliary hamartomas, focal nodular hyperplasia or hepatocellular adenomas. However, there is no guarantee of this, and therefore it is incumbent on the imaging study to properly characterize these lesions. At CT, distinction between a small and a large benign liver lesion and a metastasis or HCC can be difficult. The major strength of multidetector CT is its ability to show the hepatic vascular (mainly arterial) anatomy. This, however, does not facilitate better characterization of focal or diffuse liver lesions as illustrated in the example below.
Literature
1.Winston CB, Schwartz LH, Fong Y, et al. (1999) Hepatocellular carcinoma: MR imaging findings in cirrhotic and noncirrhotic livers. Radiology 210:75 – 79
2.Hussain SM, Semelka RC, Mitchell DG (2002) MR imaging of hepatocellular carcinoma. Magn Reson Imaging Clin N Am 10:31 – 52
3.Hussain SM, Semelka RC (2005) Hepatic imaging: comparison of modalities. Radiol Clin N Am 43:929 – 947
MR Imaging Findings
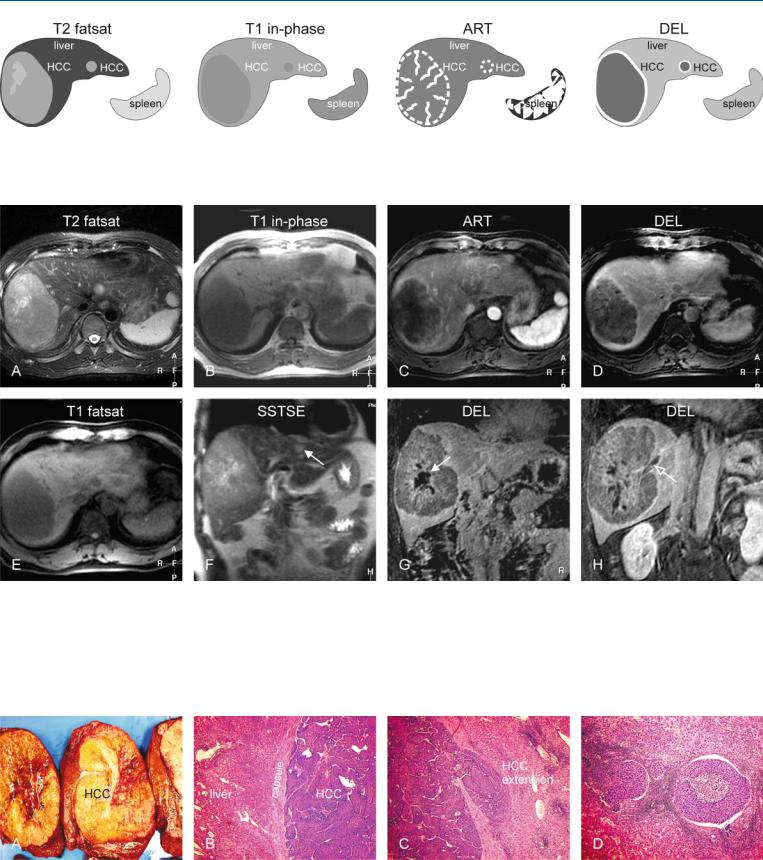
At MR imaging, various components of the focal liver lesions can be identified to make the correct diagnosis. MR imaging can identify the presence of (1) fat within the lesions on inand opposed-phase imaging; (2) intratumoral nodules and tumor vessels on the gado- linium-enhanced imaging in the arterial phase; and (3) tumor capsule on the T1-weighted images as well as on the delayed phase images. In addition, (4) the liver shows no sign of cirrhosis, which includes irregular contours, atrophy of certain segments and hypertrophy of others, and intrahepatic nodules. Based on these findings, an HCC in a non-cirrhotic liver can be diagnosed confidently (Figs. 70.1, 70.2). The findings of multiphasic MDCT will be inconclusive (Fig. 70.3A–C). After resection, pathology confirms the MR imaging findings (Fig. 70.3D).
70 HCC in Non-Cirrhotic Liver III – Large Lesion with Inconclusive CT 149
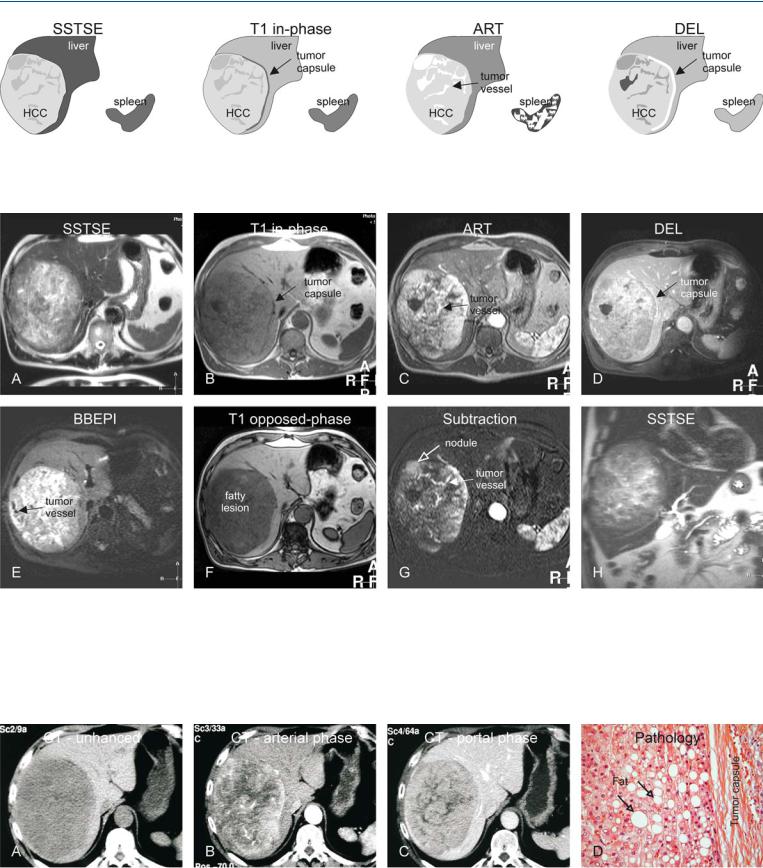
Fig. 70.1. HCC, non-cirrhotic, large lesion with inconclusive CT (see below), drawings. SSTSE: HCC is hyperintense to the liver; T1 in-phase: HCC is predominantly hypointense to the liver with a darker partial capsule; ART: HCC
Fig. 70.2. HCC, non-cirrhotic, large fatty lesion with an inconclusive CT (see below), MRI findings. A Axial SSTSE image (SSTSE): HCC is hyperintense to the liver. B Axial in-phase image (T1 in-phase): HCC is predominantly hypointense to the liver with a darker tumor capsule. C Axial arterial phase image (ART): HCC shows intense heterogeneous enhancement with intratumoral vessels. D Axial delayed phase image (DEL): HCC shows washout with enhancement of a partial tumor capsule (arrow). E Axial BBEPI image
shows intense heterogeneous enhancement; DEL: HCC shows washout with enhancement of a partial tumor capsule
(BBEPI): intratumoral vessels appear dark due to the application of diffusion gradients that dephase the signal from flowing blood. F Axial opposedphase image (T1 opposed-phase): HCC appears darker compared to the inphase image due to fatty infiltration. G Subtraction image based on the arterial phase shows enhanced intratumoral nodules and vessels. H Coronal SSTSE image (SSTSE): HCC is visible in a normal (non-cirrhotic) liver with normal signal and sharp edges
Fig. 70.3. HCC, non-cirrhotic, inconclusive CT findings, and pathology after resection. A Unenhanced CT shows a hypodense large tumor. B CT in the arterial phase shows a hypervascular lesion. C CT in the portal phase shows more homogeneous enhancement of the lesion. D Photomicrograph from the re-
sected specimen shows a hepatocellular tumor with fatty infiltration that is surrounded by a fibrous tumor capsule. Pathology confirmed the MRI findings. H&E, × 200

150 Part IID – Primary Solid Liver Lesions in Non-Cirrhotic Liver
71HCC in Non-Cirrhotic Liver IV – Cholangiocellular or Combined Type
Combined hepatocellular-cholangiocarcinoma (cHCC-CC) is a rare form of primary liver carcinoma comprising cells with histopathologic features of both hepatocellular carcinoma (HCC) and cholangiocarcinoma (CC). cHCC-CC patients show a greater similarity to HCC patients than to CC patients with regard to male/female ratio, status of hepatitis viral infection, serum alpha-fetopro- tein level, and non-tumor liver histology. The average size of tumors is about 9 cm. At presentation, the disease stage of cHCC-CC patients is more advanced than that of either HCC or CC patients. Satellite nodules and lymph node metastases are less common than in HCC in non-cirrhotic livers. The surgical approach is recommended for selected patients with cHCC-CC. The prognosis is poorer than that of HCC.
Literature
1.Yano Y, Yamamoto J, Kosuge T, et al. (2003) Combined hepatocellular and cholangiocarcinoma: a clinicopathologic study of 26 resected cases. Jpn J Clin Oncol 33:283 – 287
2.Maeda T, Adachi E, Kajiyama K, et al. (1995) Combined hepatocellular and cholangiocarcinoma: proposed criteria according to cytokeratin expression and analysis of clinicopathologic features. Hum Pathol 26:956 – 964
3.Jarnagin WR, Weber S, Tickoo S, et al. (2002) Combined hepatocellular and cholangiocarcinoma: demographic, clinical, and prognostic factors. Cancer 94:2040 – 2046
4.Liu CL, Fan ST, Lo CM, et al. (2003) Hepatic resection for combined hepatocellular and cholangiocarcinoma. Arch Surg 138:86 – 90
MR Imaging Findings
At MR imaging, the cholangiocellular type of HCC appears predominantly bright on T2-weighted images, most likely due to the presence fluid-filled glands. On T1-weighted images, the lesions are hypointense. The tumors show intense heterogeneous enhancement on the gadolinium-enhanced images in the arterial phase and washout in the delayed phase. A tumor capsule may faintly enhance. Apart from the high signal intensity on T2-weighted images, liver capsular retraction may be seen (Figs. 71.1, 71.2).
Pathology
Tumors often show histopathologic features intermediate between those of HCC and CC throughout or demonstrate a gradual transition from moderate to well differentiated areas of HCC toward glandular CC areas (Fig. 71.3A, B).
Management
The majority of tumors can be resected successfully. However, patients with HCC-CC are said to have a worse survival outcome after hepatic resection when compared with patients with HCC. Postoperative adjuvant therapy and multimodality treatment for recurrent disease are required to prolong the survival of these patients. Any extrahepatic or recurrent lesions will show similar increased enhancement on gadolinium-enhanced MR imaging in the arterial phase (Fig. 71.3C, D).
71 HCC in Non-Cirrhotic Liver IV – Cholangiocellular or Combined Type 151
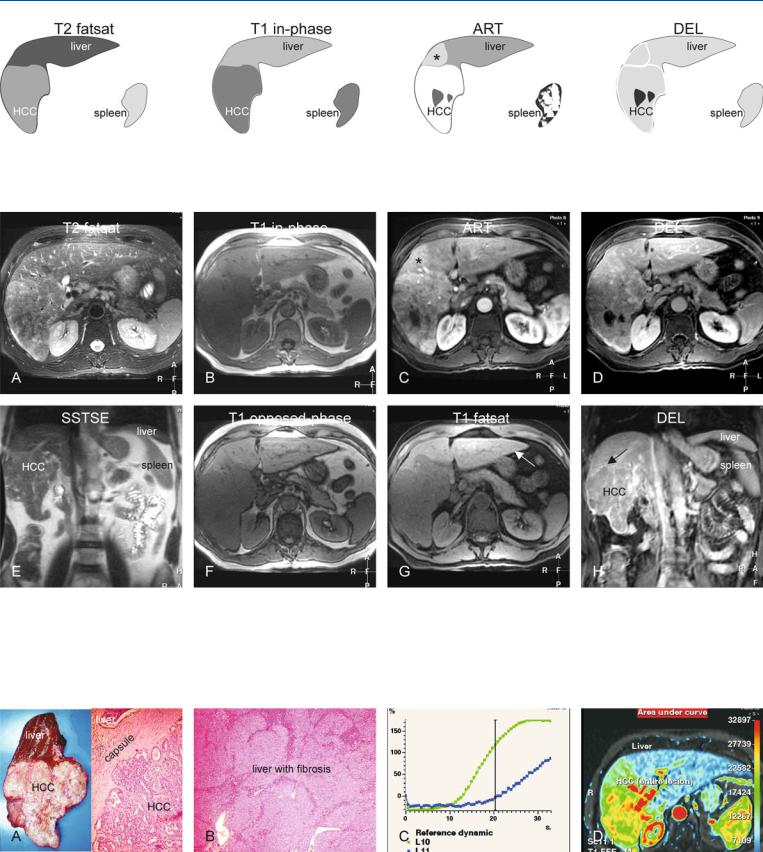
Fig. 71.1. HCC, non-cirrhotic liver, cholangiocellular type, drawings. T2 fatsat: HCC is slightly brighter and heterogeneous to the liver; T1 in-phase: HCC is hypointense to the liver; ART: HCC shows intense heterogeneous enhance-
Fig. 71.2. HCC, non-cirrhotic liver, cholangiocellular type, MRI findings. A Axial TSE image (T2 fatsat): HCC is heterogeneous and predominantly hyperintense to the liver. B Axial in-phase image (T1 in-phase): HCC is hypointense to the liver. C Axial arterial phase image (ART): HCC shows intense heterogeneous enhancement with a wedge-shaped perilesional enhancement (*). D Axial delayed phase image (DEL): HCC shows washout and becomes al-
ment with a wedge-shaped perilesional enhancement (*); DEL: HCC shows washout and becomes almost isointense to the liver
most isointense to the liver. E Axial SSTSE image (SSTSE): HCC is slightly hyperintense to the liver. F Axial opposed-phase image (T1 opposed-phase): No fatty infiltration is present. G Axial fat-suppressed T1 GRE image (T1 fatsat): The liver has a normal signal and smooth edges (arrow), consistent with a non-cirrhotic liver. H Coronal delayed phase image (DEL): HCC shows washout with faintly enhanced tumor capsule (arrow)
Fig. 71.3. HCC, direct MR-pathology correlation and time-intensity curves. A Photograph of the resected tumor specimen shows HCC in a non-cirrhotic liver. Photomicrograph: HCC shows multiple glands (cholangiocellular type). H&E, × 100. B Photomicrograph: Note the liver with septa and inflamma-
tion, consistent with fibrosis. H&E, × 40. C Time-intensity curves (single slice scanning during the first 33 s after gadolinium) of the liver (blue) and HCC (green). D Color-coded display of the area-under-the-curve shows the total amount of contrast of the liver and the HCC

152 Part IID – Primary Solid Liver Lesions in Non-Cirrhotic Liver
72HCC in Non-Cirrhotic Liver V – Central Scar and Capsule Rupture
Hepatocellular carcinoma (HCC) in non-cirrhotic livers is a large lesion which frequently shows a large malformed central scar, a tumor capsule, and satellite nodules. Particularly, the presence of a large central scar on imaging may mimic other liver lesions including giant hemangioma and focal nodular hyperplasia. These entities can be distinguished based on MR imaging.
MR Imaging Findings
At MR imaging, the liver appears normal with smooth edges and normal signal intensity. The central scar may be relatively large with coarse septa. The appearance may be very bright (fluid-like) on T2-weighted images. On T2-weighted images tumor capsule is not visible because of its low signal intensity. On T1-weighted images, the central scar appears darker than the hypointense lesion compared to the surrounding liver. Tumor capsule appears as a rim of low signal intensity surrounding the tumor. The tumor shows intense heterogeneous enhancement in the arterial phase with enhancement of one or more satellite nodules in the periphery of the lesion. In the delayed phase, the tumor shows washout with enhancement of the tumor capsule, which shows discontinuity at the level of the satellite nodules consistent with tumor rupture. At another anatomic level, the tumor capsule may appear intact (Figs. 72.1, 72.2). The size of the lesions as well as the size of the central scars may vary but the basic MR imaging appearance remains consistent (Fig. 72.3).
Literature
1.Winston CB, Schwartz LH, Fong Y, et al. (1999) Hepatocellular carcinoma: MR imaging findings in cirrhotic and noncirrhotic livers. Radiology 210:75 – 79
2.Hussain SM, Semelka RC, Mitchell DG (2002) MR imaging of hepatocellular carcinoma. Magn Reson Imaging Clin N Am 10:31 – 52
3.Hussain SM, Zondervan PE, et al. (2002) Benign versus malignant hepatic nodules: MR imaging findings with pathologic correlation. Radiographics 22:1023 – 36
4.Hussain SM, Terkivatan T, Zondervan PE, et al. (2004) Focal nodular hyperplasia: a spectrum of findings at state-of-the-art MR imaging, ultrasound, CT and pathology. Radiographics 24:3 – 19
5.Hussain SM, Semelka RC (2005) Liver masses. Magn Reson Imaging Clin N Am 13:255 – 275
Differential Diagnosis
Giant hemangiomas are much brighter with an even brighter central scar on T2-weighted images, and show characteristic peripheral nodular enhancement in the arterial phase and persistent enhancement in the delayed phase. Focal nodular hyperplasias are near isointense on T1and T2-weighted images with a well-formed smaller central scar, and show intense homogeneous enhancement in the arterial phase, fading to isointensity in the delayed phase.
72 HCC in Non-Cirrhotic Liver V – Central Scar and Capsule Rupture 153
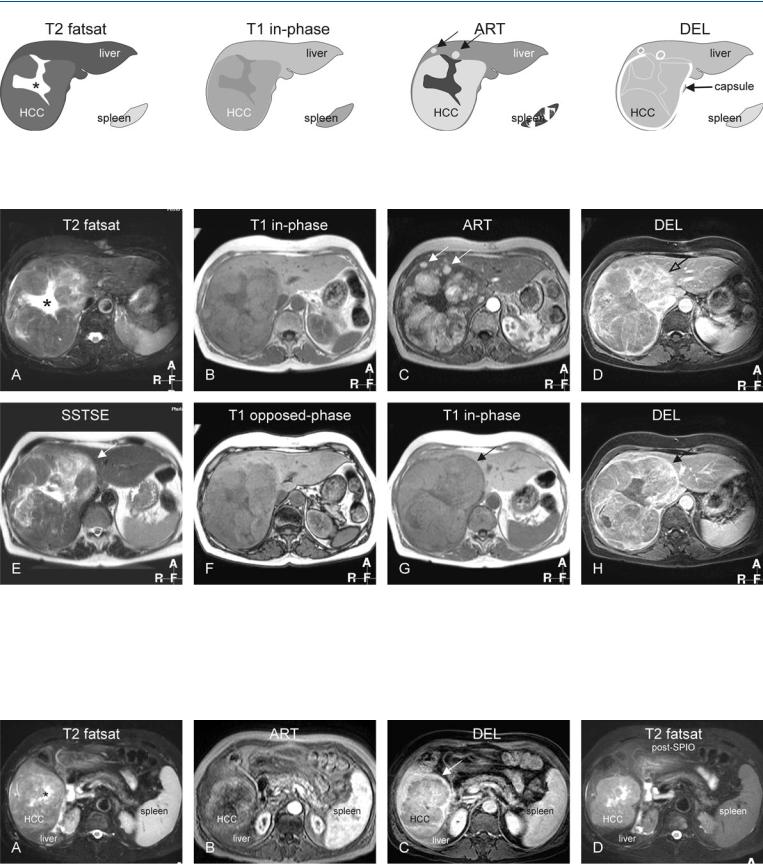
Fig. 72.1. HCC, non-cirrhotic, central scar, capsule rupture, and satellite nodules, drawings. T2 fatsat: HCC is slightly hyperintense to the liver with a brighter central scar (*); T1 in-phase: HCC is slightly hypointense to the liver;
Fig. 72.2. HCC, non-cirrhotic, central scar, capsule rupture, and satellite nodules, MRI findings. A Axial TSE image (T2 fatsat): HCC is slightly hyperintense to the liver with a large, brighter central scar (*) with thick septa. B Axial inphase image (T1 in-phase): HCC is slightly hypointense to the liver. C Axial arterial phase image (ART): HCC shows intense heterogeneous enhancement. Note also the satellite nodules (arrows). D Axial delayed phase image (DEL): HCC shows washout and enhanced tumor capsule that is discontinu-
ART: HCC shows intense heterogeneous enhancement; note also the satellite nodules (arrows); DEL: HCC shows washout and enhanced tumor capsule that is discontinuous at the site of the satellite nodules
ous at the site of the satellite nodules (open arrow). E Axial SSTSE image (SSTSE) at a different anatomic level: low signal intensity capsule completely surrounds the HCC (arrow). F Axial opposed-phase image (T1 opposedphase): no fatty infiltration is present. G Axial in-phase image (T1 in-phase) at a different anatomic level: low signal intensity capsule completely surrounds the HCC (arrow). H Axial delayed phase image (DEL): HCC shows washout with enhanced septa and an intact tumor capsule (arrow)
Fig. 72.3. HCC, non-cirrhotic, central scar (another patient), MRI findings. A Axial TSE image (T2 fatsat): HCC is isointense to the liver with a brighter central scar (*). B Axial arterial phase image (ART): HCC shows heterogeneous enhancement. C Axial delayed phase image (DEL): HCC shows washout and an
enhanced tumor capsule that surrounds – in part – the HCC (arrow). D Axial TSE image (T2 fatsat) after uptake of SPIO: HCC appears much brighter with better delineation due to the signal loss of the liver. Note also the signal loss in the spleen

154 Part IID – Primary Solid Liver Lesions in Non-Cirrhotic Liver
73HCC in Non-Cirrhotic Liver VI – Capsule with Pathologic Correlation
Tumor capsule, a characteristic sign of HCC in cirrhosis as well as in non-cirrhotic livers, is present in 60 – 82 % of cases. Up to 75 % of the lesions with a capsule will be larger than 2 cm. The tumor capsule becomes thicker with increasing tumor size. Histologically, tumor capsules are composed of two layers, an inner fibrous layer and an outer layer containing compressed vessels and bile ducts. Tumor capsule is a highly specific sign of HCC. Encapsulated lesions are associated with a better prognosis than are unencapsulated lesions after surgical resection. The recognition of the tumor capsule on imaging, particularly in non-cirrhotic liver, can facilitate the diagnosis of HCC.
Literature
1.Winston CB, Schwartz LH, Fong Y, et al. (1999) Hepatocellular carcinoma: MR imaging findings in cirrhotic and noncirrhotic livers. Radiology 210:75 – 79
2.Hussain SM, Semelka RC, Mitchell DG (2002) MR imaging of hepatocellular carcinoma. Magn Reson Imaging Clin N Am 10:31 – 52
3.Hussain SM, Zondervan PE, et al. (2002) Benign versus malignant hepatic nodules: MR imaging findings with pathologic correlation. Radiographics 22:1023 – 36
4.Choi BI, Takayasu K, Han MC (1993) Small hepatocellular carcinoma and associated lesions of the liver: pathology, pathogenesis, imaging findings. AJR 160:1177 – 1187
MR Imaging Findings
At MR imaging, the tumor capsule is hypointense both on T1and T2-weighted images in most cases, although capsules with a thickness of more than 4 mm can have an outer hyperintense layer on T2-weighted images. The outer layer may be composed of compressed liver parenchyma, vessels, and inflammatory cell infiltrates. The best images for recognizing tumor capsules include (1) unenhanced T1-weighted images and (2) gadolinium-enhanced T1-weighted images in the delayed phase (Figs. 73.1, 73.2).
Pathology
At gross pathology, the tumor capsule is often visible surrounding the HCC, which often consists of smaller nodules. These nodules may be interspersed by areas with old hemorrhage. The surrounding liver may show evidence of periportal fibrosis (Fig. 73.3).
73 HCC in Non-Cirrhotic Liver VI – Capsule with Pathologic Correlation 155
Fig. 73.1. HCC, drawings. T2 fatsat: HCC is slightly hyperintense compared to the liver with a hypointense tumor capsule; T1 in-phase: HCC is almost isointense with hypointense tumor capsule; ART: HCC shows faint heteroge-
Fig. 73.2. HCC, non-cirrhotic, large, fat-containing, typical MRI findings. A Axial fat-suppressed T2-w TSE image (T2 fatsat): HCC is hyperintense to the liver with hypointense tumor capsule. B Axial in-phase image (T1 in-phase): HCC is slightly hypointense to the liver with a dark tumor capsule. C Axial arterial phase image (ART): HCC shows heterogeneous enhancement. D Axial delayed phase image (DEL): HCC shows washout with enhancement of the tumor capsule. E Axial SSTSE image (SSTSE): HCC is slightly hyperin-
neous enhancement; DEL: HCC shows washout with enhancement of the tumor capsule
tense to the liver. F Axial opposed-phase image (T1 opposed-phase): HCC as well as the liver shows a decreased signal compared to the in-phase image due to fatty infiltration. Hence the better visibility of the tumor capsule (arrow). G Coronal SSTSE image (SSTSE): HCC is brighter than the liver in subphrenic location. Note the multiple, much brighter, liver cysts. H A detailed view of the axial delayed phase image (DEL coronal): HCC is surrounded by a thick fibrous enhanced tumor capsule (arrows)
Fig. 73.3. HCC, non-cirrhotic, direct MR-pathology correlation. A Photomicrograph of the liver shows periportal inflammation (arrow) indicating hepatitis without cirrhosis. H&E, × 40. B Photomicrograph of the HCC shows thickened cell plates with atypical nuclei. H&E, × 400. C Photomicrograph
shows two adjacent HCC nodules that are surrounded by a thick fibrous tumor capsule. H&E, × 40. D Photograph of the resected specimen shows a large HCC with several smaller nodules that are surrounded by a tumor capsule (arrows)

156 Part IID – Primary Solid Liver Lesions in Non-Cirrhotic Liver
74HCC in Non-Cirrhotic Liver VII – Very Large with Pathologic Correlation
Hepatocellular carcinomas (HCCs) in non-cirrhotic livers may present with a very large mass of up to 25 cm in diameter. Such lesions are discovered late when they become symptomatic. The massive tumors are likely to compress the normal (non-cirrhotic) liver including the vasculature and the biliary tree. Despite the massive size and the space-occupying effects, biliary obstruction is often not present. Encapsulated massive HCCs in non-cirrhotic livers are likely to displace the hepatic vessels and do not invade them. Therefore, despite their impressive appearance surgical resection should be attempted.
Literature
1.Winston CB, Schwartz LH, Fong Y, et al. (1999) Hepatocellular carcinoma: MR imaging findings in cirrhotic and noncirrhotic livers. Radiology 210:75 – 79
2.Hussain SM, Semelka RC, Mitchell DG (2002) MR imaging of hepatocellular carcinoma. Magn Reson Imaging Clin N Am 10:31 – 52
3.Hussain SM, Zondervan PE, et al. (2002) Benign versus malignant hepatic nodules: MR imaging findings with pathologic correlation. Radiographics 22:1023 – 36
4.de Rave S, Hussain SM (2002) A liver tumour as an incidental finding: differential diagnosis and treatment. Scand J Gastroenterol Suppl 236:81 – 86
MR Imaging Findings
At MR imaging, the lesions may be difficult to evaluate because of their size. The multiplanar capability of MR imaging with multiple T1and T2-weighted sequences is essential for the workup of such lesions. The lesions are predominantly heterogeneous on T1and T2-weighted images. After injection of gadolinium, the lesions may show little, heterogeneous enhancement in the arterial phase, whereas in the delayed phase a thick tumor capsule may be seen. The presence of the tumor capsule is a very characteristic sign of HCC (Figs. 74.1, 74.2). Despite the thick fibrous tumor capsule, vasoinvasive growth may occur with the possibility of hematogenous spread through the liver (Fig. 74.3).
74 HCC in Non-Cirrhotic Liver VII – Very Large with Pathologic Correlation 157
Fig. 74.1. HCC, non-cirrhotic liver with a large mass, drawings. T2 fatsat: HCC is slightly hyperintense to the liver with brighter central structures; T1 opposed-phase: HCC is almost isointense to the liver with a darker tumor
Fig. 74.2. HCC, non-cirrhotic liver with a large mass, MRI findings. A Axial TSE image (T2 fatsat): HCC is hyperintense to the liver with bright areas in the center. B Axial in-phase image (T1 opposed-phase): HCC is almost isointense to the liver with a dark tumor capsule (arrow). C Axial arterial phase image (ART): HCC shows faint heterogeneous enhancement. Note the hypertrophic common hepatic artery (arrow). D Axial delayed phase image (DEL): HCC shows washout with persistent enhancement of the peripheral parts of the tumor and the tumor capsule (arrow). E Axial SSTSE image
capsule (arrow); ART: HCC shows faint heterogeneous enhancement; DEL: HCC shows washout with persistent enhancement of the peripheral parts and tumor capsule (arrow)
(SSTSE): HCC is hyperintense with multiple brighter intratumoral structures. F Axial arterial phase image (ART) at another anatomic level shows peritumoral hypertrophic hepatic arterial branches (arrow). G Axial delayed phase image (DEL): HCC shows washout with a central scar-like less enhanced area (*). H Coronal delayed phase image (DEL): HCC is visible as an impressive massive lesion surrounded by a capsule (arrow). Note that the liver is normal with smooth edges
Fig. 74.3. HCC, non-cirrhotic liver with a large mass, direct MR-pathology correlation. A Photograph of the resected specimen shows a large massive HCC with several smaller nodules and a thick tumor capsule. B A detailed view of the resected specimen shows the nodules and the capsule in more detail.
C Photomicrograph shows two nodules composed of abnormal hepatocytes. H&E, × 100. D Photomicrograph from the periphery of the HCC shows the tumor capsule and a large septum (arrow). H&E, × 40
158 Part IID – Primary Solid Liver Lesions in Non-Cirrhotic Liver
75HCC in Non-Cirrhotic Liver VIII – Vascular Invasion and Satellite Nodules
Vascular invasion occurs frequently in HCC and can affect both the portal and the hepatic veins. In a recent large study of HCC, 15.5 % of cases showed macroscopic and 59.0 % microscopic venous invasion proved on histopathology. In this study, the lesions with vascular invasion were associated with a larger tumor size, a higher  -fe- toprotein level, and less frequent encapsulation. In a meta-analysis of 7 reports with 1497 patients, portal vein invasion was found in 24 % of the cases with HCC. In one study, 10 of 38 patients had an extracapsular invasion. Of these, 9 were detected with MR and only 5 with CT. The presence of extracapsular invasion is one of the factors affecting recurrence after surgery.
Literature
1.Hussain SM, Semelka RC, Mitchell DG (2002) MR imaging of hepatocellular carcinoma. Magn Reson Imaging Clin N Am 10:31 – 52
2.Tsai T-J, Chau G-Y, Lui W-Y, et al. (2000) Clinical significance of microscopic tumor venous invasion in patients with resectable hepatocellular carcinoma. Surgery 127:603 – 608
3.Lee YT, Geer DA (1987) Primary liver cancer: pattern of metastasis. J Surg Oncol 36:26 – 31
4.Imaeda T, Kanematsu M, Mochizuki R, et al. (1994) Extracapsular invasion of small hepatocellular carcinoma: MR and CT findings. JCAT 18:755 – 760
MR Imaging Findings
At MR imaging vascular invasion can be seen as a lack of signal void on multislice T1-weighted gradient echo and flow-compensated T2-weighted fast spin-echo images. On gadolinium-enhanced MR images, the tumor thrombus typically shows enhancement on images acquired during the arterial phase and a filling defect on images acquired during later phases (Figs. 75.1, 75.2). Flow-sensitive sequences as well as black-blood echoplanar imaging may also be used to detect any vascular invasion.
Pathology
Extracapsular extension of tumor, with partial projections or formation of satellite nodules in the immediate vicinity, is present in 43 – 77 % of HCCs (Fig. 75.3).
75 HCC in Non-Cirrhotic Liver VIII – Vascular Invasion and Satellite Nodules 159
Fig. 75.1. HCC, non-cirrhotic liver, large with vascular invasion and a satellite nodule, drawings. T2 fatsat: both HCCs appear brighter than the liver: the larger contains a central scar-like area and the smaller is most likely a satellite nod-
Fig. 75.2. HCC, non-cirrhotic liver, large HCC with vascular invasion and a satellite nodule, MRI findings. A Axial TSE image (T2 fatsat): Both HCCs appear brighter than the liver with sharp margins: the larger contains a central scar-like area and the smaller is most likely a satellite nodule. B Axial in-phase image (T1 in-phase): HCCs are hypointense to the liver. C Axial arterial phase image (ART): HCCs show intense peripheral heterogeneous enhancement. D Axial delayed phase image (DEL): HCCs show washout with capsular en-
ule; T1 in-phase: the lesions are hypointense to the liver; ART: HCCs show intense peripheral heterogeneous enhancement; DEL: HCCs show washout with capsular enhancement
hancement. E Axial fat-suppressed T1 GRE image (T1 fatsat): HCCs are welldemarcated due to fat suppression and good T1-weighting. F Coronal SSTSE image (SSTSE): The smaller lesion is in a subphrenic/subcapsular location in the left liver (arrow). G Coronal delayed phase image (DEL) shows a lessenhanced irregular central scar (arrow). H Coronal delayed phase image (DEL) at a different anatomic level: One of the liver veins shows an extension of the tumor with abnormal enhancement (open arrow)
Fig. 75.3. HCC, direct MR-pathology correlation. A Photograph of the resected tumor specimen shows HCC in a non-cirrhotic liver. B Photomicrograph: HCC is surrounded by a fibrous tumor capsule. H&E, × 40. C Photomicrograph: HCC extends with a tong-like fashion through the capsule (capsule
rupture). H&E, × 40. D Photomicrograph shows two vessels filled with tumor thrombus, which most likely play a role in the formation of satellite nodules. H&E, × 40

160 Part IID – Primary Solid Liver Lesions in Non-Cirrhotic Liver
76HCC in Non-Cirrhotic Liver IX – Adenoma-Like HCC with Pathologic Correlation
Some hepatocellular carcinomas in non-cirrhotic livers of young and middle-aged women may have features of both hepatocellular adenomas (HCAs) and carcinomas (HCCs). These lesions may have transformed from a preexisting HCA. Malignant transformation of HCA into HCC has been described in the literature by several groups. Most authors have reported transformation of an existing HCA into HCC. Gordon et al., however, reported a case of HCC after complete regression of HCA at the same anatomic location. At this point in time, it is not quite clear if all HCAs eventually can transform into HCCs. Also the exact characteristics of HCAs that eventually may undergo malignant transformation are not well known. Tao has recently suggested that HCA is not pre-malignant and may undergo reversible change after withdrawal of OC, whereas LCD is an irreversible, pre-malignant change and will eventually progress to HCC (HCA-LCD-HCC sequence).
Literature
1.Gordon SC, Reddy KR, Livingstone AS, et al. (1986) Resolution of a con- traceptive-steroid-induced hepatic adenoma with subsequent evolution into hepatocellular carcinoma. Ann Intern Med 105:547 – 549
2.Gyorffy EJ, Bredfeldt JE, Black WC (1989) Transformation of hepatic cell adenoma to hepatocellular carcinoma due to oral contraceptive use. Ann Intern Med 110:489 – 490
3.Tao LC (1991) Oral contraceptive-associated liver cell adenoma and hepatocellular carcinoma: cytomorphology and mechanism of malignant transformation. Cancer 68:341 – 347
4.Ferrell LD (1993) Hepatocellular carcinoma arising in a focus of multilobular adenoma: a case report. Am J Surg Pathol 17:525 – 529
5.Foster JH, Berman MM (1994) The malignant transformation of liver cell adenomas. Arch Surg 129:712 – 717
MR Imaging Findings
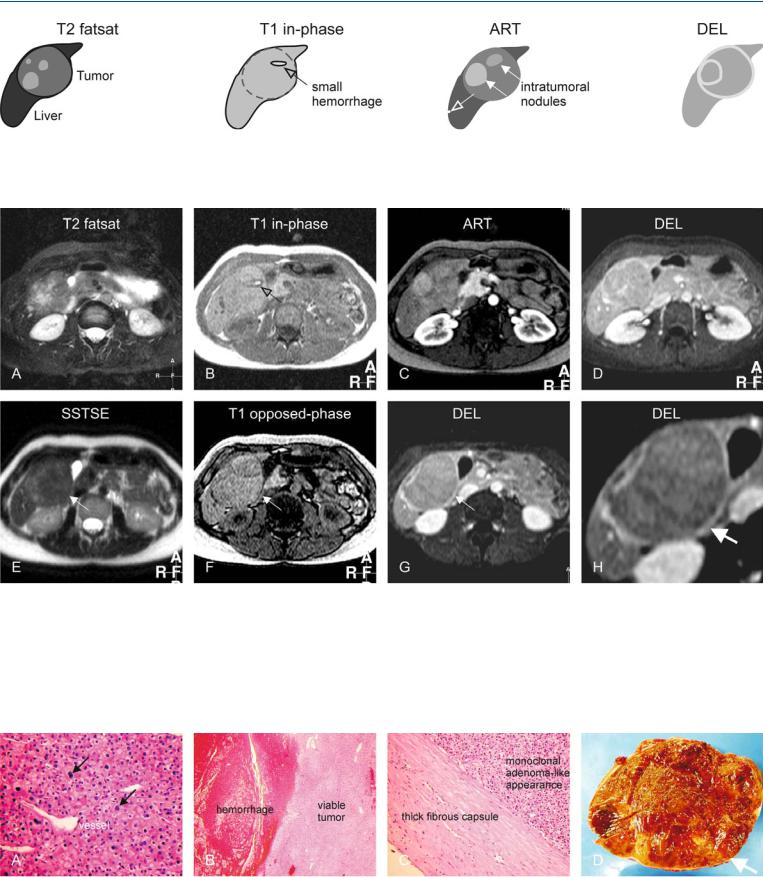
At MR imaging, the lesions occur within a non-cirrhotic liver and appear hyperintense on T2-weighted images and isointense or slightly hyperintense on T1-weighted images. A low signal intensity tumor capsule may surround the lesions. After injection of gadolinium, the lesions show enhancement of intratumoral nodules in the arterial phase, and washout with enhanced tumor capsule in the delayed phase (Figs. 76.1, 76.2).
Pathology
Recently, such a tumor was observed in our institution. Based on the MR imaging findings, an HCC in non-cirrhotic liver was diagnosed and the tumor was resected. The resected specimen was sent to three different pathologists in Europe. Two of them diagnosed the lesion as HCC and the third as HCA (Fig. 75.3). This case illustrates that the diagnoses of primary liver lesions may be challenging not only based on imaging.
76 HCC in Non-Cirrhotic Liver IX – Adenoma-Like HCC with Pathologic Correlation 161
Fig. 76.1. HCC, adenoma-like and mosaic pattern, drawings. T2 fatsat: HCC is largely hyperintense to the liver; T1 in-phase: HCC is isointense to the liver with a darker tumor capsule; ART: HCC shows intralesional nodules with
Fig. 76.2. HCC, non-cirrhotic liver, adenoma-like tumor with capsule and mosaic pattern. A Axial fatsat TSE image (T2 fatsat): Tumor is largely hyperintense to the liver. B Axial in-phase image (T1 in-phase): Tumor is isointense to the liver with a darker tumor capsule and a small hemorrhage (arrow). C Axial arterial phase image (ART): Tumor shows intratumoral nodules with variable enhancement (mosaic pattern). Note also an additional small subcapsular nodule (arrow). D Axial delayed phase image (DEL): Tumor shows enhancement of a tumor capsule. E Axial T2-w SSTSE image with long TE
variable enhancement (solid arrows); note an additional smaller subcapsular nodule (open arrow); DEL: HCC becomes almost isointense with enhancement of tumor capsule as well as intratumoral septa
(SSTSE): Tumor is darker as compared to T2 fat-suppressed image (arrow). F Axial opposed-phase image (T1 opposed-phase): The tumor capsule is slightly better visible than on T1 in-phase image (arrow), probably due to better T1-weighting with shorter TE. G Axial delayed phase image (DEL) at a slightly different anatomic level shows the tumor capsule (arrow). H A detailed view of the previous image shows the tumor anatomy better with an enhancing tumor capsule (arrow)
Fig. 76.3. MR-pathology correlation. A Photomicrograph shows abnormal hepatocytes with variable sized nuclei and some proliferative activity (arrows). Note the increased cellularity and vascularity. H&E, × 200. B Photomicrograph shows the solid tumor and hemorrhage. H&E, × 40. C Photomicrograph shows a thick fibrous capsule that correlates with the MRI findings
(specific sign of HCC). The monoclonal nature though is more suggestive of adenoma. H&E, × 100. D Photograph of the resected specimen shows a large encapsulated tumor with multiple nodules, which is more consistent with HCC