


64 Part IIB – Metastases: Non-Colorectal
30 Neuroendocrine Tumor III – Gastrinoma Liver Metastases
Gastrinomas can occur in the pancreas, stomach, duodenum, and proximal jejunum. About 90 % of these tumors are located within the „gastrinoma triangle,“ which is formed by the junction between the neck and body of the pancreas medially, the second and third portions of the duodenum inferiorly, and the junction of the cystic and common bile ducts superiorly. The tumors produce gastrin and can give rise to ulcers, diarrhea, and reflux (Zollinger-Ellison syndrome). Gastrinomas, relative to insulinomas, are more often extrapancreatic and multiple. They also tend to be even smaller and less vascular than insulinomas. These features make them even more difficult to localize than insulinomas. As many as 60 % of gastrinomas are malignant; 25 % of these tumors are associated with MEN-1, which is more common in the setting of multiple and extrapancreatic tumors. At the time of diagnosis, 30 % of pancreatic tumors and 10 % of duodenal tumors have metastasized. Metastases most commonly involve the lymph nodes and liver.
Literature
1.Kumbasar B, Kamel IR, Tekes A, et al. (2004) Imaging of neuroendocrine tumors: accuracy of helical CT versus SRS. Abdom Imaging 29:696 – 702
2.Noone TC, Hosey J, Firat Z, Semelka RC (2005) Imaging and localization of islet-cell tumours of pancreas on CT and MRI. Best Pract Res Clin Endocrinol Metab 19:195 – 211
3.Semelka RC, Custodio CM, Balci NC, Woosley JT (2000) Neuroendocrine tumors of the pancreas: spectrum of appearances on MRI. J Magn Reson Imaging 11:141 – 148
MR Imaging Findings
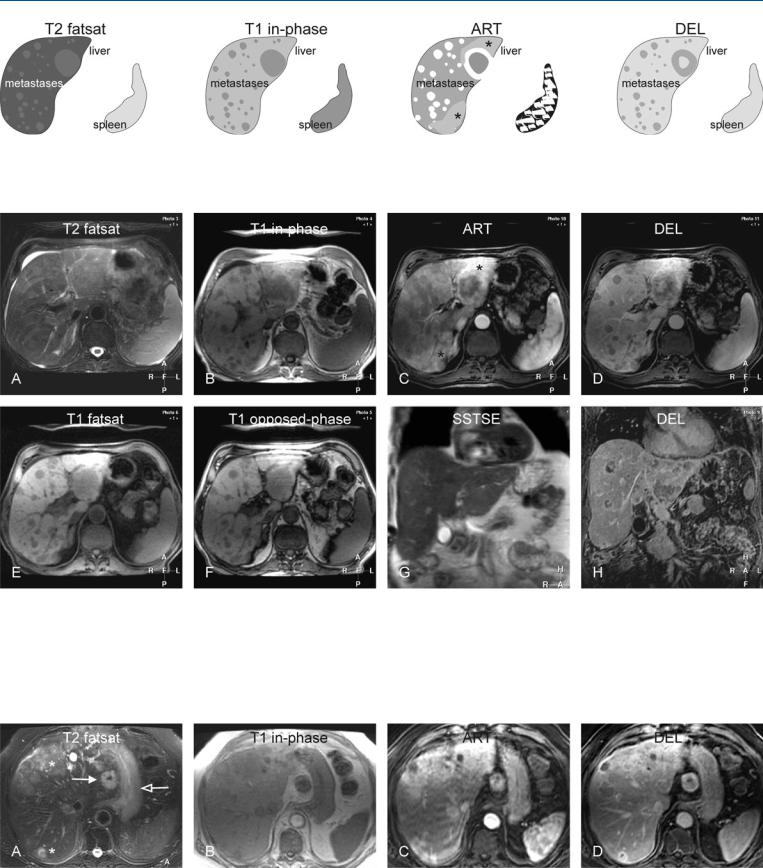
Gastrinoma liver metastases typically appear as multiple liver lesions with somewhat variable signal intensity and size. On T2-weighted imaging, most lesions have high signal intensity compared to the normal liver and comparable signal intensity to the spleen. On the T1-weighted images, the lesions have low signal intensity. After injection of gadolinium, small lesions have almost homogeneous enhancement with varied perifocal enhancement and the larger lesions may have ring-shaped or heterogeneous enhancement in the arterial phase. In the delayed phase, the smaller lesions show complete wash-out whereas the larger lesions may show persistent or even increased enhancement in the central part of the lesions. MR imaging can also show extrahepatic localization, such as nodal involvement. The involved nodes often have a similar appearance to the hepatic metastases (Fig. 30.1 – 30.3).
30 Neuroendocrine Tumor III – Gastrinoma Liver Metastases 65
Fig. 30.1. Metastases, gastrinoma, multiple drawings. T2 fatsat: metastases are variable in size and slightly hyperintense to the liver; T1 in-phase: metastases are hypointense to the liver; ART: larger lesions show irregular ring-
Fig. 30.2. Metastases, gastrinoma, multiple, MRI findings. A Axial TSE image (T2 fatsat): Metastases are variable in size and slightly hyperintense to the liver. Note also ascites. B Axial in-phase image (T1 in-phase): Metastases are hypointense to the liver. C Axial arterial phase image (ART): Larger lesions show irregular ring-shaped and the smaller lesions homogeneous enhancement; note also the parenchymal enhancement (*). D Axial delayed phase image (DEL): Metastases show washout. E Axial fat-suppressed GRE image
shaped and the smaller lesions homogeneous enhancement; note also the parenchymal enhancement (*); DEL: metastases show washout
(T1 fatsat): Metastases show better delineation to the liver due to improved liver-to-lesion contrast. F Axial opposed-phase image (T1 opposed-phase) shows no fatty infiltration. G Coronal SSTSE image (SSTSE) shows irregular contours of the liver suggesting capsular involvement. H Coronal delayed image (DEL) shows multiple metastases with washout and central persistent enhancement
Fig. 30.3. Metastases, gastrinoma, multiple with a large lymph node, MRI findings. A Axial TSE image (T2 fatsat) shows multiple liver metastases (*), a large lymph node (solid arrow), and thickened stomach wall (open arrow).
B Axial in-phase image (T1 in-phase): Metastases are hypointense to the liver. C, D Axial arterial and delayed phase images (ART/DEL): Metastases appear in similar fashion

66 Part IIB – Metastases: Non-Colorectal
31Neuroendocrine Tumor IV – Carcinoid Tumor Liver Metastases
The term „carcinoid“ is used for neuroendocrine tumors (NET) of extrapancreatic origin. Endocrine tumors of the gastrointestinal tract, which are known as carcinoids, originate from the diffuse neuroendocrine cell system. These cells are scattered throughout the mucosa of the GI tract and express neuroendocrine markers such as chromogranin A. Carcinoid tumors can produce serotonin and can cause flushing, diarrhea, and bronchial obstruction (carcinoid syndrome). There are 14 cell types which produce different hormones. Carcinoid tumors show a non-random distribution in the GI tract: stomach (2 – 3 %; recent studies: 11 – 41 %), duodenum and proximal jejunum (22 %), distal jejunum and ileum (23 – 28 %), appendix (19 %), cecum and ascending colon (9 %), and rectosigmoid (20 %). The carcinoid type of tumors is found in up to 55 % of patients with NET and up to 60 % may be malignant with hepatic metastases.
Literature
1.Capella C, Heitz PU, Hofler H, et al. (1995) Revised classification of neuroendocrine tumours of the lung, pancreas and gut. Virchows Arch 425:547 – 560
2.Kloppel G, Anlauf M (2005) Epidemiology, tumor biology and histopathological classification of neuroendocrine tumours of gastrointestinal tract. Clin Gastroenterol 19:507 – 517
3.Touzios JG, Kiely JN, Pitt SC, et al. (2005) Neuroendocrine hepatic metastases: does aggressive management improve survival? Ann Surg 241:776 – 785
4.McGill DB, Rakela J, Zinsmeister AR, et al. (1990) A 21 year experience with major hemorrhage after percutaneous liver biopsy. Gastroenterology 99:1396 – 1400
MR Imaging Findings
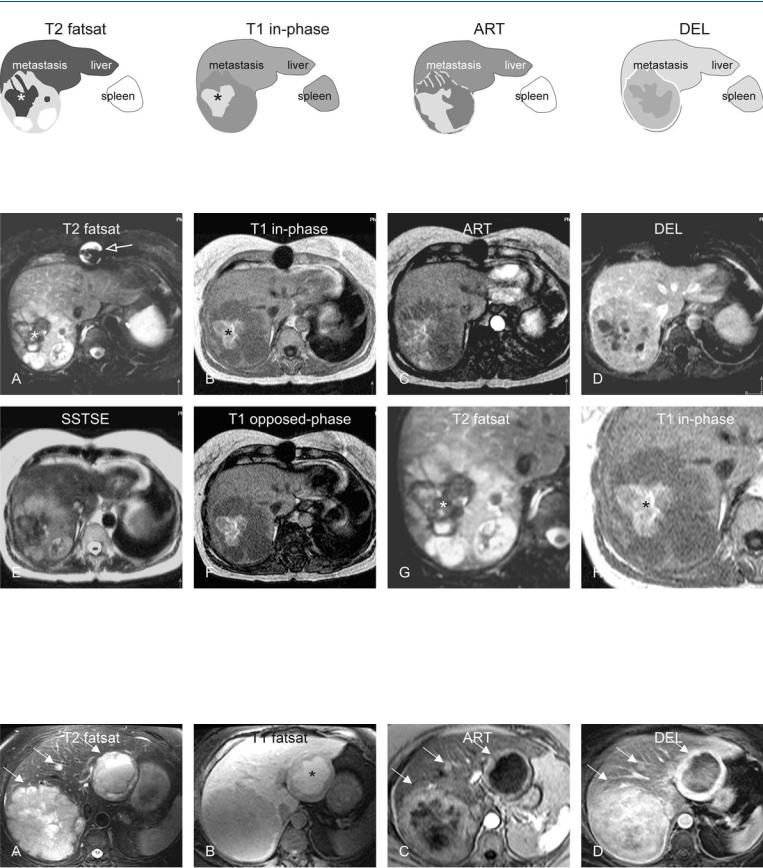
Carcinoid tumor liver metastases may have a variable signal intensity on T1and T2-weighted images. On T2-weighted images lesions may have low signal intensity areas, as well as high signal intensity areas. The low signal intensity areas correspondingly will have high signal intensity on T1-weighted images. These findings are consistent with the presence of hemorrhage or protein content within the lesions. After injection of gadolinium, the lesions show peripheral ring-shaped enhancement in the arterial phase and wash-out in the delayed phase. The lesions may be large in size. The presence of calcifications, which are better appreciated on CT, is a non-specific finding. Relatively large lesions may have cystic components centrally which may be filled with colloid or protein-rich fluid, appearing high on T1-weighted images. Larger tumors also tend to have solid peripheral components with persistent enhancement (Figs. 31.1 – 31.3).
Differential Diagnosis
Hemorrhage and other hemorrhagic tumors should be distinguished based on characteristic MR imaging findings.
31 Neuroendocrine Tumor IV – Carcinoid Tumor Liver Metastases 67
Fig. 31.1. Metastasis, carcinoid with hemorrhage, drawings. T2 fatsat: dark hematoma (*) is located in the center of the metastasis, which is predominantly hyperintense to the liver; T1 in-phase: hematoma shows high signal
Fig. 31.2. Metastasis, carcinoid with hemorrhage, MR findings. A Axial fat-sup- pressed T2-w TSE image (T2 fatsat): Dark hematoma (*) is located in the center of the metastasis, which is predominantly hyperintense to the liver. Artifact caused by the metal wire after sternotomy (open arrow). B Axial inphase image (T1 in-phase): Hematoma shows high signal caused by methemoglobin (*). C Axial GRE image in the arterial phase (ART): Parts of the metastasis show heterogeneous enhancement. D Axial delayed phase (DEL):
caused by methemoglobin (*); ART: parts of the metastasis show heterogeneous enhancement; DEL: peripheral parts of the metastasis show more enhancement than the central hemorrhagic part
The hematoma appears to remain unenhanced. E Axial SSTSE image (SSTSE) shows decreased signal in the solid parts of the metastasis. F Axial opposed-phase image (T1 opposed-phase) shows increased perilesional signal caused by steatotic liver (arrow). G A detailed view of fat-suppressed T2-weighted image (T2 fatsat) shows the central hematoma in more detail
(*). H Axial in-phase image (T1 in-phase) shows the hemorrhage bright (*)
Fig. 31.3. Metastasis (another patient), carcinoid, protein-producing, MRI findings. A Axial TSE (T2 fatsat) shows three carcinoid metastases with variable solid component (arrows). B Axial fat-suppressed T1-w image (T1 fatsat): One of the lesions contains fluid with high signal (*), consistent with high
protein content. C Axial arterial phase image (ART) shows enhancement of mainly the solid parts (arrows). D Axial delayed phase image (DEL) shows persistent enhancement of the solid parts (arrows)