


116 Part IID – Primary Solid Liver Lesions in Non-Cirrhotic Liver
54Focal Nodular Hyperplasia I – Typical with Large Central Scar and Septa
Edmondson introduced the term focal nodular hyperplasia (FNH) in 1958. Currently, FNH is considered a benign, regenerative lesion. FNH is the second most common benign liver tumor after hemangioma and has a reported prevalence of 0.9 %. FNH occurs predominantly in women during their reproductive years. Approximately 20 % of patients have multiple FNHs, which often concur with other benign lesions such as hemangiomas and cysts.
MR Imaging Findings
Typically, FNH is isoor hypointense on T1- (94 – 100 %), slightly hyperor isointense on T2- (94 – 100 %) and with a bright central scar on T2-weighted images (84 %). FNH shows intense homogeneous enhancement in the arterial phase with enhanced central scar and septa in the later phases of the gadolinium-enhanced images (Figs. 54.1, 54.2). FNHs do not have a true tumor capsule, though the pseudocapsule surrounding some of the FNHs may be quite prominent. The central scar is well formed, typically high in signal intensity on T2-weighted images and shows enhancement on delayed contrast-enhanced images. After uptake of Kupffer cellspecific contrast media, central scar and septa may show improved conspicuity (Fig. 54.3A–C).
Literature
1.Hussain SM, Terkivatan T, Zondervan PE, et al. (2004) Focal nodular hyperplasia: a spectrum of findings at state-of-the-art MR imaging, ultrasound, CT and pathology. Radiographics 24:3 – 19
2.Hussain SM, Zondervan PE, Ijzermans JN, et al. (2002) Benign versus malignant hepatic nodules: MR imaging findings with pathologic correlation. Radiographics 22:1023 – 36
3.Terkivatan T, Van den Bos IC, Hussain SM, et al. (2006) Focal nodular hyperplasia: lesion characteristics on state-of-the-art MRI including dynamic gadolinium-enhanced and superparamagnetic iron-oxide-up- take sequences in a prospective study. JMRI 24:864 – 872
Pathology
The gross pathology of FNH is characterized by a network of central scar and septa that contain multiple nodules (macroscopically it resembles „focal cirrhosis“) (Fig. 54.3D).
Management
Asymptomatic FNH does not need any treatment or follow-up.
54 Focal Nodular Hyperplasia I – Typical with Large Central Scar and Septa 117
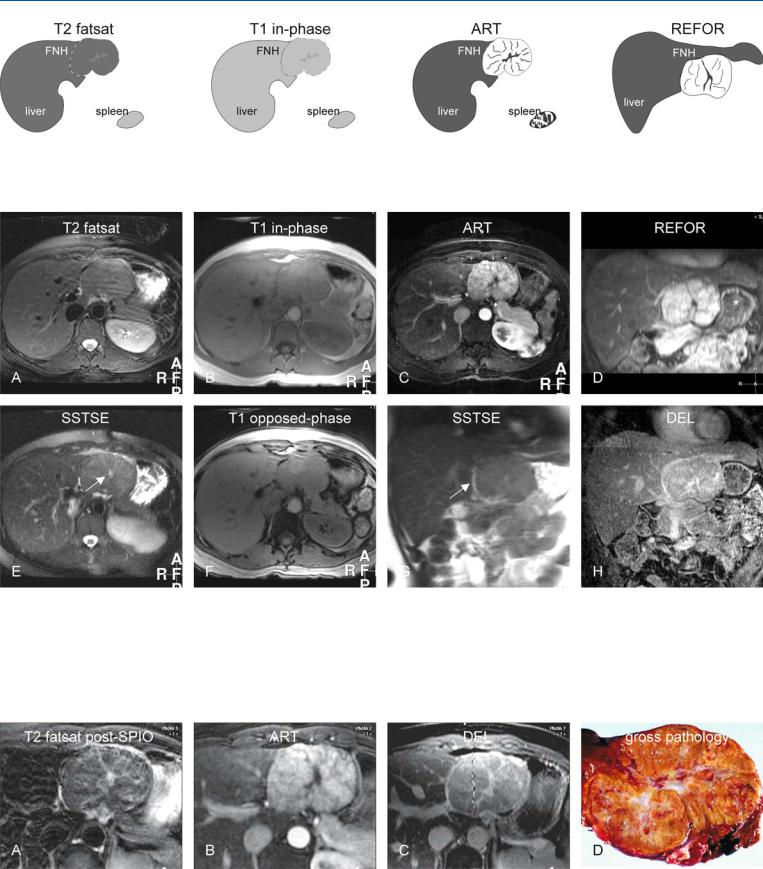
Fig. 54.1. FNH, drawings. T2 fatsat: FNH is isointense to the liver but visible due to the mass effect; T1 in-phase: FNH is isointense to the liver with faintly darker central scar; ART: FNH shows a very intense homogeneous enhance-
Fig. 54.2. FNH, large typical MRI findings at 3.0T. A Axial fat-suppressed turbo spin echo (TSE) image (T2 fatsat): FNH is isointense to the liver but visible due to the mass effect. B Axial in-phase image (T1 in-phase): FNH is isointense to the liver with a faintly darker central scar. C Axial arterial phase image (ART) with high resolution: FNH shows a very intense and homogeneous enhancement with septal and central scar sparing. D Coronal reformat based on the arterial phase image (REFOR): Almost the entire FNH is
ment with septal and central scar sparing; REFOR: coronal reconstruction of the arterial phase image shows the relationship of FNH to liver in a different anatomic orientation
exophytic and causes compression of the stomach (*). E Axial single-shot TSE image (SSTSE) shows the bright central scar (arrow) better than on the T2 fatsat image. F Axial opposed-phase image (T1 opposed-phase): FNH shows no fatty infiltration. G Coronal T2-w SSTSE image (SSTSE): FNH is in part surrounded by a bright pseudocapsule (arrow). H Coronal delayed phase image (DEL): The central scar and the septa are enhanced
Fig. 54.3. FNH (same patient as shown above) and gross pathology (another patient). A Axial fat-suppressed TSE image (T2 fatsat) after uptake of superparamagnetic iron oxide (SPIO) shows signal loss in the liver as well as FNH with improved conspicuity of the septa and the central scar. B Axial arterial phase image (ART) shows the intratumoral enhanced nodules. C Axial de-
layed phase image (DEL) shows the enhanced septa and the central scar in detail. D Photograph of a resected specimen shows nodules interspersed by the central scar and septa. Note the striking similarity with the lesion shown at MRI
118 Part IID – Primary Solid Liver Lesions in Non-Cirrhotic Liver
55Focal Nodular Hyperplasia II – Typical with Pathologic Correlation
Focal nodular hyperplasia is often discovered as an incidental finding on cross-sectional imaging. At ultrasound (US), the lesions may be difficult to characterize. Most radiologists recommend a computed tomography (CT) scan after the initial ultrasound. Despite the recent spectacular technical developments in CT and the introduction of multi-row detector ultra-fast CT, most centers still perform a single phase (usually portal phase) examination after injection of iodine contrast media. On such CTs, hypervascular lesions, such as FNH, cannot be characterized with certainty. Further evaluation is needed either with biopsy or MR imaging.
Literature
1.Nguyen BN, Flejou JF, Terris B, et al. (1999) Focal nodular hyperplasia of the liver. A comprehensive pathologic study of 305 lesions and recognition of new histologic forms. Am J Surg Pathol 23:1441 – 54
2.Hussain SM, Terkivatan T, Zondervan PE, et al. (2004) Focal nodular hyperplasia: a spectrum of findings at state-of-the-art MR imaging, ultrasound, CT and pathology. Radiographics 24:3 – 19
3.Hussain SM, Semelka RC (2005) Hepatic imaging: comparison of modalities. Radiol Clin N Am 43:929 – 947
MR Imaging Findings
Typical FNH may not be well visible on T1-weighted or T2-weight- ed images because of its similarity with the surrounding liver tissue. The only components that may have distinct signal intensity are the central scar and the septa. Particularly, the central scar may be well visible on fat-suppressed T2-weighted images. If the central scar and the septa are not very prominent, FNH shows intense homogeneous enhancement in the arterial phase. The central scar and septa show delayed persistent enhancement (Figs. 55.1, 55.2). The combination of the signal intensity and typical enhancement pattern allow the visualization of the internal tumor anatomy. This allows very accurate diagnosis at MR imaging. Ultrasound lacks the intrinsic soft tissue contrast and therefore often remains inconclusive (Fig. 55.3A).
Pathology
At biopsy, it may be a challenge to diagnose FNH, which is a benign nodule that occurs in a liver that is otherwise histologically normal or nearly normal. Classic FNH is characterized by the presence of
(a) abnormal nodular architecture, (b) malformed appearing vessels, and (c) cholangiolar proliferation. Specific stains may be needed to identify various components of FNH at biopsy (Fig. 55.3B – D). The non-classic FNH lacks one of the following classic features – nodular abnormal architecture or malformed vessels – but always shows bile ductular proliferation.
Management
Typical and asymptomatic FNH do not need any treatment or fol- low-up.
55 Focal Nodular Hyperplasia II – Typical with Pathologic Correlation 119
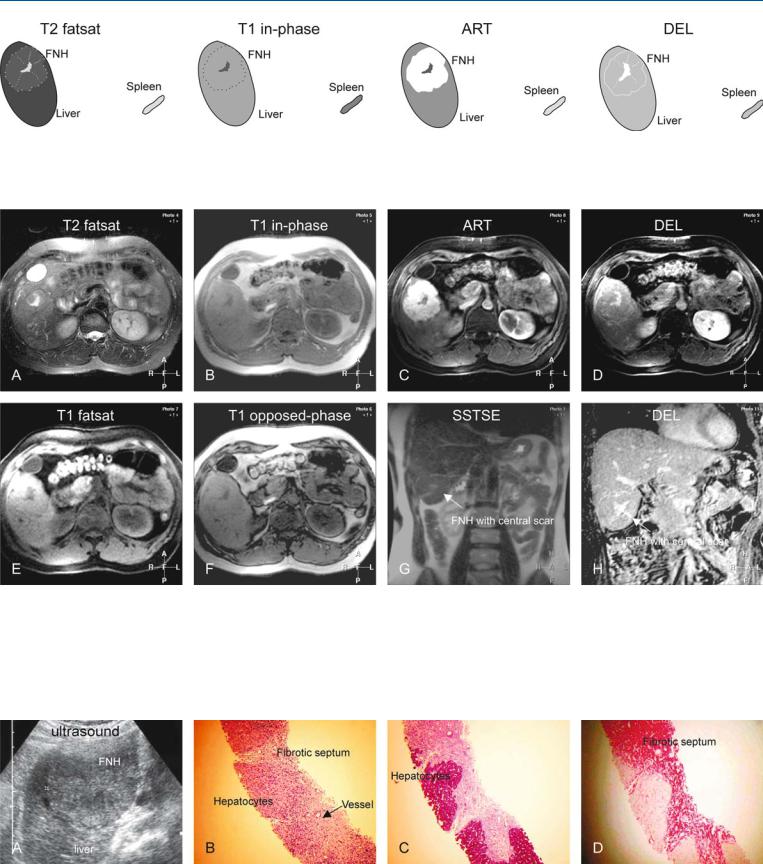
Fig. 55.1. FNH, drawings. T2 fatsat: FNH is slightly hyperintense to the liver with a brighter central scar and septa; T1 in-phase: FNH is isointense to the liver with a darker central scar; ART: FNH shows a very intense homoge-
Fig. 55.2. FNH, typical MRI findings. A Axial fat-saturated T2-w TSE image (T2 fatsat): FNH is isointense to the liver with a brighter central scar. B Axial inphase T1-w gradient recalled echo (GRE) (T1 in-phase): FNH is isointense to the liver with a darker central scar and a thin pseudocapsule. C Axial fatsuppressed arterial phase post-Gd 3D T1-w GRE image (ART): FNH shows very intense and homogeneous enhancement, except the central scar. D Axial delayed phase post-Gd 3D T1-w GRE image (DEL): FNH becomes isoin-
neous enhancement of the entire lesion, except the central scar; DEL: FNH becomes isointense with enhanced central scar, septa, and a pseudocapsule
tense with enhancement of the central scar and the septa. E Axial 2D T1-w GRE image (T1 fatsat) shows the central scar and the pseudocapsule better. F Axial opposed-phase 2D T1-w GRE image (T1 opposed-phase) shows no fatty infiltration either within the liver or in the FNH. G Coronal T2-w SSTSE (SSTSE) shows the FNH with a brighter central scar (arrow). H Coronal delayed phase post-Gd 3D T1-w GRE image (DEL) with high spatial resolution clearly shows the enhanced central scar, the septa, and the pseudocapsule
Fig. 55.3. FNH, ultrasound and MR pathology correlation. A Ultrasound (same patient) shows FNH with similar echogenicity as the liver, without revealing intratumoral morphology. B Photomicrograph of a biopsy shows nodules of FNH surrounded by a septum that contains vessels and inflammatory infil-
trate. H&E, × 100. C Photomicrograph shows the stained hepatocytes within well-defined nodules. PAS stain, × 100. D Photomicrograph shows the stained fibrotic septa. SR stain, × 100

120 Part IID – Primary Solid Liver Lesions in Non-Cirrhotic Liver
56Focal Nodular Hyperplasia III – Typical with Follow-up Examination
The pathogenesis of focal nodular hyperplasia (FNH) is not well understood. Vascular malformation and vascular injury have been suggested as the underlying mechanism. The association with steroids has been denied more recently. FNH is the second most common benign liver tumor after hemangioma and has a reported prevalence of 0.9 %. The male to female ratio is 1: 8 and the tumors occur in relatively young patients. In principle, all benign liver lesions including FNH may show some growth over time. There are only sporadic cases of either increased or deceased size of FNH. We have not observed any FNH with major change in size on state-of- the-art MR imaging during the past 10 years. With any major change in diameter of a presumed FNH, the diagnosis should be doubted.
Literature
1.Wanless IR, Mawdsley C, Adams R (1995) On the pathogenesis of focal nodular hyperplasia of the liver. Hepatology 5:1194 – 1200
2.Mathieu D, Kobeiter H, Maison P, et al. (2000) Oral contraceptive use and focal nodular hyperplasia of the liver. Gastroenterology 118:560 – 564
3.Nguyen BN, Flejou JF, Terris B, et al. (1999) Focal nodular hyperplasia of the liver. A comprehensive pathologic study of 305 lesions and recognition of new histologic forms. Am J Surg Pathol 23:1441 – 1454
MR Imaging Findings
At MR imaging, the hallmarks of FNH are (1) T2-bright, large, wellformed central scar and septa; (2) near isointensity on T1as well as T2-weighted images; (3) intense enhancement in the arterial phase;
(4) fading to isointensity in the delayed phase with enhancement of the central scar and septa; and (5) no significant change in the size of the lesion over time (Figs. 56.1 – 56.3).
Gross Pathology
The classic FNH consists of lobulated contours and parenchyma that is composed of nodules surrounded by radiating fibrous septa originating from a central scar. The central scar contains malformed vascular structures. Among the classic FNHs, one or more macroscopic central scars are present in a majority of cases. The gross appearance of non-classic FNH is heterogeneous and globally resembles adenomas in most cases with vaguely lobulated contours and the lack of a macroscopic central scar in almost all cases.
56 Focal Nodular Hyperplasia III – Typical with Follow-up Examination 121
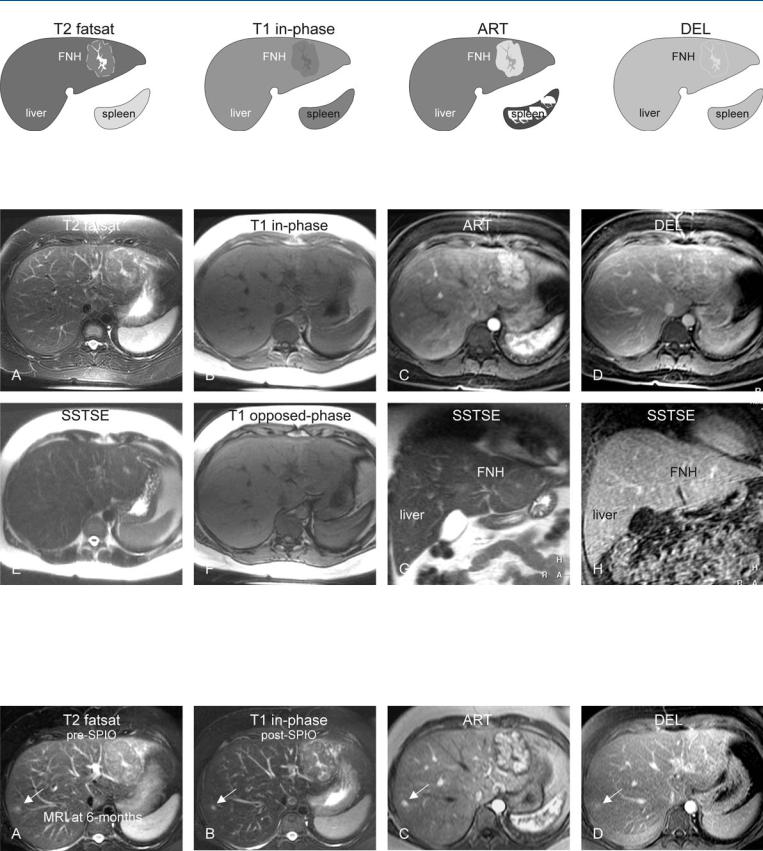
Fig. 56.1. FNH, drawings. T2 fatsat: FNH is slightly hyperintense to the liver with a brighter central scar and septa; T1 in-phase: FNH is slightly hypointense to the liver with a darker central scar; ART: FNH shows a very intense
Fig. 56.2. FNH, typical MRI findings. A Axial fat-suppressed TSE image (T2 fatsat): FNH is slightly hyperintense to the liver with a brighter central scar, septa, and pseudo-capsule. B Axial in-phase image (T1 in-phase): FNH is slightly hypointense to the liver with a darker central scar. C Axial arterial phase image (ART): FNH shows very intense and homogeneous enhancement, except the central scar and the septa. D Axial delayed phase image
homogeneous enhancement of the entire lesion, except the central scar; DEL: FNH becomes isointense with enhanced central scar, septa, and a pseudocapsule
(DEL): FNH becomes isointense with enhancement of the central scar and septa. E Axial SSTSE image (SSTSE) shows the bright central scar in the lesion. F Axial opposed-phase image (T1 opposed-phase) shows no fatty infiltration. G Coronal SSTSE (SSTSE) shows the FNH with a brighter central scar (arrow). H Coronal delayed phase image (DEL) shows the enhanced central scar
Fig. 56.3. FNH, 6 months follow-up MRI findings. A Axial TSE image (T2 fatsat) prior to SPIO uptake: FNH is unchanged. Note an additional smaller lesion (arrow). B Axial TSE image (T2 fatsat) after SPIO uptake: FNH, the liver, the spleen, and the small lesion (arrow) show decreased signal and hence con-
tain Kupffer cells. C Axial arterial phase image (ART): FNH and the small lesion (arrow) show similar enhancement. D Axial delayed phase image (DEL) shows no change. In retrospect, the smaller lesion (arrow) was also present on the previous MRI