


60 Part IIB – Metastases: Non-Colorectal
28 Neuroendocrine Tumor I – Typical Liver Metastases
Neuroendocrine cells, which are present throughout the gastrointestinal (GI) tract, the pancreas, and the lungs, can give rise to a variety of tumors. Tumors that arise in the GI tract are called „neuroendocrine tumors“ (NET) or „carcinoids“ and tumors from the pancreas are called „islet cell tumors.“ The latter include insulinoma, gastrinoma, glucagonoma, vasoactive intestinal peptide-pro- ducing tumor (VIPoma), and somatostatinoma. The incidence of all NET has been estimated to be 2.0/100,000 for men and 2.4/100,000 for women. Etiology is unknown. Tumors may present with clinical symptoms and/or lymph node and liver metastases. The primary may be small and difficult to locate. The single most important predictor of poor survival in patients with neuroendocrine tumors is hepatic metastases. The extent of liver metastases correlates with the subsequent survival. For instance, patients without any liver metastases of gastrinomas have a 5-year survival of 95 %, and with numerous bilobar metastases this figures drops to only 15 %. Patients may present with liver metastases with an unknown primary.
Literature
1.Capella C, Heitz PU, Hofler H, et al. (1995) Revised classification of neuroendocrine tumours of the lung, pancreas and gut. Virchows Arch 425:547 – 560
2.Hemminki K, Li X (2001) Incidence trends and risk factors of carcinoid tumors. A nationwide epidemiologic study from Sweden. Cancer 92:2204 – 2210
3.Kloppel G, Anlauf M (2005) Epidemiology, tumor biology and histopathological classification of neuroendocrine tumours of gastrointestinal tract. Clin Gastroenterol 19:507 – 517
MR Imaging Findings
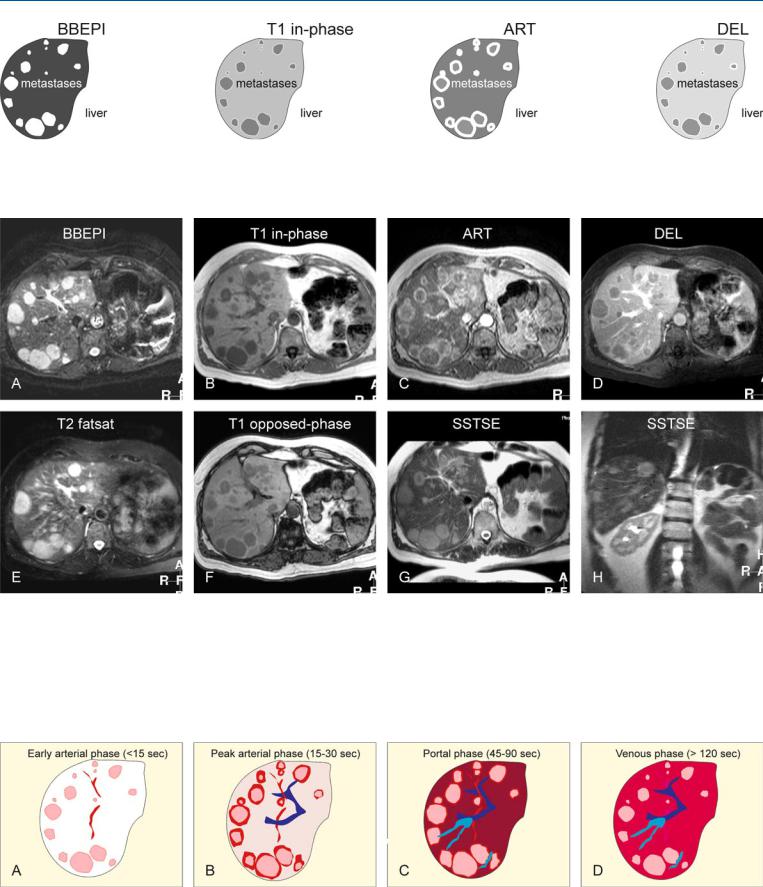
At MR imaging, the liver metastases of neuroendocrine tumors are typically multiple (> 5 lesions), relatively small (a few centimeters in diameter), similar in size with sharp margins to the liver, and predominantly very bright (with almost fluid-like signal intensity) on T2-weighted images. At T1-weighted images, the appearance is often unremarkable (low signal intensity compared to spleen). On gadolinium-enhanced images, the lesions show irregular ringshaped or heterogeneous enhancement in the arterial phase and washout of contrast in the delayed phase images without any evidence of perilesional capsular enhancement (Figs. 28.1 – 28.3).
Differential Diagnosis
Other primary or secondary hypervascular liver lesions form the differential. To distinguish between NET and other types of liver metastases, an additional somatostatin-receptor scintigraphy (SRS) scan or a US-guided biopsy may be helpful.
Management
Management is often tailored and may include one or a combination of the following: surgical (curative or debulking), chemotherapy, and biotherapy (somatostatin analogues).
28 Neuroendocrine Tumor I – Typical Liver Metastases 61
Fig. 28.1. Metastases, neuroendocrine, multiple, drawings. BBEPI: metastases are very bright to the liver; T1 in-phase: metastases are hypointense to the liver; ART: metastases show an intense irregular ring-shaped as well as peri-
Fig. 28.2. Metastasis, neuroendocrine, multiple, MRI findings. A Axial blackblood echoplanar imaging (BBEPI) image: Metastases are very bright to the liver. B Axial in-phase T1-w GRE (T1 in-phase): Metastases are hypointense to the liver. C Axial arterial phase image (ART): Metastases show an intense irregular ring-shaped as well as a perilesional enhancement. D Axial delayed phase image (DEL): Metastases show washout of contrast, without any capsular enhancement. E Axial TSE image (T2 fatsat): Metastases are very bright to the liver, mimicking non-solid lesions such as cysts or hemangio-
lesional enhancement; DEL: metastases show washout without any prominent capsular enhancement
mas. F Axial opposed-phase image (T1 opposed-phase) shows slight signal drop in the liver indicating subtle steatosis. Note that metastases are surrounded by persistent high perifocal signal due to compressed liver. G Axial SSTSE image (SSTSE) shows the metastases as bright lesions, but much less brighter than fluid (e.g., in the spinal canal). H Coronal SSTSE image (SSTSE) with a longer TE shows that the metastases become darker, further indicating their solid nature
Fig. 28.3. Metastases, neuroendocrine, the enhancement pattern. A Early arterial phase: faint ring-shaped enhancement of metastases; no enhancement of the liver. B Peak arterial phase: Metastases show intense ring-shaped as well as perilesional enhancement; the liver shows 25 – 30 % of the peak enhance-
ment. C Portal phase: The liver shows the peak enhancement; the metastases show less perilesional enhancement. The liver veins are enhanced. D Venous phase: The lesions show washout without any capsular enhancement. Tissues show homogeneous enhancement

62 Part IIB – Metastases: Non-Colorectal
29 Neuroendocrine Tumor II – Pancreas Tumor Metastases
The tumors arising from the pancreas may comprise up to 45 % of all neuroendocrine tumors and about 40 % may be malignant with liver metastases. Of these, the majority are non-functioning tumors. Insulinomas are the most common pancreatic NET. They are usually small and solitary and 90 % are located within the pancreas; only 6 – 10 % of insulinomas are malignant. Multiple tumors present in 10 % of cases and may be associated with multiple endocrine neoplasia type 1 (MEN-1). In malignant tumors, all patients will have liver metastases.
Literature
1.Capella C, Heitz PU, Hofler H, et al. (1995) Revised classification of neuroendocrine tumours of the lung, pancreas and gut. Virchows Arch 425:547 – 560
2.Kloppel G, Anlauf M (2005) Epidemiology, tumor biology and histopathological classification of neuroendocrine tumours of gastrointestinal tract. Clin Gastroenterol 19:507 – 517
3.Touzios JG, Kiely JN, Pitt SC, et al. (2005) Neuroendocrine hepatic metastases: does aggressive management improve survival? Ann Surg 241:776 – 785
MR Imaging Findings
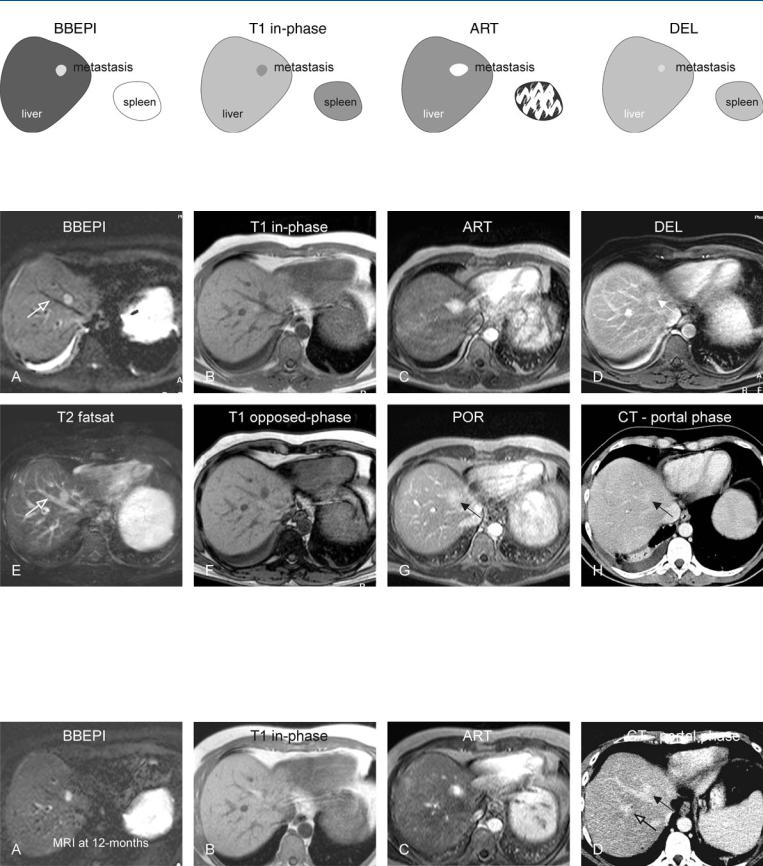
At MR imaging, neuroendocrine tumor metastases from pancreas tumor are often small, and appear hyperintense on T2-weighted images and low signal intensity on T1 images. After injection of gadolinium, lesions show intense homogeneous or ring shaped enhancement with variable perifocal enhancement. In the delayed phase, the lesions show washout and become heterogeneous. At CT, the lesions may be less conspicuous because CT is performed as a single-phase study due to radiation issues. For this reason CT may not be a suitable technique for follow-up of such lesions (Figs. 29.1 – 29.3).
Management
Hepatic metastases treatment may include (1) primary tumor resection, (2) resection in combination with ablation, (3) transarterial chemoembolization, and (4) medical therapies including somatostatin analogues, radiation, and systemic chemotherapy. Surgical resection of neuroendocrine hepatic metastases is a proven treatment of symptoms related to systemic hormone release. Advances in operative techniques and equipment have made hepatic resections safer, especially in tertiary, high-volume centers. Although the neuroendocrine tumors are frequently characterized by an indolent course, historic controls with hepatic metastases without resection or ablation have a much-reduced 5-year survival, which varies from 20 % to 30 %. Recently, several groups have reported an improved 5-year survival of 50 – 70 % with resection of neuroendocrine hepatic metastases.
29 Neuroendocrine Tumor II – Pancreas Tumor Metastases 63
Fig. 29.1. Metastasis, neuroendocrine pancreas tumor metastasis, before octreotide treatment, drawings. BBEPI: metastasis is hyperintense to the liver; T1 in-phase: metastasis is hypointense to the liver; ART: metastasis shows
Fig. 29.2. Metastasis, neuroendocrine pancreas tumor metastasis, before octreotide treatment, MRI findings. A Axial BBEPI image (BBEPI): Metastasis is hyperintense to the liver. The conspicuity of the lesion is improved due to dark vessels (open arrow). B Axial in-phase image (T1 in-phase): Metastasis is hypointense to the liver. C Axial arterial phase image (ART): Metastasis shows intense homogeneous and perilesional enhancement, and therefore appears larger. D Axial delayed phase image (DEL): Metastasis shows washout with
intense homogeneous and perilesional enhancement; DEL: metastasis shows washout with some persistent enhancement
some persistent enhancement. E Axial TSE image (T2 fatsat): Metastasis has a similar appearance to some of the in-plane bright vessels (open arrow), and hence lesser conspicuity than on the BBEPI image. F Axial opposedphase image (T1 opposed-phase) shows no steatosis. G Axial portal phase image (POR): The metastasis (arrow) is difficult to appreciate because of the washout of contrast. H Axial CT in portal phase: The metastasis (arrow) appears almost isodense to the liver and is difficult to appreciate
Fig. 29.3. Metastasis, neuroendocrine pancreas tumor metastasis, 12 months fol- low-up after octreotide treatment, MRI findings. A Axial BBEPI image (BBEPI): Metastasis has decreased in size. B Axial in-phase image (T1 in-phase): Metastasis is difficult to see due to its smaller size. C Axial arterial phase image
(ART): Metastasis shows less intense enhancement compared to the previous MRI. D Axial CT in portal phase: Due to decreased size and vascularity, the metastasis is even more difficult to assess than the previous CT. Also it is difficult to distinguish from some of the vessels (open arrow)