


56 Part IIB – Metastases: Non-Colorectal
26 Melanoma Liver Metastases I – Focal Type
Malignant melanoma of the uvea is the second most common type of primary malignant melanoma in humans and is remarkable for its purely hematogenous dissemination and its tendency to metastasize to the liver. Traditionally, hepatic metastases are initially present in 40 – 60 % of patients. Eventually, the liver is involved in up to 95 % of patients. Fifty percent of patients also have developed extrahepatic metastases which occur often in the lungs, bone, skin, and brain. Delayed dissemination is rather frequent, and the propensity for late hepatic metastasis of uveal melanoma has been designated one of the most unusual phenomena in tumor biology. There is no consensus about screening of patients who have uveal melanoma and have suspected hepatic metastases. US has a sensitivity of only 37 %; this is lower compared to CT. Particularly MR imaging is highly sensitive and specific for melanoma liver metastases.
Literature
1.Eskelin S, Pyrhönen S, Summanen P, et al. (1999) Screening for metastatic malignant melanoma of the uvea revisited. Cancer 85:1151 – 1159
2.Middleton WD, Hiskes SK, Tefey SA, Vousher LD (1997) Small (1.5 cm or less) liver metastases: US-guided biopsy. Radiology 205:729 – 732
3.Hussain SM, Semelka RC (2005) Hepatic imaging: comparison of modalities. Radiol Clin N Am 43:929 – 947
MR Imaging Findings
MR imaging displays high signal intensity in the larger lesions on T2-weighted images. The smaller lesions may appear isointense. On T1-weighted images and especially on fat suppressed T1-weighted images, the melanin-containing metastases have high signal intensity. After injection of gadolinium in the arterial phase, melanoma metastases show intense enhancement. In the delayed phase, the lesions show wash-out and the larger lesions will become heterogeneous whereas smaller lesions may fade to isointensity. Ultrasound and CT are often non-specific (Figs. 26.1, 26.2). Melanoma metastases can show rapid interval growth (doubling time around 3 months). At laparoscopy and biopsy, the melanin typically appears dark.
Differential Diagnosis
Melanin-containing liver lesions (high signal on T1-weighted images) that show enhancement in the arterial phase after injection of gadolinium in a patient with an underlying uveal melanoma have no differential diagnosis. Other hypervascular liver lesions should be considered in the differential of non-melanotic liver metastases.
26 Melanoma Liver Metastases I – Focal Type 57
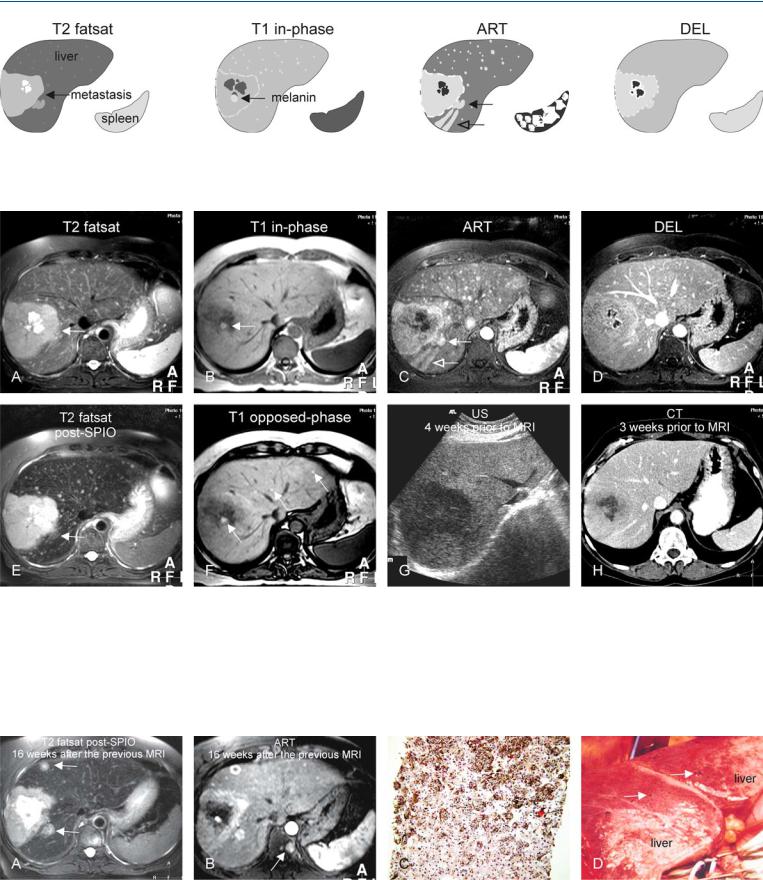
Fig. 26.1. Melanoma metastases, focal, drawings. T2 fatsat: a large lesion (arrow) with central necrosis is visible. The smaller lesions are difficult to see. T1 in-phase: a brighter area (arrow) indicates the presence of melanin; ART:
Fig. 26.2. Melanoma metastases, focal, melanotic, MRI findings. A Axial fatsat T2-w TSE image (T2 fatsat): Large melanoma metastasis (arrow) contains central necrosis. B Axial in-phase T1-w GRE (T1 in-phase): The large metastasis contains melanin with high signal (arrow). C Axial arterial phase image (ART): Larger metastasis shows intense irregular ring-shaped enhancement with multiple enhancing smaller metastases in the entire liver. Note also lesions (solid arrow) with wedge-shaped enhancement (open arrow). D Axial delayed phase image (DEL): Metastases become isointense and are difficult
numerous smaller and larger lesions show intense enhancement. Note two lesions (solid arrow) with wedge-shaped enhancement (open arrow). DEL: most lesions show washout and become isointense
to recognize. E Axial T2-w post-superparamagnetic iron oxide (SPIO) (T2 fatsat post-SPIO): Note the improved conspicuity of the larger as well as the smaller lesions (arrow). F Axial opposed-phase GRE image (T1 opposedphase): The high signal of the metastases is caused by the paramagnetic effect of melanin (arrows). G Ultrasound shows only the larger lesion. H Computed tomography in the portal phase only shows the larger lesion. The findings are comparable to the delayed phase MR image in D
Fig. 26.3. Melanoma metastases, focal, direct MR pathology correlation. A Fatsuppressed T2-w TSE image after SPIO shows interval increase in size of the hepatic metastases (arrows). B Arterial phase image shows irregular ringshaped and heterogeneous enhancement of the hepatic metastases as well as
a new bone metastasis (arrow). C Photomicrograph shows melanin-contain- ing hepatocytes (parenchymal spread). H&E, × 100. D Laparoscopic photograph shows dark, melanin-containing capsular lesions (arrows)
58 Part IIB – Metastases: Non-Colorectal
27 Melanoma Liver Metastases II – Diffuse Type
Melanoma liver metastases can be diffused and may even be more difficult to recognize on ultrasound and CT. Diffuse metastases of liver may mimic subtle changes of vascularity and may have little to no contrast to the background and may appear as insignificant findings. In addition, techniques such as fluorodeoxyglucose-posi- tron emission tomography (FDG-PET) may be negative in such cases. MR imaging can provide specific diagnosis by demonstrating the presence of melanin on T1-weighted images. In such cases, the extrahepatic disease may also be present, which can be evaluated with MR imaging as well. Therefore, MR imaging should be the modality of choice with suspected melanoma liver metastases.
Literature
1.Eskelin S, Pyrhönen S, Summanen P, et al. (1999) Screening for metastatic malignant melanoma of the uvea revisited. Cancer 85:1151 – 1159
2.Alexander HR, Libutti SK, Pingpank JF, et al. (2003) Hyperthermic isolated hepatic perfusion with (IHP) using melphalan for patients with popular melanoma metastatic to liver. Clin Cancer Res 9:6343 – 6349
3.Grover A, Alexander HR (2004) The past decade of experience with isolated hepatic perfusion. Oncologist 9:653 – 664
MR Imaging Findings
MR imaging of melanoma metastases that present as diffused lesions show a heterogeneous and increased signal intensity of the entire liver on T2-weighted images. On T1-weighted images, the high signal intensity of diffuse melanoma metastases may be unremarkable because it may overlap with the normal high signal intensity of the liver, although after injection of gadolinium very intense heterogeneous enhancement of almost the entire liver will be present which may be persistent in the later phases. There may be some free fluid surrounding the liver. In such cases, CT and FDG-PET may be inconclusive. The findings may remain undetected or may be described as vascular abnormalities and the diagnosis may remain obscured (Figs. 27.1 – 27.3).
Management
Isolated hepatic perfusion particularly with tumor necrosis factor and melphalan appears to be an effective treatment for unresectable hepatic malignancies including melanoma metastases.
27 Melanoma Liver Metastases II – Diffuse Type 59
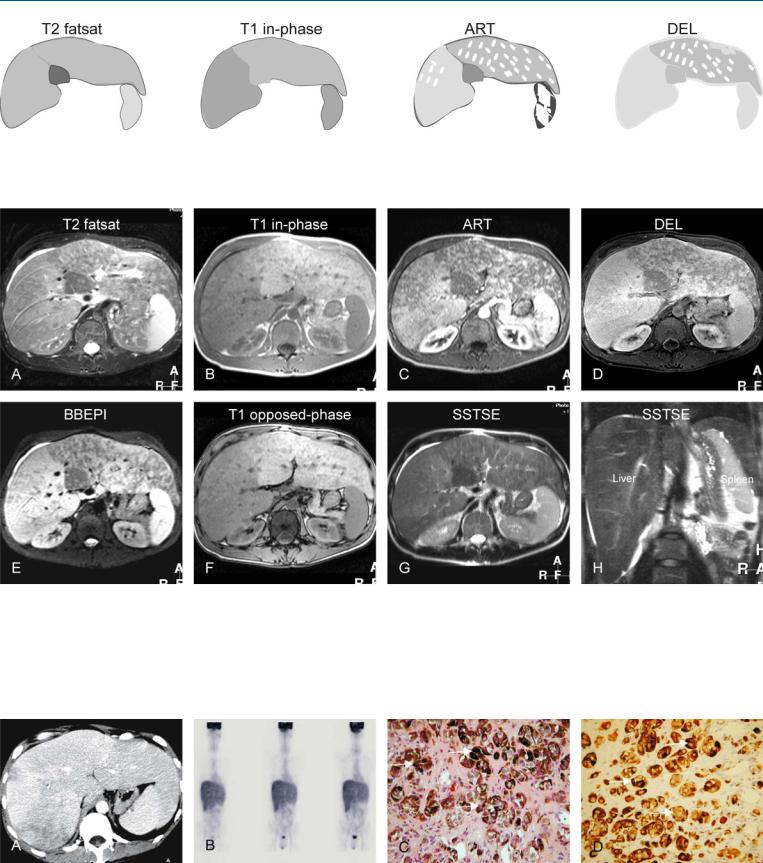
Fig. 27.1. Melanoma metastases, diffuse, drawings. T2 fatsat: melanoma metastases have caused a diffuse increased signal of the liver except in the caudate lobe; T1 in-phase: the right liver has abnormally decreased signal; ART:
Fig. 27.2. Melanoma metastases, diffuse, MRI findings. A Axial fatsat T2-w TSE image (T2 fatsat): Melanoma metastases have caused a diffuse increased signal of the liver except in the caudate lobe. B Axial in-phase T1-w GRE (T1 inphase): The liver shows abnormally decreased signal on the right side of the liver. C Axial arterial phase post-Gd 2D T1-w GRE image (ART): The liver shows diffuse and patchy abnormal enhancement in almost the entire liver. D Axial delayed post-Gd 3D GRE image (DEL): The left liver retains its
the liver shows diffuse and patchy abnormal enhancement in almost the entire liver; DEL: the left liver retains its patchy enhancement
patchy enhancement, whereas the right liver has abnormally increased enhancement. E Axial T2-w black-blood echoplanar image (BB-EPI): The right side of the liver has a higher signal than the left side. F Axial opposed-phase T1-w GRE image (T1 opposed-phase): The liver shows no signs of fatty infiltration. G Axial T2-w SSTSE image (SSTSE axial): The liver is surrounded by a small amount of ascites. H Coronal T2-w SSTSE image (SSTSE coronal): The liver is clearly enlarged and has an abnormally high signal
Fig. 27.3. Melanoma metastases, diffuse, CT, FDG-PET, and MR-pathology correlation. A Contrast-enhanced CT in portal phase (prior to MR) showed „vascular abnormalities“. B FDG-PET (after CT and prior to MRI) showed normal activity in the liver without any evidence of metastases. C Photomicrograph
of the liver biopsy shows diffuse sinusoidal infiltration of melanin-contain- ing tumor cells (arrows). H&E, × 200. D Photomicrograph shows abundant specific immunohistochemical staining of the melanin-containing cells (arrows). Melan-A, × 200