


122 Part IID – Primary Solid Liver Lesions in Non-Cirrhotic Liver
57 Focal Nodular Hyperplasia IV – Multiple FNH Syndrome
Multiple focal nodular hyperplasia (FNH) occurs in approximately 20 – 25 % of patients with FNH. Multiple FNH syndrome consists of at least two FNH lesions and one or more of the following associated lesions: liver hemangioma, central nervous system vascular malformation, meningioma and astrocytoma. An incomplete expression is considered if FNH is seen with only one of the mentioned associated lesions. These patients may be symptomatic and frequently show abnormal liver function tests. Differentiation from multiple hepatocellular adenomas (HCAs) and multifocal hepatocellular carcinomas (HCCs) may be challenging. FNH may have a pseudocapsule composed of compressed parenchyma, perilesional vessels and inflammation. True fibrotic tumor capsule is a characteristic sign of HCC and is present in 60 – 80 % of cases. The enhancement of HCA overlaps with FNH, but HCAs do not have a central scar and the majority of them contain fat.
Literature
1.Finley A, Hosey J, Noone T, et al. (2005) Multiple focal nodular hyperplasia syndrome: diagnosis with dynamic, gadolinium-enhanced MRI. MRM 23:511 – 513
2.Hussain SM, Terkivatan T, Zondervan PE, et al. (2004) Focal nodular hyperplasia: a spectrum of findings at state-of-the-art MR imaging, ultrasound, CT and pathology. Radiographics 24:3 – 19
3.Hussain SM, Zondervan PE, Ijzermans JN, et al. (2002) Benign versus malignant hepatic nodules: MR imaging findings with pathologic correlation. Radiographics 22:1023 – 1036
4.Elsayes KM, Narra VR, Yin Y, et al. (2005) Focal hepatic lesions: diagnostic value of enhancement pattern approach with contrast-enhanced 3D gradient-echo MR imaging. Radiographics 25:1299 – 1320
MR Imaging Findings
At MR imaging, FNH should have (1) near isointensity on T1and T2-weighted images, (2) intense enhancement in the arterial phase, and (3) fading to isointensity with enhancement of the central scar and septa in the delayed phase. In fatty liver, the pseudocapsule may be composed of a compressed non-fatty rim of hepatic parenchyma on opposed-phase images. The amount of scar tissue and the size of the central scar within FNH may vary. The central scar is typically high in signal intensity on T2-weighted and low in signal intensity on T1-weighted images. Multiple lesions often have concurrent hemangiomas and cysts (Figs. 57.1, 57.2).
Pathology
Multiple FNHs are histologically identical to the solitary type. At histology, FNH is composed of small nodules of normal hepatocytes surrounded by a network of capillaries and septa. The hepatic plates may be moderately thickened (two or three cells in thickness). The central scar contains fibrous connective tissue, cholangiolar proliferation with the surrounding inflammatory infiltrates, and malformed tortuous arteries with thickened walls, capillaries, and veins (Fig. 57.3). FNHs contain Kupffer cells.
57 Focal Nodular Hyperplasia IV – Multiple FNH Syndrome 123
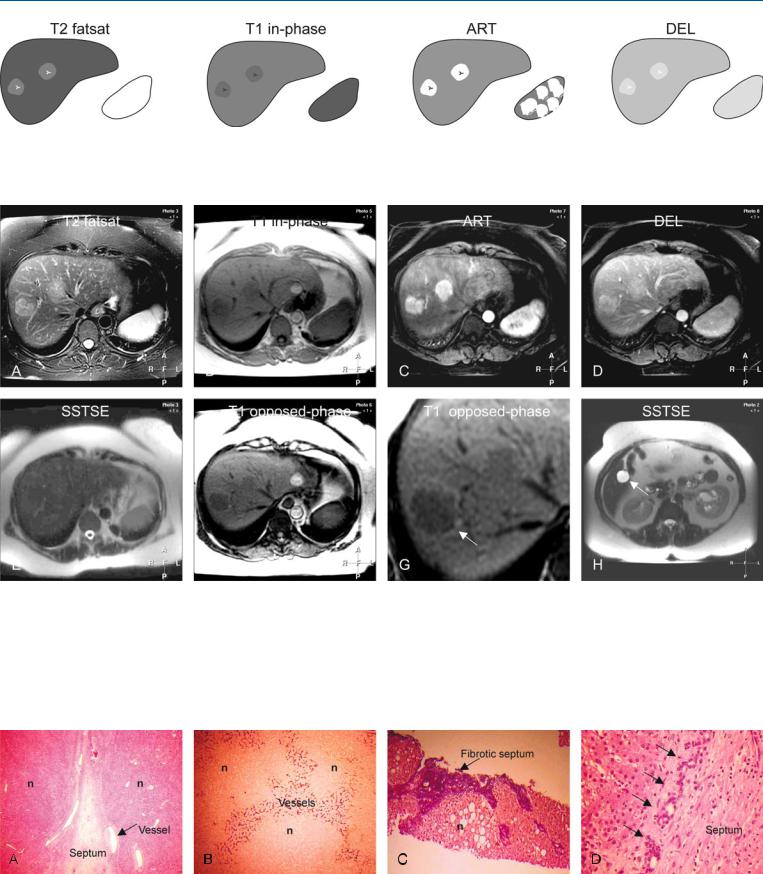
Fig. 57.1. FNH, multiple, fat containing in a fatty liver, schematic drawings.
T2 fatsat: both FNHs are slightly hyperintense to the liver with brighter central scars; T1 in-phase: both FNHs are slightly hypointense to the liver;
Fig. 57.2. FNH, multiple, fat containing in a fatty liver, MRI findings. A Axial fatsuppressed T2-w TSE image (T2 fatsat): both FNHs are slightly hyperintense to the liver with brighter central scars. B Axial in-phase image (T1 in-phase): FNHs are slightly hypointense to the liver. C Axial arterial phase image (ART): FNHs show very intense and homogeneous enhancement. D Axial delayed phase image (DEL): FNHs become almost isointense with enhancement of the central scars. E Axial SSTSE with an echo time (TE) of 120 ms (T2 longer than TE): both lesions are isointense to the liver. F Axial opposed-
ART: both FNHs show very intense homogeneous enhancement; DEL: both FNHs become almost isointense with enhancement of the central scars
phase image (T1 opposed-phase): FNHs as well as the liver decrease the signal compared to the in-phase image due to some fatty infiltration. Note the perilesional rim of high signal intensity (arrow) caused by compressed liver parenchyma (pseudocapsule). G A detailed view of the axial opposed-phase image (T1 opposed-phase) shows the pseudocapsule better (arrow). H Axial SSTSE image (SSTSE) at a lower anatomic level shows a coincidental cyst (arrow) that is very bright (fluid-like) compared to the liver
Fig. 57.3. FNH, MR pathology correlation. A Photomicrograph shows FNH nodules (n) separated by a septum and large vessels (arrow). H&E × 100. B Photomicrograph shows nodules (n) surrounded by an extensive network of vessels. CD34 stain, × 10. C Photomicrograph shows fibrotic septa around
nodules (n) with fatty infiltration. Elastica-von Giesen stain, × 4. D Photomicrograph shows bile duct proliferation (arrows) within a septum, a classic finding of FNH. H&E stain, × 200

124 Part IID – Primary Solid Liver Lesions in Non-Cirrhotic Liver
58Focal Nodular Hyperplasia V – Fatty FNH with Concurrent Fatty Adenoma
Focal nodular hyperplasia (FNH) is a common benign liver lesion and may concur with other benign or malignant liver lesions including hepatocellular adenoma (HCA). It is important to distinguish between FNH and HCA. HCA is considered a premalignant lesion which is associated with risk of life-threatening hemorrhage. In some patients, HCA may show an oral contraceptive (OC)-de- pendent change in diameter. FNH is a benign lesion which is not OC dependent. HCA does not need follow-up or treatment in the majority of cases.
MR Imaging Findings
At MR imaging, FNH and HCA share several similarities: (1) the lesions are nearly isointense on T1and T2-weighted images; and (2) both entities show intense enhancement in the arterial phase and fade to near isointensity in the delayed phase. There are however a number of differences: (1) FNHs are more often isointense or hypointense whereas HCAs are more often hyperintense on the pre-con- trast T1-weighted images; (2) FNHs show a central scar and septa in most cases whereas HCAs lack these; (3) FNHs may display evidence of fat on imaging in about 6 % of cases whereas HCAs contain fat in up to 78 % of cases; (4) FNHs show more intense enhancement with central scar and septal sparing whereas HCAs show less intense and more homogeneous enhancement; and (5) FNHs do not show any change in size or appearance after stopping the OC whereas OC-dependent HCAs become smaller after cessation of OC (Figs. 58.1 – 58.3).
Literature
1.Edmondson HA, Henderson B, Benton B (1976) Liver-cell adenomas associated with use of oral contraceptives. N Engl J Med 294:470 – 472
2.Gordon SC, Reddy KR, Livingstone AS, et al. (1986) Resolution of a con- traceptive-steroid-induced hepatic adenoma with subsequent evolution into hepatocellular carcinoma. Ann Intern Med 105:547 – 549
3.Terkivatan T, Van den Bos IC, Hussain SM, et al. (2006) Focal nodular hyperplasia: lesion characteristics on state-of-the-art MRI including dynamic gadolinium-enhanced and superparamagnetic iron-oxide-uptake sequences in a prospective study. JMRI 24:864 – 872
4.Hussain SM, Van den Bos IC, Dwarkasing S, et al. (2006) Hepatocellular adenoma: findings at state-of-the-art magnetic resonance imaging, ultrasound, computed tomography and pathologic analysis. Eur Radiol 16: 1873 – 1886
Management
Because many of the differences are related to the intrinsic soft tissue contrast, MR imaging should be the modality of choice for detection, characterization, and follow-up of patients with concurrent FNH and HCA.

58 Focal Nodular Hyperplasia V – Fatty FNH with Concurrent Fatty Adenoma 125
Fig. 58.1. FNH, drawings. T2 fatsat: FNH is hyperintense to the liver with a brighter central scar; T1 in-phase: FNH is hypointense to the liver with a darker central scar; ART: FNH shows a very intense homogeneous enhance-
Fig. 58.2. FNH, typical MRI findings. A Axial fat-suppressed TSE image (T2 fatsat): FNH is hyperintense to the liver with a brighter central scar. B Axial inphase image (T1 in-phase): FNH is slightly hypointense to the liver with a darker central scar. C Axial arterial phase image (ART): FNH shows very intense and homogeneous enhancement, except the central scar. D Axial delayed phase image (DEL): FNH becomes almost isointense with enhancement of the central scar (arrow). E Axial fat-suppressed T1-w GRE image
ment of the entire lesion, except the central scar; DEL: FNH becomes almost isointense with enhanced central scar
(T1 fatsat) FNH is markedly hypointense, most likely due to fat suppression pulse. F Axial opposed-phase image (T1 opposed-phase) shows decreased signal within FNH indicating moderate to strong fatty infiltration. G Axial SSTSE image (SSTSE): FNH is hyperintense. H Coronal SSTSE image (SSTSE): FNH is slightly hyperintense to the liver. (This MR imaging examination was performed in 2005 as a follow-up in a patient known with FNH and HCA)
Fig. 58.3. FNH, follow-up in the same patient known with FNH and HCA, CT and MRI findings. A CTs in 2002 and 2004 show unchanged FNH. B CTs in 2002 and 2004 show decrease in size of HCA after stopping oral contraceptives.
C Axial inand opposed-phase images (T1 in-phase and T1 op-phase) shows HCA with fatty infiltration. D Axial arterial phase image (ART): HCA shows less intense enhancement than FNH