


162 Part IID – Primary Solid Liver Lesions in Non-Cirrhotic Liver
77 Intrahepatic Cholangiocarcinoma – With Pathologic Correlation
Cholangiocarcinoma is a relatively uncommon tumor, comprising only 15 % of liver cancers in the USA. Cholangiocarcinoma has been classified into three different types based on regional distribution: peripheral tumors that arise from intrahepatic ducts, Klatskin tumors that arise at the confluence of the right and left hepatic ducts, and extrahepatic tumors that arise from ducts distal to the confluence. Generally, intrahepatic tumors are mass-like. This variation in morphology has been previously shown on CT and MR images.
Between 1973 and 1997, the incidence of intrahepatic cholangiocarcinoma in the USA increased by 9.1 % annually. Hepatitis B and C, cirrhosis and alcohol have been described as risk factors. Intrahepatic cholangiocarcinomas have been reported to occur more frequently in the right lobe and to arise predominately in non-cir- rhotic livers. CT and MRI scans are commonly used non-invasive approaches for the detection and staging of cholangiocarcinoma.
Literature
1.Parkin DM, Ohshima H, Srivatanakul P, et al. (1993) Cholangiocarcinoma: epidemiology, mechanisms of carcinogenesis and prevention. Cancer Epidemiol Biomarkers Prev 2:537 – 544
2.Worawattanakul S, Semelka RC, Noone TC, et al. (1998) Cholangiocarcinoma: spectrum of appearances on MR images using current techniques. Magn Reson Imaging 16:993 – 1003
3.Soyer P, Bluemke DA, Reichle R, et al. (1995) Imaging of intrahepatic cholangiocarcinoma: 1. Peripheral cholangiocarcinoma. AJR 165:1427 – 1431
4.Patel T (2001) Increasing incidence and mortality of primary intrahepatic cholangiocarcinoma in the United States. Hepatology 33:1353 – 1357
MR Imaging Findings
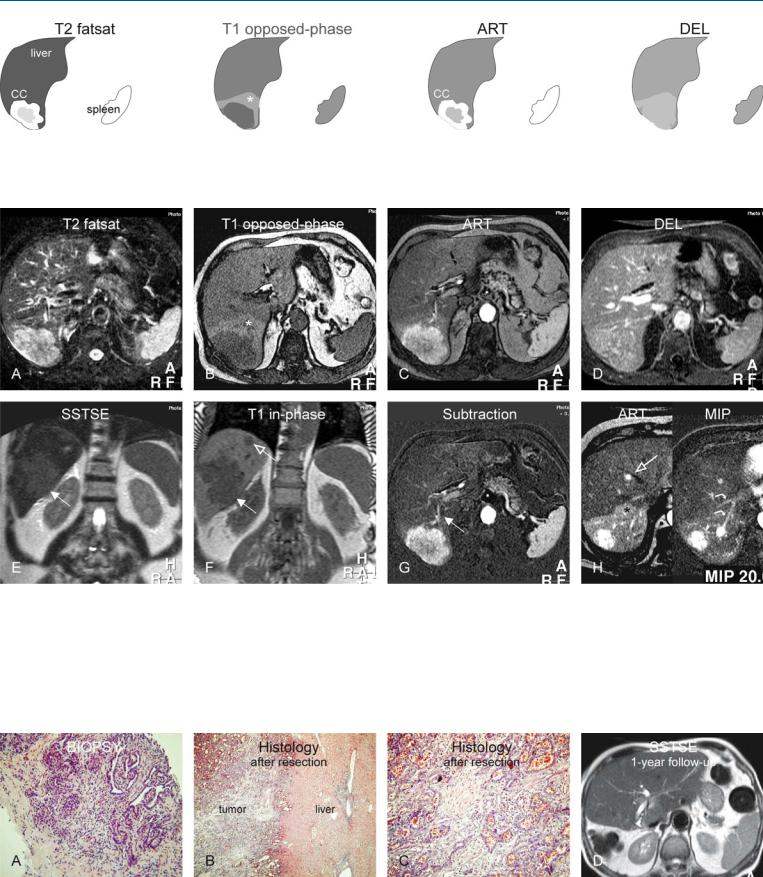
At MR imaging, intrahepatic cholangiocarcinomas appear as wellcircumscribed masses with moderately high signal intensity on T2weighted images. Due to the abundant desmoplasia, the tumors appear darker centrally. In addition, desmoplasia may also cause capsular retraction. These findings give rise to the typical tumor morphology of cholangiocarcinomas at MR imaging. On gadoliniumenhanced arterial phase images, the lesions show intense enhancement of mainly the peripheral thick rim of tissue and are less intense centrally. In the delayed phase, the lesions show washout and may become somewhat heterogeneous, without any capsular enhancement. Any intrahepatic metastases show a similar appearance to the primary tumor (Figs. 77.1, 77.2). At histology, the tumor is composed of gland-like tissue interspersed within a matrix of fibrosis. Despite the presence of intrahepatic metastases, successful hepatic resection may be attempted (Fig. 77.3).
Differential Diagnosis
Hepatocellular carcinoma (HCC) in non-cirrhotic liver may show some overlapping imaging features with intrahepatic cholangiocarcinoma. HCC, however, often shows a mosaic pattern, more intense and heterogeneous enhancement with washout, and capsular enhancement.
77 Intrahepatic Cholangiocarcinoma – With Pathologic Correlation 163
Fig. 77.1. Cholangiocarcinoma (CC), intrahepatic or central, drawings. T2 fatsat: CC is lobulated and hyperintense to the liver with a darker center due to desmoplasia; T1 opposed-phase: CC is surrounded by a wedge-shaped area of
Fig. 77.2. Cholangiocarcinoma (CC), intrahepatic or central, MR findings. A Axial fat-suppressed TSE image (T2 fatsat): CC is lobulated and hyperintense to the liver with a darker center due to desmoplasia. B Axial T1-opposed-phase GRE image (T1 opposed-phase): CC is surrounded by a wedge-shaped area of non-steatosis in an otherwise fatty liver. C Axial arterial phase image (ART): CC shows intense, almost homogeneous enhancement. D Axial delayed phase image (DEL): CC becomes almost isointense to the liver. E Coronal SSTSE image (SSTSE): CC is slightly hyperintense (arrow). F Coronal T1-
non-steatosis (*) in otherwise fatty liver; ART: CC shows intense, almost homogeneous enhancement; DEL: CC becomes almost isointense to the surrounding liver
in-phase GRE image (T1-in-phase): CC (solid arrow) is accompanied by an additional lesion, most likely a metastasis (open arrow). G Subtraction of the arterial phase shows the enhanced CC as well as the feeding artery (arrow). H Axial arterial phase (ART) at a different anatomic level and a MIP: a metastasis is located close to the hepatic vein (open arrow). The early enhancing liver veins (curved arrows) and the wedge-shaped perilesional enhancement (*) indicate shunting caused by the tumor
Fig. 77.3. Cholangiocarcinoma (CC), MR-pathology correlation and follow-up. A Photomicrograph of biopsy (prior to MRI) shows glands within stroma, consistent with a CC. H&E, × 200. B Photomicrograph of the tumor specimen shows a sharp demarcation between the tumor and the surrounding
liver, without any tumor capsule. H&E, × 100. C Photomicrograph shows large glands that explain the high T2 signal. H&E, × 200. D Axial SSTSE image (follow-up after curative right-sided hepatectomy) shows regenerated liver without any residual or recurrent disease

164 Part IID – Primary Solid Liver Lesions in Non-Cirrhotic Liver
78 Telangiectatic Hepatocellular Lesion
Telangiectatic hepatocellular lesion (also known as telangiectatic adenoma and formerly known as „telangiectatic“ focal nodular hyperplasia, FNH) is now considered a variant of adenoma because a recent study showed that the molecular profile of „telangiectatic FNH“ at DNA, gene, and protein expression level is much closer to that of hepatocellular adenomas than typical FNH. Histologically, telangiectatic HCAs are monoclonal, with regular-sized liver plates, a mild degree of inflammation, small isolated, thin dystrophic arteries, and signs of congestion including sinusoidal dilatation. Paradis and colleagues also indicated that FNHs are typically regenerative and polyclonal, whereas HCAs are lesions with a neoplastic and monoclonal nature. However, they did not clarify the significance of a very confusing finding in their study, namely the presence of mild to moderate ductular proliferation in most „telangiectatic FNHs“ as well as typical FNHs. In addition, ductular proliferation was absent in five of six classical HCAs. On pathology, the presence of ductular proliferation is one of the hallmarks of FNH and practically excludes HCA. Until more data become available, „telangiectatic FNH“ should be considered as „telangiectatic adenoma or lesion,“ mainly because their biological behavior is similar to the classical HCA.
Literature
1.Paradis V, Benzekri A, Dargere D, et al. (2004) Telangiectatic focal nodular hyperplasia: a variant of hepatocellular adenoma. Gastroenterology 126:1323 – 1329
2.Hussain SM, Terkivatan T, Zondervan PE, et al. (2004) Focal nodular hyperplasia: a spectrum of findings at state-of-the-art MR imaging, ultrasound, CT and pathology. Radiographics 24:3 – 19
3.Terkivatan T, Van den Bos IC, Hussain SM, et al. (2006) Focal nodular hyperplasia: lesion characteristics at state-of-the-art MR imaging including dynamic gadolinium-enhanced and superparamagnetic iron-oxide-up- take sequences in a prospective study. JMRI (in press)
4.Hussain SM, Van den Bos IC, Dwarkasing S, et al. (2006) Hepatocellular adenoma: findings at state-of-the-art magnetic resonance imaging, ultrasound, computed tomography and pathologic analysis. Eur Radiol 16: 1873 – 1886
MR Imaging Findings
At MR imaging, multiple lesions may be present with a variable but predominantly heterogeneous appearance on T2-weighted images. Some lesions may show evidence of fat on chemical shift imaging. The enhancement is often (persistent) heterogeneous. The presence of Kupffer cells, which is the proof for the primary hepatic nature of these lesions, shows uptake with decreased signal on the T2*-weighted images (Figs. 78.1 – 78.3). The heterogeneity as well as the tumor morphology differ considerably from both classical FNH and HCA. Therefore, we have grouped this lesion separately.
Differential Diagnosis
On follow-up, the lesions do not show any detectable signs of growth, hence suggesting their benign nature. Otherwise, the appearance may easily resemble primary malignant liver lesion, including multifocal hepatocellular carcinoma.

78 Telangiectatic Hepatocellular Lesion 165
Fig. 78.1. Telangiectatic hepatocellular lesion (tHCL), drawings. T2 fatsat: tHCL is moderately hyperintense to the liver with a brighter center; T1 in-phase: tHCL is almost isointense to the liver; ART: tHCL shows heterogeneous
Fig. 78.2. Telangiectatic hepatocellular lesion (tHCL), MRI findings. A Axial fatsuppressed TSE image (T2 fatsat): tHCLs are moderately hyperintense to the liver with brighter centers. B Axial in-phase image (T1 in-phase): tHCLs are isointense to the liver. C Axial arterial phase image (ART): tHCLs show heterogeneous enhancement, mainly in the peripheral parts. D Axial delayed phase image (DEL): tHCLs show persistent enhancement without any capsule or washout. E Axial TSE image (T2 fatsat) after uptake of SPIO: tHCLs
enhancement, more in the periphery; DEL: both tHCLs show persistent enhancement without any capsule or washout of contrast
show similar uptake to the liver (except in the central parts) and become isointense to the liver. F Axial opposed-phase image (T1 opposed-phase) shows more fatty infiltration in the left (open arrow) than the right lesion (solid arrow). G Axial SSTSE image (SSTSE): More fatty tHCL appears brighter (open arrow). H Coronal SSTSE image (SSTSE): Bright appearance of one of the tHCLs may be due to higher fluid as well as fatty content
Fig. 78.3. tHCL in a different patient, MRI findings. A Axial TSE image (T2 fatsat): One large and several smaller tHCLs appear heterogeneous and bright. B Axial post-SPIO TSE image (T2 fatsat): Most tHCLs, including a nodule (*) within the largest lesion, show decreased signal and indicate hepatocellular
origin. C Axial arterial phase image (ART): tHCLs show heterogeneous intense enhancement. D Axial delayed phase image (DEL): tHCLs show persistent enhancement without any capsule or washout

Part III
Diffuse (Depositional) Liver Diseases |
III |