


212 Part V – Biliary Tree Abnormalities
99 Hilar Cholangiocarcinoma II – Intrahepatic Mass
Klatskin described the hilar cholangiocarcinoma (CC) in 1965. CC can cause malignant obstruction at the hilum which can extend into multiple biliary radices. To describe the most common situations, Bismuth and colleagues typed the abnormalities: tumors below the confluence of the left and right hepatic ducts (type I), tumors reaching the confluence (type II), tumors occluding the common hepatic duct and either the right or the left hepatic duct (types IIIa and IIIb, respectively), and tumors that are multicentric or that involve the confluence and both the right and left hepatic ducts (type IV). Most cholangiocarcinomas involve the perihilar and distal extrahepatic bile ducts. This classification is used as the basis for management of hilar CC.
Literature
1.Lee MJ, Dawson SL, Mueller PR, et al. (1993) Percutaneous management of hilar biliary malignancies with metallic endoprostheses: results, technical problems, and causes of failure. Radiographics 13:1249 – 1263
2.Klatskin G (1965) Adenocarcinoma of the hepatic duct at its bifurcation within the porta hepatis: an unusual tumor with distinctive clinical and pathological features. Am J Med 38:241 – 256
3.Bismuth H, Corlette MB (1975) Intrahepatic cholangioenteric anastomosis in carcinoma of the hilus of the liver. Surg Gynecol Obstet 140: 170 – 178
4.De Groen, Gores GJ, LaRusso NF, et al. (1999) Biliary tract cancers. NEJM 341:1368 – 1378
MR Imaging Findings
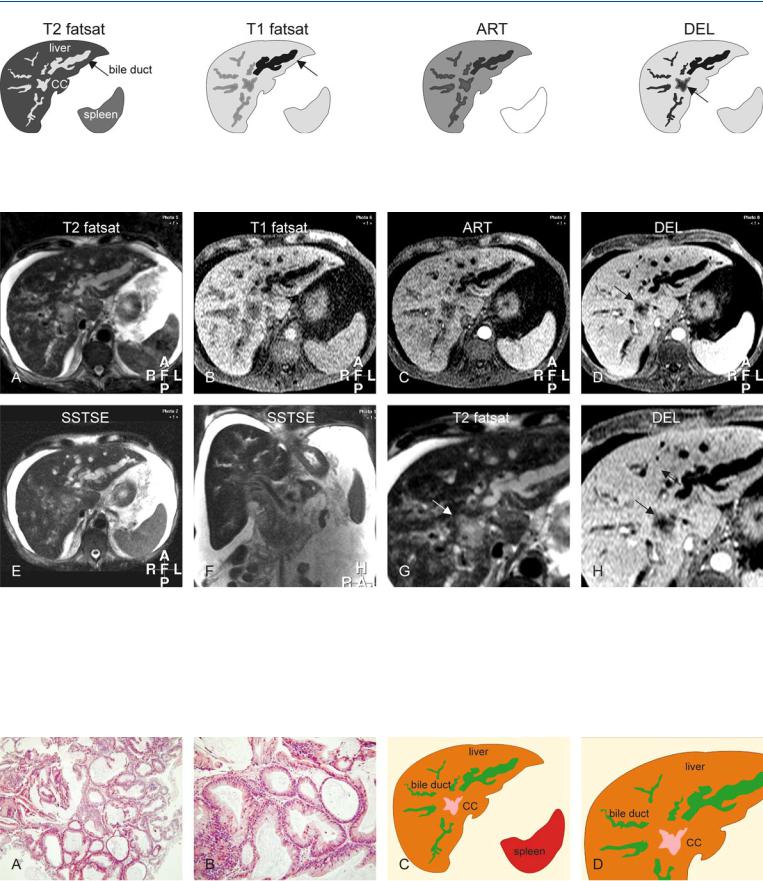
At MR imaging, hilar cholangiocarcinoma may show extension into the liver parenchyma. Some of the hilar CC may comprise glandular tissue with mucin production and hence higher fluid content than the desmoplastic types of tumor. On the T2-weighted images, the tumors may appear brighter and easier to detect. These tumors show little enhancement in either the arterial or the delayed phase (Figs. 99.1 – 99.3).
Management
The Bismuth classification is often used for surgical planning: Surgery may be attempted with or without subsequent radiation. Palliation includes biliary drainage with endoprosthesis or stenting. Metallic self-expanding stents are commonly used for hilar malignancies. Stent placement in the right and left biliary ducts is performed with a bilateral transhepatic approach. Due to debris or tumor overgrowth, stent occlusion can occur in up to 27 % of cases 2.5 months after the initial insertion. The key to successful longterm treatment is to „overstent“ to ensure adequate purchase above hilar tumors and insertion in a balanced position.
99 Hilar Cholangiocarcinoma II – Intrahepatic Mass 213
Fig. 99.1. Hilar cholangiocarcinoma (CC), drawings. T2 fatsat: CC has a similar appearance to the dilated bile ducts; T1 fatsat: one of the ducts in the left liver contains air (most likely introduced by an earlier intervention) and
Fig. 99.2. Hilar cholangiocarcinoma (CC), MR findings. A Axial fat-suppressed TSE image (T2 fatsat): CC has a similar appearance to the dilated bile duct, suggesting its high fluid content. B Axial fat suppressed T1-w GRE image (T1 fatsat): One of the bile ducts in the left liver appears dark because of the air (most likely introduced by an earlier intervention). C Axial arterial phase image (ART): CC does not show much enhancement. D Axial delayed phase image (DEL): CC shows better delineation due to homogeneous enhancement of the surrounding liver (arrow). E Axial SSTSE image (SSTSE) shows
appears much darker (arrow); ART: CC does not show much enhancement; DEL: CC (arrow) shows better delineation due to the homogeneous enhancement of the surrounding liver
mainly the dilated ducts in the left liver. F Coronal SSTSE image (SSTSE) shows ascites that surrounds the liver and the normal-sized spleen. G A detailed view of the axial fat-suppressed TSE image (T2 fatsat): Most likely due to its high fluid content, CC shows good delineation from the surrounding liver (arrow). H A detailed axial delayed phase image (DEL): The periphery of the CC is enhanced and becomes isointense with the liver; CC therefore appears smaller compared to the previous image (arrow)
Fig. 99.3. Hilar cholangiocarcinoma (CC), drawings and direct MR-biopsy correlation. A Photomicrograph of an endoscopic biopsy shows glands and little stroma of CC, which explains its high signal on T2 images. H&E, × 200. B Photomicrograph shows the glands in detail that have cylindrical epitheli-
um. H&E, × 400. C Drawing based on the axial images above shows the dilated bile ducts with sudden caliber change at a certain distance from the CC. D A detailed view of the drawing shows the CC surrounding the dilated bile ducts

214 Part V – Biliary Tree Abnormalities
100 Hilar Cholangiocarcinoma III – Partially Extrahepatic Tumor
In patients with hilar cholangiocarcinoma (CC), early detection and accurate evaluation of tumor extent are necessary for proper treatment. Endoscopic retrograde cholangiopancreatography (ERCP) and percutaneous transhepatic cholangiography (PTC) have been used to detect and classify hilar CC. These imaging modalities provide only information about the intraluminal components (wall irregularity or filling defect). In the past, digital subtraction angiography (DSA) has been helpful in determining vascular involvement. The ability of CT to detect and accurately delineate the hilar CC is limited, mainly because of the lack of tissue contrast. MR imaging can provide a comprehensive workup of the lesions including the vascularity, the extent within the liver as well as extrahepatic extension.
Literature
1.Lee MJ, Dawson SL, Mueller PR, et al. (1993) Percutaneous management of hilar biliary malignancies with metallic endoprostheses: results, technical problems, and causes of failure. Radiographics 13:1249 – 1263
2.Hanninen EL, Pech M, Jonas S, et al. (2005) Magnetic resonance imaging including magnetic resonance cholangiopancreatography for tumor localization and therapy planning in malignant hilar obstructions. Acta Radiol 46:462 – 70
3.Leyendecker JR, Elsayes KM, Gratz BI, et al. (2002) MR cholangiopancreatography: spectrum of pancreatic duct abnormalities. AJR 179:1465 – 1471
4.Reinhold C, Bret PM (1996) Current status of MR cholangiopancreatography. AJR 166:1285 – 1295
MR Imaging Findings
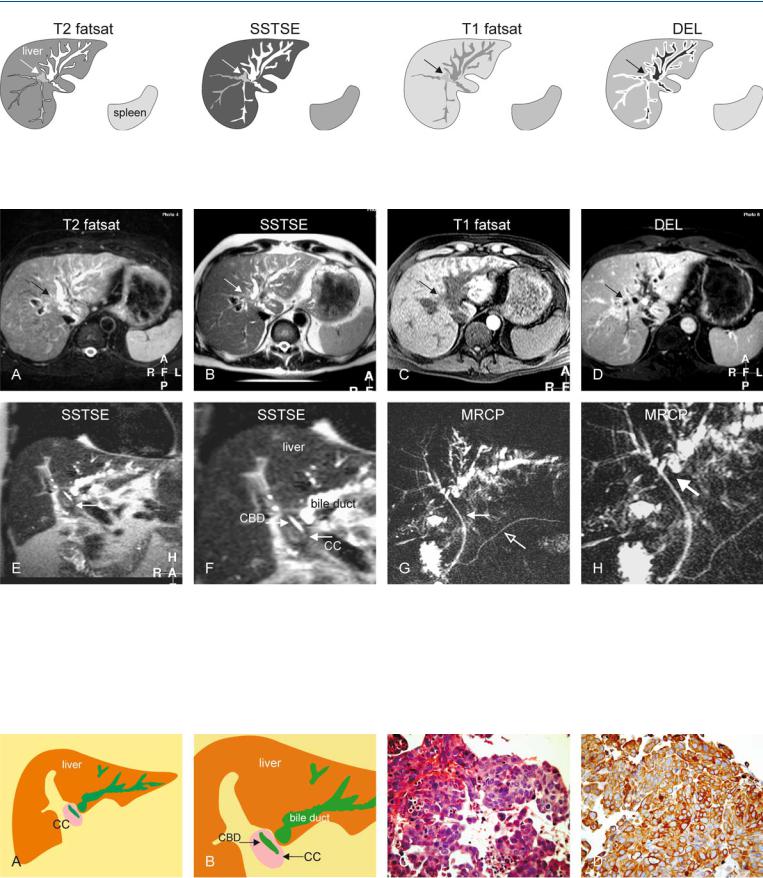
At MR imaging, the extrahepatic extension is even easier to evaluate than the intrahepatic component because the tumor forms excellent contrast with the background bright fat on non-fat suppressed images. On magnetic resonance cholangiopancreatography (MRCP) images, which are equivalent to ERCP images, the extraluminal extent cannot be evaluated. MRCP, unlike ERCP, can however visualize the entire biliary tree including the obstructed segments because it does not rely on injection of any contrast media. MR imaging can also provide information about the exact location for any biopsy for histological proof (Figs. 100.1 – 100.3).
Management
MR imaging, including MRCP sequences, can be used as a road map for any interventional procedure. Hilar CC may involve the main hepatic duct, both hepatic ducts, on segmental ducts. When a tumor obstructs the right and left hepatic ducts, palliation with transhepatic stent placement can be achieved by (a) draining only one system through a single transhepatic track, (b) draining both systems through separate transhepatic tracks, or (c) draining both systems through a single transhepatic track. MR imaging can successfully be used for follow-up in the presence of a (metal) stent.
100 Hilar Cholangiocarcinoma III – Partially Extrahepatic Tumor 215
Fig. 100.1. Hilar cholangiocarcinoma (CC), drawings. T2 fatsat: CC is difficult to distinguish from the surrounding dilated bile ducts and the liver (arrow); SSTSE: the dilated bile ducts show sudden caliber change at the hilum
Fig. 100.2. Hilar cholangiocarcinoma (CC), MR findings. A Axial fat-suppressed TSE image (T2 fatsat): CC is suggested by the dilated bile ducts (arrow). B Axial SSTSE image (SSTSE): The dilated bile ducts show sudden caliber change at the hilum, suggesting a mass (arrow). C Axial fat suppressed T1-w image before contrast (T1 fatsat): CC is slightly hypointense to the liver (arrow). D Axial delayed phase image (DEL): CC shows faint ring-shaped enhancement like the dilated bile ducts, making it difficult to distinguish the two (arrow). E Coronal SSTSE image (SSTSE) shows the dilated bile ducts in
(arrow); T1 fatsat: CC is slightly hypointense to the liver (arrow); DEL: CC (arrow) shows peripheral enhancement but the dilated bile ducts enhance in a similar fashion, making the distinction difficult
the left liver and a mass at the hilum of the liver which is probably the extrahepatic part of the CC (arrow). F A detailed view of the coronal SSTSE (SSTSE) shows the CC that surrounds the common bile duct (CBD) with an endoprosthesis in situ. G MRCP (MRCP) shows mainly the dilated ducts in the left liver because the endoprosthesis (solid arrow) drains the right side. Pancreatic duct (open arrow). H A detailed view (MRCP) indirectly suggests a hilar mass (arrow)
Fig. 100.3. Hilar cholangiocarcinoma (CC), drawings and direct MR-biopsy correlation. A Drawing shows the dilated bile ducts with sudden caliber change caused by a mass (CC) at the liver hilum. B Detailed drawing shows the cholangiocarcinoma (CC) that surrounds the common bile duct (CBD). C Pho-
tomicrograph from endoscopic biopsy material shows findings compatible with CC. H&E, × 400. D Photomicrograph shows the presence of abundant connective (fibrotic) tissue which is a characteristic component of cholangiocarcinomas. Keratin-20, × 400