


244 Part VII – Appendices
113 Appendix I: MR Imaging Technique and Protocol
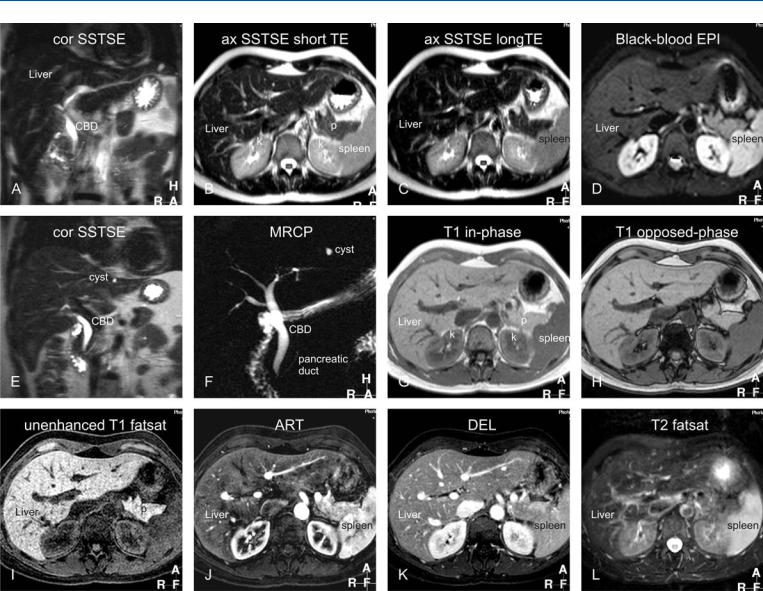
Typical MR imaging protocol (at 1.5T) for the liver should contain the following or similar types of sequences (Fig. 113.1):
1)Coronal single-Shot turbo or fast spin-echo (SSTSE or SSFSE) or Half-Fourier Single-shot Turbo spin-Echo (HASTE): repetition
time (TR), 8; echo time (TE), 120 msec; flip angle, 90 °; acquisition time, 20 seconds (a single breath hold sequence) →serves as a localizer and provides an overview of the anatomy.
2)Axial SSTSE with relatively short (80 msec) and longer (120 –
180 msec) TE; acquisition time 20 – 25 seconds (two breath holds) → detection and characterization of fluid-containing liver lesions such as cysts, hemangiomas, and biliary hamartomas.
3)Axial black-blood echo planar imaging (BBEPI): TR, 3400 ms (minimum); TE, 60 ms; frequency and phase matrix 144 × 256; filed-of-view, 310 – 350 cm with a rectangular FOV 80 %; EPI factor, 109; sensitivity encoding (SENSE) factor, 2; half scan factor 60 %; b-value 20; acquisition time 25 sec; Bandwidth per pixel in the phase encoding direction was 9.2 Hz and in the EPI readout
direction 1387.1 Hz; and the polarity of the phase encoding gradient was set to posterior → provides T2-weighted images in breath hold with better liver-to-lesion contrast than the standard T2-weighted turbo spin-echo with fat suppression.
4)Axial two-dimensional (2D) dual gradient echo (both inand opposed-phase as one sequence in a single breath hold): TR,
150 – 170 msec; TE, 4.2/2.1 msec; flip angle 80 – 90 °; acquisition time, 20 sec →provides T1-information and detects focal or diffuse fatty infiltration in tumors and tissues.
5)Axial dynamic three-dimensional fat-suppressed gradient echo sequence (VIBE; THRIVE; LAVA): TR, minimum; TE, minimum; flip angle, 10 – 15 °; slice thickness 4 – 8 mm, interpolated to about
60 overlapping reconstructed sections of 4 – 2 mm; bandwidth, 62 kHz; acquisition time, 20 – 25 sec in a single breath-hold →arterial phase is the single most important sequence and serves for the detection of liver lesions; all phases are utilized for the characterization based on the enhancement patterns of lesions.
6) Coronal delayed three-dimensional fat-suppressed gradient echo sequence: TR/TE, minimum; flip angle, 10 – 15 °; slice thickness 4 – 6 mm, interpolated to about 40 overlapping reconstructed sections of 2 – 3 mm; bandwidth, 62 kHz; acquisition time, 20 – 25 sec in a single breath-hold →provides information about the persistent enhancement of lesions such as hemangiomas, capsular enhancement of hepatocellular carcinomas, and peritoneal spread of disease, and biliary tree abnormalities.
7)Axial T2-weighted turbo or fast spin-echo (TSE or FSE) with fat-
saturation: TR, 2000 msec; TE, 100 msec; flip angle, 90 °; acquisition time, 2 – 5 minutes (respiratory-triggered) → traditionally this sequence has been used for the detection of solid liver lesions. Most likely, this sequence will be replaced by newer T2-weighted sequences such as BBEPI.
8)Magnetic resonance cholangiopancreatography (MRCP) consists of a 2D heavily T2-weighted sequence with a thick slab of 30 – 60 mm to provide an overview of the biliary and pancreatic anatomy: TR, 8; TE, 800 msec; flip angle, 90 °; acquisition time, 2 sec per slab which are typically acquired as a radial scan of 5 – 10 slabs around the common bile duct. This thick slab MRCP is often combined with thin slice coronal SSTSE with a TE of about 180 msec and thin sections ( 5 mm).
113 Appendix I: MR Imaging Technique and Protocol 245
Fig. 113.1. Appendix I: Typical liver MRI protocol. A Coronal single-shot turbo spin-echo (cor SSTSE) image provides an overview of the anatomy (CBD = common bile duct). B Axial SSTSE (ax SSTSE) image with a short echo time (TE = 80 ms) shows the liver darker than the spleen (p = pancreas; k = kidneys). C Axial SSTSE (ax SSTSE) image with a longer echo time (TE = 120 ms) shows decreased signal in the liver, spleen, pancreas (which indicates the solid nature of the tissues). D Axial T2and diffusion-weighted black-blood echo planar imaging (BBEPI) shows the vessels dark with excellent liver-to-spleen contrast (most liver lesions follow the signal of the spleen). E, F Coronal thin-slice (5 mm) and thick-slab (40 mm) SSTSE breath-hold images as part of the MRCP protocol show the relationship of the fluid-filled structures (biliary tree; the pancreatic duct; a cyst) to the solid tissues as well as an overview of the fluid-filled structures, respectively.
G, H Axial T1-weighted inand opposed-phase gradient-echo (GRE) images show the spleen darker than the liver indicating good T1-weighting; these sequences are sensitive to a small amount of fat. I Axial three-dimensional (3D) unenhanced T1-weighted GRE image with fat suppression shows the liver and pancreas (p) with high signal intensity. J Axial 3D arterial phase GRE image (ART) shows intense enhancement of the arterial vessels, some enhancement of the portal vein (pv), no enhancement of the hepatic veins (hv), heterogeneous enhancement of the spleen, and intense enhancement of the pancreas. K Axial delayed phase image (DEL) shows enhancement of the hepatic veins (hv) and homogeneous enhancement of the organs. L Axial respiratory-triggered, fat-suppressed, T2-weighted image (T2 fatsat) with moderate T2-weighting shows spleen with higher signal than the liver; note that – in contrast to the BBEPI – the intrahepatic vessels are bright

246 Part VII – Appendices
114 Appendix II: Liver Segmental and Vascular Anatomy
Segmental Anatomy
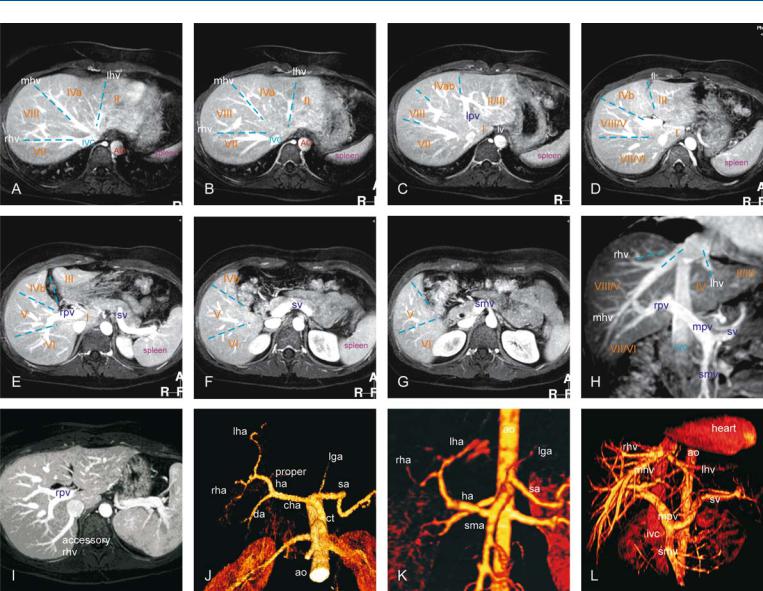
Based on external appearance, four lobes of the liver can be distinguished: right, left, quadrate, and caudate. The falciform ligament (fl) divides the liver into the right and left anatomic lobes. The ligament venosum (lv) divides the caudate lobe from the left lobe. In 1957, two classification systems were described. Goldsmith et al. described the right and left lobes and four segments: lateral, medial, anterior and posterior. Each segment consists of two subsegments: superior and inferior. Couinaud described eight segments (Fig. 114.1A–114.1G): one for the caudate lobe (segment I), three on the left (segments II, III and IV) and four on the right (segments V, VI, VII and VIII). The caudate lobe receives vessels both from the left and right branches of the portal vein and hepatic artery: its hepatic veins are independent and drain directly into the inferior vena cava (ivc). Recent studies suggest that the caudate lobe could be divided into a left part or Spiegel’s lobe or segment I and the right part or segment IX or paracaval portion.
Literature
1.Goldsmith NA, Woodburne RT (1957) Surgical anatomy pertaining to liver resection. Surg Gynecol Obstetr 195:310 – 8
2.Couinaud C (1999) Liver anatomy: portal (and suprahepatic) or biliary segmentation. Digest Surg 16:459 – 67
3.Abdalla EK, Vauthey JN, Couinaud C (2002) The caudate lobe of the liver. Implications of embryology and anatomy for surgery. Surg Oncol Clin N Am 11:835 – 48
4.Sahani D, Mehta A, Blake M, et al. (2004) Preoperative hepatic vascular evaluation with CT and MR angiography: implications for surgery. Radiographics 24:1367 – 1380
Hepatic Venous Drainage
The normal hepatic venous anatomy consists of three main venous tributaries that drain into the ivc. The right hepatic vein (rhv) drains liver segments V–VII, the middle hepatic vein (mhv) drains segments IV, V, and VIII, and the left hepatic vein (lhv) drains segments II and III. Accessory veins are a common cause of surgical complications. An accessory rhv occurs in 53 % of patients and two accessory hepatic veins in 12 %, and an accessory vein draining the caudate lobe in 12 %. The most common hepatic venous variant is an accessory inferior rhv (Fig. 114.1I).
Hepatic Arterial Supply
The so-called „normal“ hepatic arterial supply occurs only in a small majority of subjects. In 55 % of cases, the common hepatic artery (cha) gives rise to the right hepatic artery (rha), middle hepatic artery (mha), and left hepatic artery (lha) (114.1J); in 11 %, the rha originates from the superior mesenteric artery (sma); in 10 %, a replaced lha is present; in 8 % the rha, mha, and lha arise from the cha with an accessory lha from the left gastric artery (lga); in 7 %, the rha, mha, and lha arise from the cha with an accessory rha from the lga; and in 4.5 %, the entire ha root arises from the sma (Fig. 114.1K). In addition, there are more infrequent variants.
Portal Venous Supply
The normal portal venous anatomy consists of the main portal trunk and its two branching vessels, the right and left portal veins (Fig. 114.1L). Portal venous variants account for about 20 % of all important variants.
114 Appendix II: Liver Segmental and Vascular Anatomy 247
Fig. 114.1. Appendix II: Liver segmental and vascular anatomy. A–G Axial maxi- |
ao = aorta |
mhv = middle hepatic vein |
mum intensity projection (MIP) based on the three-dimensional (3D) gado- |
ct = celiac trunk |
mpv = main portal vein |
linium-enhanced delayed phase gradient echo images at various levels |
da = duodenal artery |
rha = right hepatic artery |
shows the hepatic segments (I–VIII), three hepatic veins, portal vein, and |
fl = falciforme ligament |
rhv = right hepatic vein |
ligaments. H Coronal reformat shows the relationship among the hepatic |
ha = hepatic artery |
rpv = right portal vein |
segments, three hepatic veins, portal vein (formed by the splenic and supe- |
ivc = inferior vena cava |
sma = superior mesenteric artery |
rior mesenteric veins), and inferior vena cava. I MIP based on the axial gad- |
lga = left gastric artery |
sa = splenic artery |
olinium-enhanced delayed phase gradient echo image shows an accessory |
lv = ligament venosum |
smv = superior mesenteric vein |
right hepatic vein draining directly into the IVC. J, K 3D surface-shaded ren- |
lha = left hepatic artery |
sv = splenic vein |
derings based on the arterial phase of the gadolinium-enhanced imaging |
lhv = left hepatic vein |
I–VIII = indicate the liver segments |
show the normal hepatic arterial vessels (about 55 %) and a variant with re- |
lpv = left portal vein |
from 1 to 8 |
placed hepatic artery from the superior mesenteric artery (about 10 %). |
|
|
L 3D surface-shaded rendering based on the delayed phase of the gadolini- |
|
|
um-enhanced imaging rendering shows the normal portal as well as hepatic |
|
|
veins in relation to the aorta and inferior vena cava. |
|
|