


76 Part IIC – Primary Solid Liver Lesions in Cirrhotic Liver
35 Cirrhosis I – Liver Morphology
Damage to the liver, which often leads to fibrosis and cirrhosis, can be caused by several factors, including toxic agents, metabolic disorders, obesity, alcoholism, and viral infections. Aflatoxin is considered an important cause of cirrhosis in endemic areas, such as Africa and Asia. Metabolic and genetic disorders, including hemochromatosis, can lead to cirrhosis as well. Alcohol may directly damage the liver cells but it also impairs the uptake as well as the oxidation of fatty acids in the hepatocellular mitochondria. Excess dietary fat and carbohydrates are stored as fatty acids and triglycerides in the hepatocytes. In addition, damaged liver cells lose their ability to efficiently remove triglycerides from the liver. Therefore, obesity, diabetes (type II) as well as alcoholism can lead to fatty liver. Long-standing steatosis can lead to steatohepatitis, which may progress to fibrosis, and eventually to cirrhosis. Viral hepatitis is currently the most important etiologic factor leading to liver fibrosis and cirrhosis in North America.
Literature
1.Hussain SM, Zondervan PE, et al. (2002) Benign versus malignant hepatic nodules: MR imaging findings with pathologic correlation. Radiographics 22:1023 – 36
2.Ito K, Mitchell DG, Gabata T, Hussain SM (1999) Expanded gallbladder fossa: simple MR imaging sign of cirrhosis. Radiology 211:723 – 726
3.Ito K, Mitchell DG, Siegelman ES (2002) Cirrhosis: MR imaging features. Magn Reson Imaging Clin N Am 10:75 – 92
4.Nonomura A, Enomoto Y, Takeda M, et al. (2005) Clinical and pathological features of non-alcoholic steatohepatitis. Hepatol Res 33:116 – 121
MR Imaging Findings
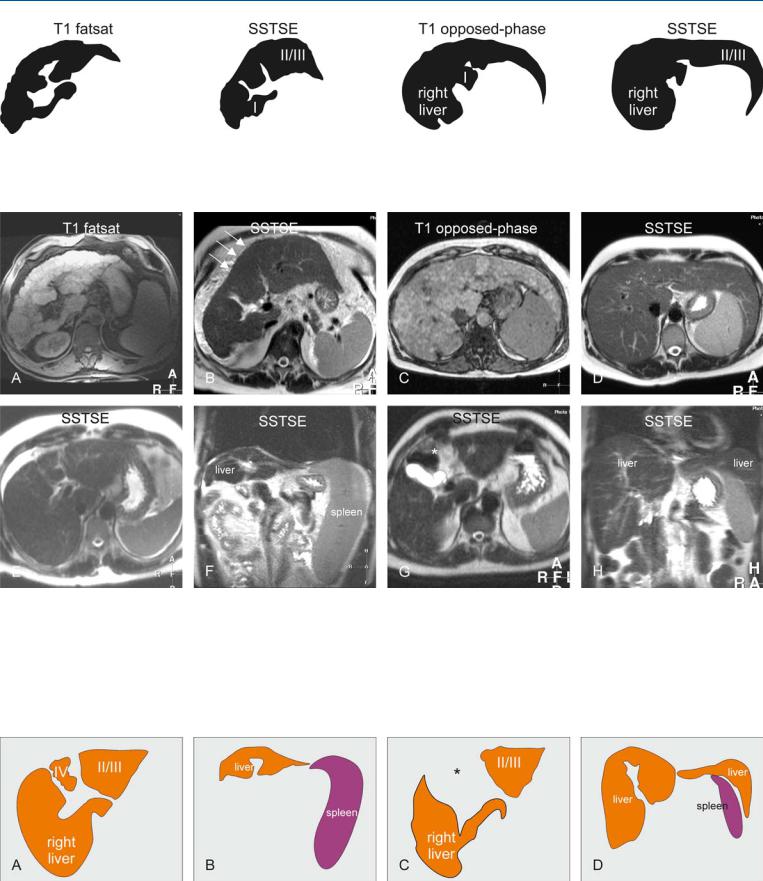
Cirrhosis induces several intraand extrahepatic changes including enlargement of the caudate lobe and the left lateral segment of the liver, atrophy of the right hepatic lobe and the left medial segment, nodularity of the liver surface, coarse liver architecture, ascites, splenomegaly, and the development of collaterals. At MR imaging, cirrhotic liver shows changed morphology which may include irregular contours, atrophy of certain segments (usually segment IV), central atrophy, and hypertrophy of some segments. Cirrhotic livers contain regenerative nodules which may develop into dysplastic nodules and hepatocellular carcinomas over time (Figs. 35.1 – 35.3).
35 Cirrhosis I – Liver Morphology 77
Fig. 35.1. Cirrhosis, morphology of the liver, drawings. T1 fatsat: multiple regenerative nodules cause irregular contours of the liver; SSTSE: hypertrophy of segments I, II and III with right-sided atrophy; note also irregular
Fig. 35.2. Cirrhosis, morphology of the liver, MRI findings from six different patients. A Axial fat-suppressed T1-w gradient recalled echo (GRE) image (T1 fatsat): Multiple bright nodules and septa cause irregular contours of the liver. B Axial single shot turbo spin echo (SSTSE) image (SSTSE): Segment I, II, and III hypertrophy with right-sided atrophy is present. Note the fine irregularity of the liver contours due to intrahepatic nodules (arrows). C Axial op- posed-phase image (T1-opposed-phase): Multiple bright nodules with predominant right-sided and segment I hypertrophy are present. D Axial SSTSE
contours; T1 opposed-phase: Segment I and right-sided hypertrophy; note also irregular contours; SSTSE: Segments II and II with right-sided hypertrophy.
image (SSTSE): Prominent leftand right-sided hypertrophy (i.e., segmental regenerative). E Axial SSTSE image (SSTSE) shows segment IV atrophy. F Coronal SSTSE image (SSTSE) shows atrophy of the liver and splenomegaly. G Axial SSTSE image (SSTSE) shows absence of segment IV due to complete atrophy. Note the interposition of the bowel loops with the empty gallbladder fossa (*). H Coronal SSTSE image (SSTSE) shows hypertrophy of the right and the left lateral segment of the liver
Fig. 35.3. Cirrhosis, morphology of the liver, drawings. A Atrophy of segment IV, with relative hypertrophy of the right liver and segments II/III. B Atrophy of
the liver with splenomegaly. C Complete disappearance of segment IV with empty gallbladder fossa (*). D Hypertrophy of the right and the left liver
78 Part IIC – Primary Solid Liver Lesions in Cirrhotic Liver
36 Cirrhosis II – Regenerative Nodules and Confluent Fibrosis
Cirrhosis is mainly composed of regenerative nodules (RNs) that are surrounded by fibrous septa. In addition to the nodules, cirrhotic livers may have areas of increased segmental fibrosis which may mimic malignancy particularly on ultrasound (US) and computed tomography (CT) because these modalities lack the inherent tissue contrast and routine use of dynamic contrast-enhanced imaging. Also the RNs may be challenging to distinguish from malignancy on these modalities. MR imaging is highly sensitive and specific for diffuse liver lesions including cirrhosis and related abnormalities.
Literature
1.International Working Party (1995) Terminology of nodular hepatocellular lesions. Hepatology 22:983 – 993
2.Hussain SM, Zondervan PE, et al. (2002) Benign versus malignant hepatic nodules: MR imaging findings with pathologic correlation. Radiographics 22:1023 – 36
3.Ohtomo K, Baron RL, Dodd GD III, et al. (1993) Confluent hepatic fibrosis in advanced cirrhosis: evaluation with MR imaging. Radiology 189:871 – 874
MR Imaging Findings
At MR imaging, RNs show variable signal intensity on T1-weighted sequences (low, iso, high). By definition, RNs show low signal intensity on T2-weighted sequences and do not show any detectable enhancement in the arterial phase after injection of gadolinium. In the later phase, cirrhotic livers often show septal enhancement with some enhancement of the RNs. Unlike previous reports, MR imaging facilitates the distinction between confluent fibrosis and segmental or diffuse hepatocellular carcinoma. Confluent fibrosis typically has slightly increased signal on T2-weighted images but lacks arterial enhancement or washout in the delayed phases. Instead, confluence fibrosis shows persistent enhancement in the delayed phases due to the presence of fibrosis (Figs. 36.1, 36.2).
Pathology
RNs result from a localized proliferation of hepatocytes and their supporting stroma. RNs include monoacinar RNs, multiacinar RNs, cirrhotic nodules, lobar or segmental hyperplasia, and focal nodular hyperplasia. RN is a well-defined region of parenchyma that has enlarged in response to necrosis, altered circulation, or other stimuli. The diameter varies between less than a millimeter to a few centimeters. Macronodular cirrhosis contains nodules > 3 mm. Cirrhotic nodules are RNs that are largely or completely surrounded by fibrous septa (Fig. 36.3).
36 Cirrhosis II – Regenerative Nodules and Confluent Fibrosis 79
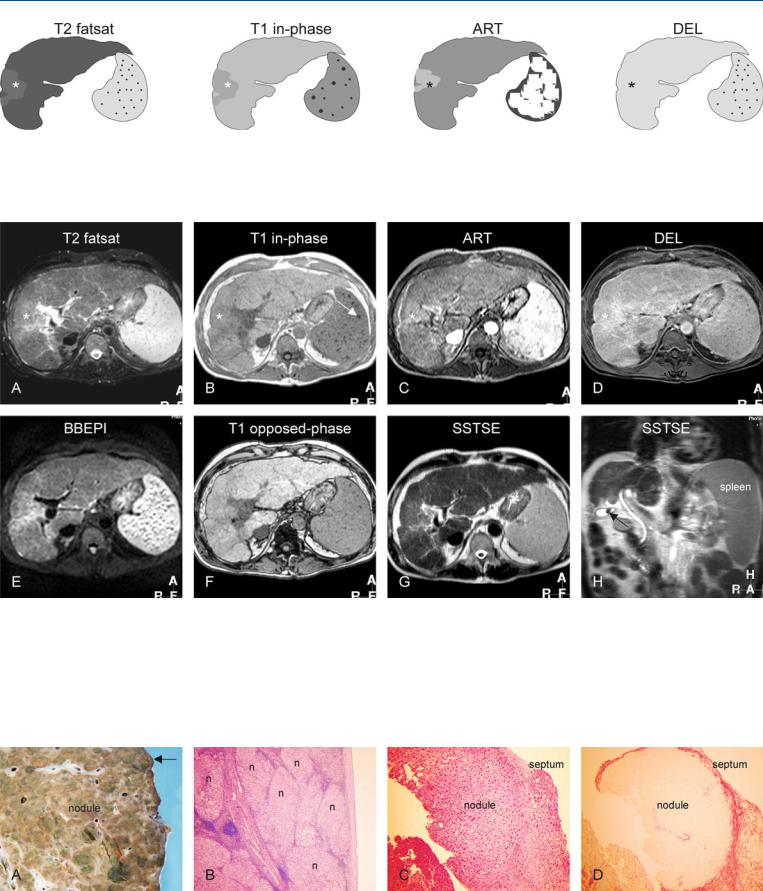
Fig. 36.1. Cirrhosis, confluent fibrosis. T2 fatsat: the right liver shows atrophy with slightly increased signal (*). T1 in-phase: the same part has a decreased signal (*). The spleen contains Gamna Gandy bodies. ART: the suspected part (*) shows slightly increased enhancement which may suggest an hepa-
Fig. 36.2. Cirrhosis, confluent fibrosis, MRI findings. A Axial fat-suppressed T2- w TSE image (T2 fatsat): The liver shows irregular contours with multiple nodules and atrophy of the right liver with slightly increased signal (*). B Axial T1-w in-phase GRE image (T1 in-phase): A part of the right liver has decreased signal (*). The enlarged spleen shows Gamna Gandy bodies as a sign of portal hypertension. C Axial arterial phase image (ART): A part of the right liver shows some increased enhancement (*). D Axial delayed phase image (DEL): The enhanced liver (*) does not lose its contrast (no
tocellular carcinoma (HCC); DEL: the suspected part of the liver (*) becomes almost isointense due to persistent enhancement, compatible with confluent fibrosis
washout), compatible with confluent fibrosis. E Axial T2-w black-blood echoplanar imaging (BBEPI) image: Due to lack of refocusing pulses, the (iron containing) Gamna Gandy bodies appear larger. F Axial T1-w op- posed-phase image (T1 opposed-phase) shows the liver with multiple regenerative nodules. G Axial SSTSE (SSTSE) shows the liver with irregular contours. H Coronal SSTSE (SSTSE) shows the atrophy of the right liver with enlarged spleen. Note a small stone in the gallbladder (arrow)
Fig. 36.3. Cirrhosis, histopathology based on the material from other patients. A Photograph of part of an explant cirrhotic liver with multiple nodules surrounded with septa. The contours of the liver are very irregular (arrow). B Photomicrograph shows multiple regenerative nodules (n) surrounded by
septa consistent with cirrhosis. H&E, × 40. C Photomicrograph shows a nodule in more detail surrounded by a septum. H&E, × 100. D Photomicrograph shows the nodule in C with better demarcation due to specific staining of the fibrotic septum. Sirius red stain, × 100