


130 Part IID – Primary Solid Liver Lesions in Non-Cirrhotic Liver
61 Hepatic Lipoma – MR-CT-US Comparison
Hepatic lipomas are extremely uncommon lesions. Histologically, these lesions consist of mature adipose tissue, and usually, these tumors do not cause symptoms and present as an incidental finding at imaging. Lipomas have characteristic findings at CT and MR imaging. If lesions present with any atypical findings such as subtle heterogeneity or unusual enhancement, other entities such as liposarcomas, teratomas, hepatocellular adenomas, and hepatocellular carcinomas should be considered as differential diagnostic possibilities. Particularly, MR imaging can provide a highly specific diagnosis.
MR Imaging Findings
At MR imaging, hepatic lipomas should behave similarly to the subcutaneous fat. The lesions show very bright signal on non-fat-sup- pressed T2-weighted single-shot spin-echo sequences and very dark signal on fat-suppressed T2-weighted fast spin-echo. On T1-weighted in-phase images the lesions appear very bright (similar to the subcutaneous fat) and on opposed-phase images the lesions are surrounded by the characteristic phase cancellation (India-ink) artifact. Hepatic lipomas show negligible enhancement after administration of gadolinium (Figs. 61.1, 61.2). MR imaging findings are pathognomonic for hepatic lipomas. The findings on CT are also very characteristic, whereas US shows a hyperechoic non-specific appearance (Fig. 61.3).
Literature
1.Langsteger W, Lind P, Schneider GH, et al. (1990) Lipoma of the liver: Computed tomographic, ultrasonographic and cytologic findings. Scand J Gastroenterol 25:302 – 306
2.Sonsuz A, Ozdemis S, Akdogan M, et al. (1994) Lipoma of the liver. Gastroenterology 32:348 – 350
3.Hirasaki S, Koide N, Ogawa H, et al. (1999) Tuberous sclerosis associated with multiple hepatic lipomatous tumors and hemorrhagic renal angiomyolipoma. Intern Med 38:345 – 348
4.Prasad SR, Wang H, Rosas H, et al. (2005) Fat-containing lesions of the liver: radiologic-pathologic correlation. Radiographics 25:321 – 331
5.Henkelman RM, Hardy PA, Bishop JE, et al. (1992) Why fat is bright in RARE and fast spin-echo imaging. JMRI 2:533 – 540
61 Hepatic Lipoma – MR-CT-US Comparison 131
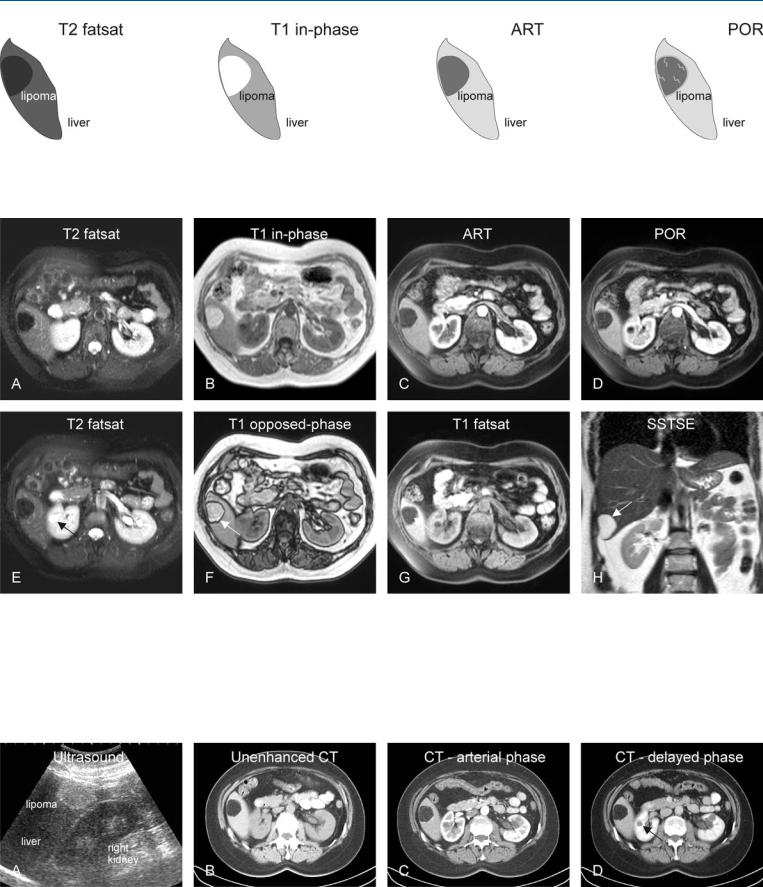
Fig. 61.1. Lipoma in the liver, drawings. T2 fatsat: lipoma is much darker than the liver due to fat suppression (lipoma behaves like the subcutaneous fat); T1 in-phase: lipoma is as bright as the intra-abdominal and subcutaneous
Fig. 61.2. Lipoma in the liver, MRI findings. A Axial TSE image (T2 fatsat): lipoma is much darker than the liver due to fat suppression. B Axial in-phase image (T1 in-phase): lipoma is very bright and comparable to the intra-ab- dominal and subcutaneous fat. C Axial arterial phase image (ART): lipoma does not show much enhancement and appears dark due to fat suppression. D Axial portal phase image (POR): lipoma shows faint enhancement. E Axial TSE image (T2 fatsat) at a different anatomic level: lipoma appears dark; a simple cyst in the right kidney is bright signal (arrow). F Axial opposed-
fat; ART: lipoma does not show much enhancement and appears dark due to fat suppression; POR: lipoma shows faint enhancement of intratumoral septa. (Courtesy of Dr. Franz Sulzer)
phase image (T1 opposed-phase): lipoma is surrounded by a dark line (arrow) caused by the phase cancellation (artifact), which can only be present at the interfaces between fatty and non-fatty tissues. G Axial T1-w fat-sup- pressed GRE image (T1 fatsat): the signal in lipoma is suppressed due to fatty content. H Coronal SSTSE image (SSTSE): on this heavily T2-weighted sequence lipoma shows similarity with non-solid lesions such as cysts and hemangiomas. (Courtesy of Dr. Franz Sulzer)
Fig. 61.3. Lipoma in the liver, US and CT findings in the same patient as above. A Ultrasound shows a hyperechoic (non-specific) lesion. B Unenhanced CT shows lipoma as dark as the subcutaneous fat (with comparable negative Hounsfield units). C CT in the arterial phase shows negligible enhancement.
D CT in the delayed phase shows a similar appearance to in the arterial phase; renal cyst shows no enhancement (arrow). (Courtesy of Dr. Franz Sulzer)

132 Part IID – Primary Solid Liver Lesions in Non-Cirrhotic Liver
62Hepatocellular Adenoma I – Typical with Pathologic Correlation
With the introduction of oral contraceptives (OC) during the late 1960s, a sudden increase in the number of hepatocellular adenomas (HCAs) was observed. Later (in 1979), others confirmed the positive relationship between the OC use and HCA. HCAs develop at an annual rate of about 0.1 – 0.13 per 100,000 without OC use, whereas the long-term users of OC have an estimated annual incidence of HCA of 3.4 per 100,000. The incidence of HCA with OC is reported to be more than 25-fold higher than without OC use. Non-OC-relat- ed causes of HCA include glycogen storage diseases, and hormonal stimulation from other sources, for instance anabolic steroid use by body builders, gynecological tumors, and pregnancy. HCA is reported rarely in males, probably from using anabolic steroids or based on abnormal stimulus from an endogenous source.
Literature
1.Baum JK, Holtz F, Bookstein JJ, et al. (1973) Possible association between benign hepatoma and oral contraceptives. Lancet 2:926 – 929
2.Edmondson HA, Henderson B, Benton B (1976) Liver-cell adenomas associated with use of oral contraceptives. NEJM 294:470 – 472
3.Hussain SM, Van den Bos IC, Dwarkasing S, et al. (2006) Hepatocellular adenoma: findings at state-of-the-art magnetic resonance imaging, ultrasound, computed tomography and pathologic analysis. Eur Radiol 16: 1873 – 1886
MR Imaging Findings
At MR imaging, typical HCAs often have the following characteristics: (1) near isointense or slightly hyperintense to the surrounding liver on T1-weighted in-phase gradient-echo images (indicating the hepatocellular nature of the lesions), (2) slightly hyperintense or hypointense on fat-suppressed T2-weighted images (depending mainly on whether HCA is surrounded by fatty liver or the lesion itself contains abundant fat or fibrosis, respectively), (3) faint homogeneous enhancement (blush) in the arterial phase, and (4) fading to isointensity in the delayed phase without any washout of contrast or enhanced tumor capsule, central scar, or septa (Figs. 62.1, 62.2).
Pathology
At gross pathology, HCAs are unencapsulated well-delineated yellow or tan lesions. The consistency is soft or friable, and areas of necrosis and hemorrhage may be present. Tumors are highly vascular. Areas of scarring indicate previous episodes of infarction. At histology, HCA solely consists of liver cells that are arranged in plates that are not thicker than two to three cells, devoid of lobular pattern due to absence of portal areas. The plates are separated by slit-like sinusoids lined by epithelium. HCAs lack portal circulation. Lack of bile ductules facilitates distinction from FNH at histology (Fig. 62.3). Kupffer cells are always present in HCA.
62 Hepatocellular Adenoma I – Typical with Pathologic Correlation 133
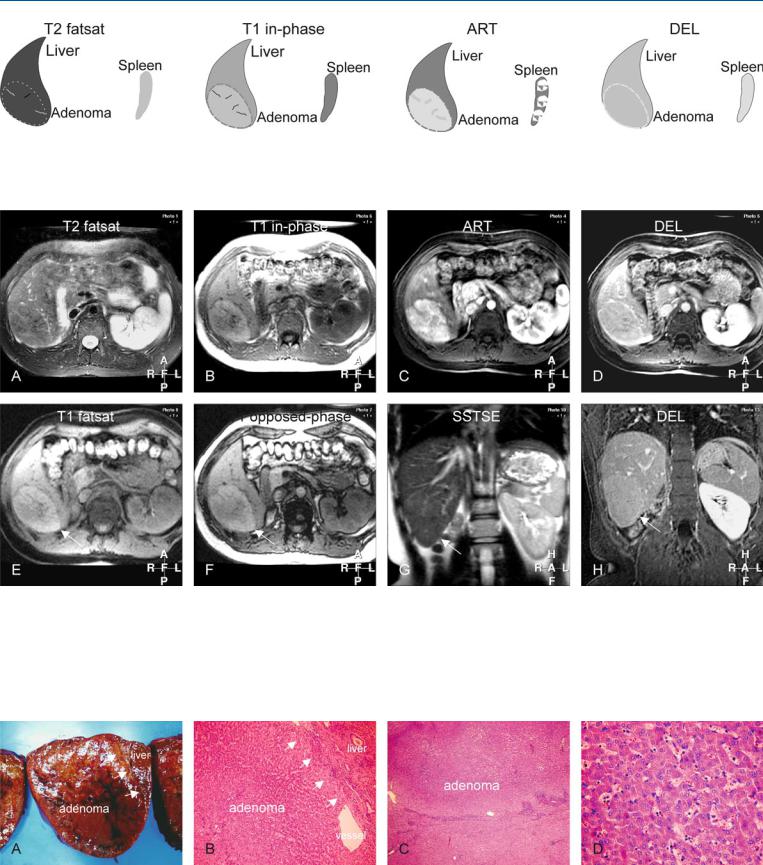
Fig. 62.1. Adenoma, drawings. T2 fatsat: adenoma is isointense with a thin bright pseudocapsule; T1 in-phase: adenoma is slightly hyperintense to the liver; ART: adenoma shows a moderately intense homogeneous enhance-
Fig. 62.2. Adenoma, typical MRI findings. A Axial fat-suppressed T2-w TSE image (T2 fatsat): Adenoma is isointense to the liver and surrounded by a bright pseudocapsule. B Axial in-phase T1-w GRE (T1 in-phase): Adenoma is slightly hyperintense to the liver. C Axial arterial phase post-Gd 3D T1-w GRE image (ART): Adenoma shows moderately intense and homogeneous enhancement. D Axial delayed post-Gd T1-w GRE image (DEL): Adenoma becomes isointense with some enhancement of the pseudocapsule. E Axial
ment of the entire lesion; DEL: adenoma becomes isointense to the liver with enhancement of the pseudocapsule (compressed liver tissue and vessels)
2D fat-suppressed T1-w GRE image (T1 fatsat): Adenoma is slightly hyperintense with low signal pseudocapsule (arrow). F Axial opposed-phase 2D T1-w GRE image (T1 opposed-phase): Adenoma shows no evidence of fatty infiltration (arrow). G Coronal T2-w SSFSE image (T2 coronal): Adenoma is slightly brighter than the liver (arrow). H Coronal delayed phase post-Gd T1-w GRE image (DEL coronal): Adenoma has become isointense with the liver without any central scar (arrow)
Fig. 62.3. Adenoma, direct MR-pathology correlation. A Photograph of the resected specimen: adenoma is very similar to the liver, with sharp demarcation and without any tumor capsule (arrows). B Photomicrograph shows almost normal hepatocytes arranged in plates with large vessels. The inter-
face shows with compressed liver parenchyma (arrows). H&E, × 200. C Photomicrograph shows adenoma that is surrounded by the compressed liver tissue. H&E, × 100. D Photomicrograph shows almost normal hepatocytes arranged in plates that are up to two cell layers thick. H&E, × 400