


224 Part V – Biliary Tree Abnormalities
105 Primary Sclerosing Cholangitis III – With Intrahepatic Stones
Primary sclerosing cholangitis (PSC) causes progressive changes including irregularities, multifocal strictures, and dilatations in different levels of the biliary channels. Large bile duct dilatations cause secondary cholestasis, which may result in primary pigmented stones in up to 30 % of patients. Other cholangiographic findings include webs and diverticula. A diverticulum is a focal, eccentric, saccular dilatation of the bile duct. Up to 27 % of patients with PSC have diverticula. MR imaging with MRCP should be the modality of choice for evaluation of bile ducts with intrahepatic stones.
Literature
1.Vitellas KM, Keogan MT, Freed KS, Enns RA, Spritzer CE, Baillie JM, Nelson RC (2000) Radiologic manifestations of sclerosing cholangitis with emphasis on MR cholangiopancreatography. Radiographics 20:959 – 975
2.Cotton PB (1991) Bile duct diverticula and webs: nonspecific cholangiographic features of primary sclerosing cholangitis. AJR 157:281 – 285
3.Ito K, Mitchell DG, Outwater EK, et al. (1999) Primary sclerosing cholangitis: MR imaging features. AJR 172:1527 – 1533
MR Imaging Findings
At MR imaging, intrahepatic stones are visible as filling defects on the T2-weighted and MRCP sequences, and as hyperintense signal within the dilated dark bile ducts on T1-weighted images. Occasionally, segmental PSC with intrahepatic stones may also be seen (Figs. 105.1 – 105.3).
Differential Diagnosis
Caroli’s disease with intrahepatic stones should be excluded. Clonorchis sinensis and Ascaris lumbricoides can inhabit the bile ducts and induce ductal injury and strictures. Oriental cholangiohepatitis is uncommon in Western countries. Cholangiographic findings include multifocal strictures and dilatation of the intrahepatic bile ducts, stones, disproportionate dilatation of the extrahepatic bile duct unrelated to strictures or stones, a right-angle branching pattern, and decreased arborization. In rare instances, cholangiectasis or „bile lakes“ can occur from ongoing obstruction and inflammation. Complications include primary pigmented stones (80 % of cases), hepatic abscess, and cholangiocarcinoma (2.5 – 5.0 %).
105 Primary Sclerosing Cholangitis III – With Intrahepatic Stones 225
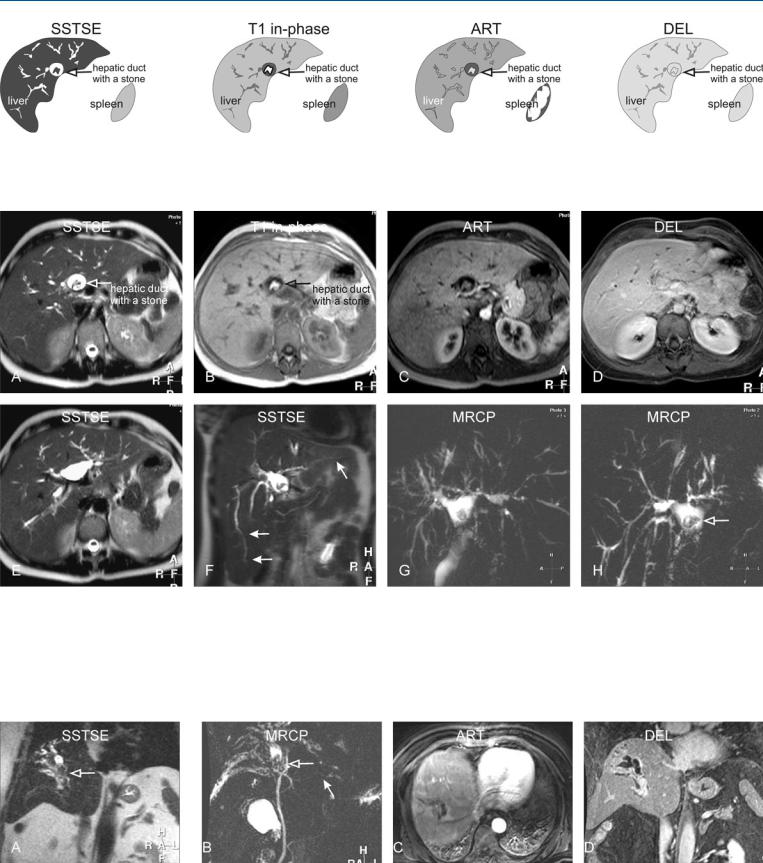
Fig. 105.1. Primary sclerosing cholangitis (PSC), drawings. SSTSE: bile ducts with long stenoses and dilatations; dilated hepatic duct with a large stone; T1 in-phase: the stone has a high signal, which suggests its high cholesterol
Fig. 105.2. Primary sclerosing cholangitis (PSC) with an intrahepatic stone, MRI findings. A Axial SSTSE image (SSTSE): bile ducts with long stenoses and dilatations, typical of PSC. Dilated hepatic duct contains a large stone (contrast sparing). B Axial in-phase image (T1 in-phase): The stone has a high signal (open arrow), which suggests high cholesterol content (cholesterol stone). C Axial arterial phase image (ART) shows slightly increased liver enhancement. D Axial delayed image (DEL): The liver shows homo-
content (cholesterol stone); ART: slight increased diffuse enhancement of the liver; DEL: the liver shows homogeneous enhancement
geneous enhancement. E Axial SSTSE image (SSTSE) at a slightly different anatomic level shows the dilated bile ducts at the bifurcation as well as intrahepatic ducts. F Coronal SSTSE image (SSTSE) shows the elongated bile ducts, which are a common finding in PSC (solid arrows). G and H MRCP (MRCP) provides an overview of the biliary tree with the stone in the hepatic duct (open arrow)
Fig. 105.3. PSC (another patient) complicated with a segmental PSC and intrahepatic stones, MR findings. A Coronal SSTSE shows dilated bile ducts with stones in segment VIII (open arrow). B MRCP shows typical PSC findings in the liver (solid arrow) and severe segmental involvement with stones (open
arrow). C Axial arterial phase image shows enhancement around the dilated ducts suggesting cholangitis. D Coronal delayed phase image shows homogeneous enhancement of the liver with segmental dilated bile ducts

226 Part V – Biliary Tree Abnormalities
106 Primary Sclerosing Cholangitis IV – With Biliary Cirrhosis
Primary sclerosing cholangitis (PSC) can result in obliterative fibrosis of small, medium, and large bile ducts, which in turn results in cholestasis with progression to secondary biliary cirrhosis and hepatic failure. The spectrum of MR imaging appearances of PSC with fibrosis or cirrhosis can be diverse and may be present in a majority of patients with long-standing PSC. Large central regenerative nodules, hypertrophy of the caudate lobe, and peripheral atrophy are frequent findings in patients with PSC and cirrhosis. This constellation of findings may result from the peripheral small-duct PSC initially, and gradually progressing to the larger, more central bile ducts (large-duct PSC). The combination of the dilated and the irregular bile duct and large regenerative nodules is often not found in other types of cirrhosis. MRCP and serial gadolinium-enhanced MR images are essential in demonstrating the full spectrum of imaging findings of PSC and should be acquired for a full assessment of this disease. MR imaging is an excellent modality for the surveillance of any complication of the biliary cirrhosis such as hepatocellular and cholangiocarcinoma.
Literature
1.Vitellas KM, Keogan MT, Freed KS, Enns RA, Spritzer CE, Baillie JM, Nelson RC (2000) Radiologic manifestations of sclerosing cholangitis with emphasis on MR cholangiopancreatography. Radiographics 20:959 – 975
2.Ito K, Mitchell DG, Outwater EK, et al. (1999) Primary sclerosing cholangitis: MR imaging features. AJR 172:1527 – 1533
3.Bader TR, Beavers KL, Semelka RC (2003) MR imaging features of primary sclerosing cholangitis: patterns of cirrhosis in relationship to clinical severity of the disease. Radiology 226:675 – 685
MR Imaging Findings
At MR imaging, increased peripheral parenchymal signal and atrophy can be seen on T2-weighted images. Hypertrophy with more normal parenchymal signal is present centrally on T1and T2weighted sequences. After injection of gadolinium, increased (heterogeneous) enhancement may be present in the peripheral and periportal regions due to the presence of cholangitis. This enhancement may fade or persist in the later phases. Heavily T2-weighted and MRCP sequences may show the abnormal bile ducts, ascites, splenomegaly, and collaterals (Figs. 106.1 – 106.3).
106 Primary Sclerosing Cholangitis IV – With Biliary Cirrhosis 227
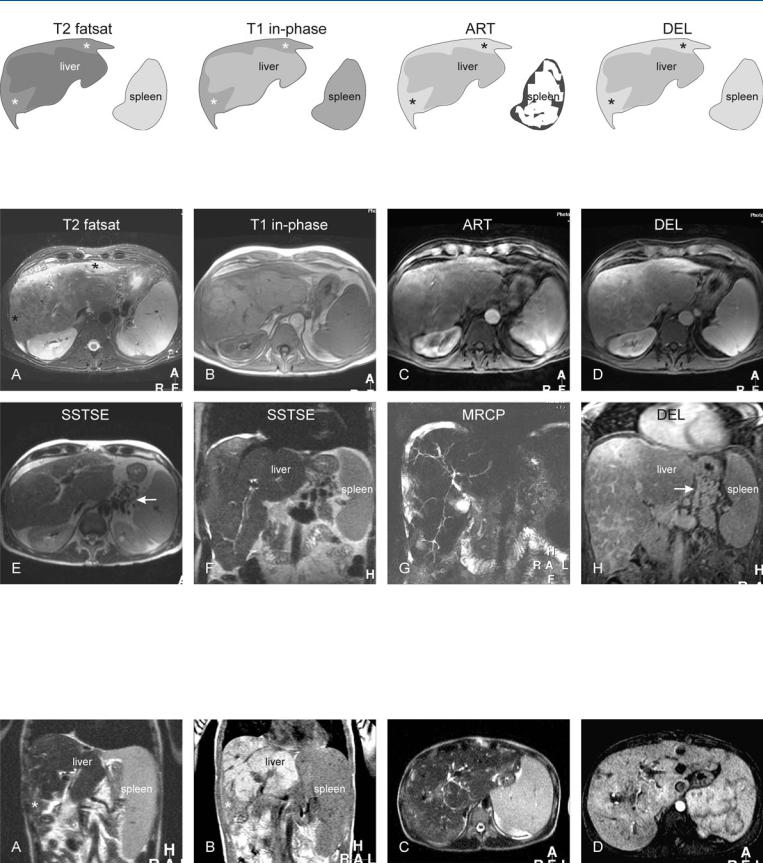
Fig. 106.1. Primary sclerosing cholangitis (PSC) with cirrhosis, drawings. T2 fatsat: peripheral atrophy with increased signal (*) and central hypertrophy is present; T1 in-phase: the central part with hypertrophy has a relatively nor-
Fig. 106.2. Primary sclerosing cholangitis (PSC) with cirrhosis, MRI findings. A Axial TSE image (T2 fatsat): Peripheral atrophy with increased signal (*) and central hypertrophy is present. B Axial in-phase image (T1 in-phase): The central part with hypertrophy has a relatively normal signal. C Axial arterial phase image (ART) shows increased diffuse enhancement in the periphery of the liver. D Axial delayed image (DEL) shows persistent peripheral and septal enhancement, which indicates the presence of cirrhosis. E Axial
mal signal; ART: increased diffuse enhancement is present in the periphery of the liver*; DEL: note persistent peripheral enhancement (*)
SSTSE image (SSTSE) shows collaterals (arrow), which is a sign of portal hypertension. F Coronal SSTSE image (SSTSE) shows the cirrhotic liver with an enlarged spleen, surrounded by ascites. G MRCP (MRCP) shows the biliary tree with typical appearance of severe PSC. H Axial delayed image (DEL) shows the septal enhancement, which indicates the presence of cirrhosis and collaterals (arrow)
Fig. 106.3. PSC (another patient) with cirrhosis, MR findings. A Coronal SSTSE shows cirrhotic liver with an enlarged spleen. Note the increased signal in the periphery (*). B Coronal T1-weighted in-phase image shows decreased signal in the periphery, consistent with peripheral atrophy (*). C Axial
SSTSE image shows the biliary tree with PSC. D Axial arterial phase image shows increased enhancement around the dilated ducts indicating cholangitis