


176 Part III – Diffuse (Depositional) Liver Diseases
83 Hemochromatosis with Solitary HCC
Hepatocellular carcinoma (HCC) is a well-known risk of hemochromatosis with or without cirrhosis. The presence of cirrhosis is not a prerequisite for the occurrence of HCC. Several reports indicate that iron may be involved in the pathogenesis of HCC. The risk of HCC appears to be related to the amount and duration of iron overload. Iron, which has been demonstrated to facilitate persistent hepatitis B or C infection, could also act as a co-factor in the pathogenesis of HCC in patients with hepatitis B or C and subsequent cirrhosis. Among the possible mechanisms by which iron could exert its carcinogenic potential, free radicals production responsible for heritable genetic alterations appears to be one of the most important, although the fibrogenic capability of iron, potentially leading to cirrhosis, cannot be underestimated. Iron overload is often discovered at blood tests with an elevation of serum iron, transferrin saturation or ferritinemia or by doing family studies.
Literature
1.Lwakatare F, Hayashida Y, Yamashita Y. (2003) MR imaging of hepatocellular carcinoma arising in genetic hemochromatosis. Med Reson Med Sci 2:57 – 59
2.Fargion S, Mandelli C, Piperno A, et al. (1992) Survival and prognostic factors in 212 Italian patients with genetic hemochromatosis. Hepatology 15:655 – 659
3.Fargion S, Piperno A, Fracanzani AL, et al. (1991) Iron in the pathogenesis of hepatocellular carcinoma.Ital J Gastroenterol 23:584 – 588
4.Ito K, Mitchell DG, Gabata T, et al. (1999) Hepatocellular carcinoma: association with increased iron deposition in the cirrhotic liver at MR imaging. Radiology 212:235 – 240
MR Imaging Findings
The presence of the parenchymal iron basically reduces the signal intensity of the liver on T2and T2*-weighted sequences, which makes the MR imaging an ideal imaging modality to detect HCC in the setting of hemochromatosis. Compared to the livers without iron deposition, HCC nodule appears much brighter on T2-weight- ed images. In addition, the effect of enhancement on the gradient echo images, which contain T2*-weighting, is much more obvious (Figs. 83.1, 83.2).
Pathology
On gross pathology, the liver with iron deposition appears brown and the HCC appears as a yellowish nodule. At histology, the presence of iron can be shown with Iron Perls staining. HCC may show glandular formation (Fig. 83.3).
Management
The risk for both cirrhosis as well as HCC can be reduced by repeated phlebotomies. The patients with HCC may receive palliative chemotherapy.
83 Hemochromatosis with Solitary HCC 177
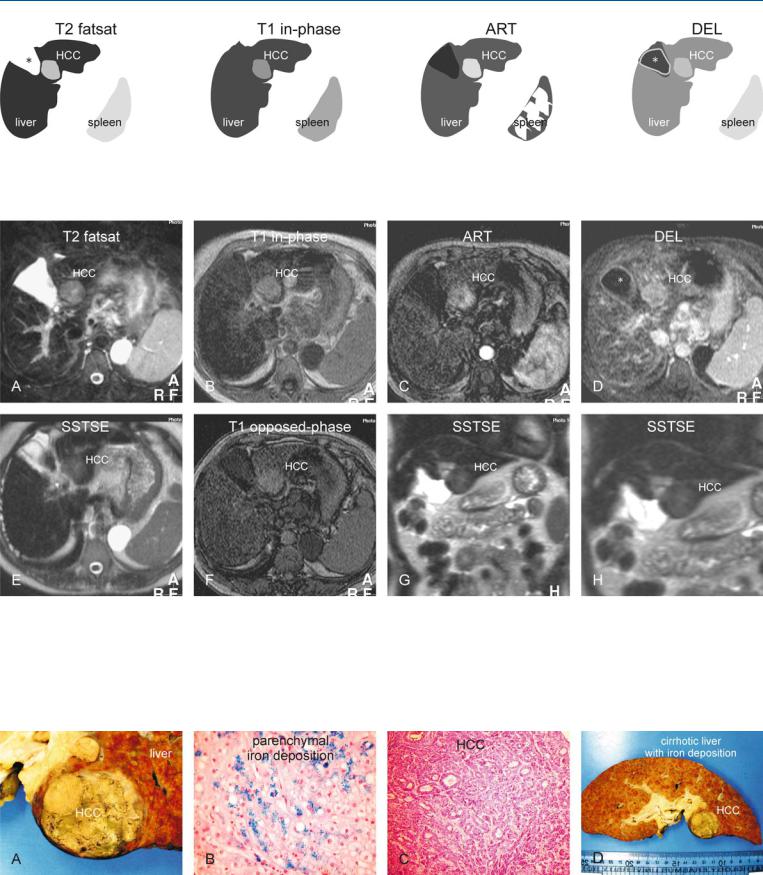
Fig. 83.1. HCC, hemochromatosis, cirrhosis. T2 fatsat: HCC appears as a bright nodule within a dark liver due to iron deposition; the spleen has normal signal. The empty gallbladder fossa is caused by the atrophy of segment IV (*).
Fig. 83.2. HCC, hemochromatosis, cirrhotic liver, MRI findings. A Axial fat-sup- pressed TSE image (T2 fatsat): HCC appears as a bright nodule in an unusually dark liver due to the T2* effect of the iron within hepatocytes (hemochromatosis). The cirrhotic liver is irregular with atrophy of segment IV. The spleen has a normal signal intensity. B Axial in-phase image (T1 inphase): HCC is bright in an unusually dark liver due to iron deposition. C Axial arterial phase image (ART): HCC shows heterogeneous enhance-
T1 in-phase: HCC appears bright due to unusually dark liver; ART: HCC shows heterogeneous enhancement; DEL: HCC remains visible due to the unusually dark liver. Gallbladder (*)
ment. D Axial delayed phase image (DEL): HCC shows some washout but remains visible due to the darker liver. Gallbladder (*). E Axial SSTSE image with a TE of 120 ms (T2 axial): HCC is slightly hyperintense to the liver. F Axial T1 opposed-phase image (T1 opposed-phase): HCC is slightly brighter than the liver. G Coronal SSTSE image (SSTSE): HCC is slightly brighter than the unusually dark liver. H A detailed view of the coronal SSTSE image (SSTSE): HCC is slightly brighter than the liver
Fig. 83.3. HCC, cirrhosis, hemochromatosis, direct MR-explant correlation. A Photograph shows brown, cirrhotic liver with HCC. B Photomicrograph of another patient shows blue staining iron particles within hepatocytes (hemo-
chromatosis). Iron Perls’, × 200. C Photomicrograph of the HCC shown above: large glandular structures indicate cholangiolar type of HCC, hence the bright T2 appearance. H&E, × 100. D Photograph of the explant with HCC
178 Part III – Diffuse (Depositional) Liver Diseases
84 Hemochromatosis with Multiple HCC
Multiple hepatocellular carcinoma (HCC) may occur in the setting of hemochromatosis. Familiarity with this entity is important for radiologists because the lesions may mimic secondary liver lesions, especially if the signs of cirrhosis such as changed morphology of the liver include irregular contours, atrophy of certain segments (usually segment IV), central atrophy, and hypertrophy of other segments. Also the signal intensity on T2-weighted sequences as well as the enhancement patterns may be deceptive.
MR Imaging Findings
The presence of parenchymal as well as intralesional iron on T2*- weighted gradient echo [for instance, opposed- (short TE) and inphase (long TE)] sequences is essential for the diagnosis of multiple HCC in the setting of hemochromatosis. Due to the longer TE value, the signal intensity of the lesions as well as the lesions on the inphase images drops. Relatively high signal intensity of lesions on T2-weighted images and intense heterogeneous enhancement on the arterial phase images may resemble hypervascular liver metastases of, for instance, neuroendocrine origin (pancreatic as well as carcinoid) (Figs. 84.1, 84.2). Metastases do not show signal loss because they will be composed of non-hepatic tissue which will not contain iron.
Literature
1.Lwakatare F, Hayashida Y, Yamashita Y (2003) MR imaging of hepatocellular carcinoma arising in genetic hemochromatosis. Med Reson Med Sci 2:57 – 59
2.Fargion S, Mandelli C, Piperno A, et al. (1992) Survival and prognostic factors in 212 Italian patients with genetic hemochromatosis. Hepatology 15:655 – 659
3.Fargion S, Piperno A, Fracanzani AL, et al. (1991) Iron in the pathogenesis of hepatocellular carcinoma. Ital J Gastroenterol 23:584 – 588
4.Ito K, Mitchell DG, Gabata T, et al. (1999) Hepatocellular carcinoma: association with increased iron deposition in the cirrhotic liver at MR imaging. Radiology 212:235 – 240
Pathology
On gross pathology, the liver with iron deposition appears brown and the HCC appears as a yellowish nodule. At histology, HCC may show glandular formation (Fig. 84.3).
84 Hemochromatosis with Multiple HCC 179
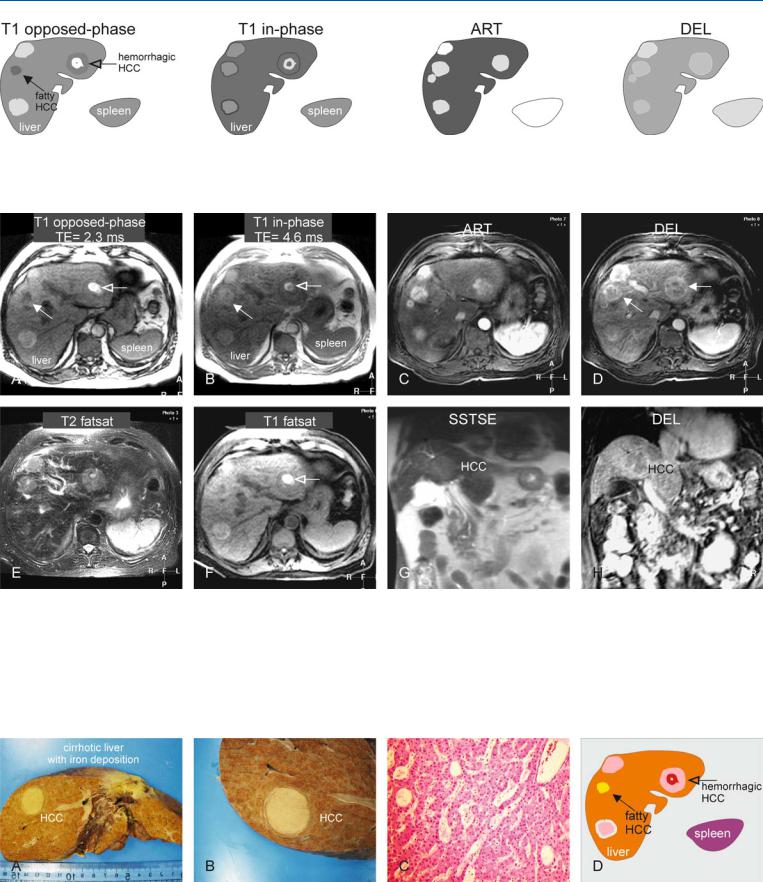
Fig. 84.1. HCC, hemochromatosis, cirrhosis. T1 opposed phase: HCCs predominantly appear brighter to the liver, though one is fatty (solid arrow) and another is hemorrhagic (open arrow); T1 in-phase: the liver has decreased
Fig. 84.2. HCC, hemochromatosis, cirrhosis, multiple lesions, MRI findings. A Axial T1 opposed-phase image (T1 opposed-phase): The liver is isoto hypointense to the spleen. HCCs predominantly appear brighter, though one is fatty (solid arrow) and another hemorrhagic (open arrow). B Axial in-phase image (T1 in-phase): The liver becomes slightly darker with the longer TE with numerous small dark siderotic nodules (hemochromatosis). C Axial arterial phase image (ART): HCCs show intense heterogeneous enhancement. D Axial delayed phase image (DEL): HCCs show washout and become more
in signal due to iron deposition; ART: HCCs predominantly show intense heterogeneous enhancement; DEL: HCCs show washout and become more heterogeneous with faint capsular enhancement
heterogeneous with faint capsular enhancement. E Axial fat-suppressed T2- w image (T2 fatsat): HCCs are brighter in a dark liver. The spleen has normal size and signal. F Axial fat suppressed T1-w image (T1 fatsat): The hemorrhage within one of the HCCs (open arrow) remains bright, indicating that the high signal is not caused by a large amount of fat. G Axial SSTSE image (SSTSE): One of the HCCs is just visible. H Coronal delayed phase image (DEL): One of the HCCs is visible with washout
Fig. 84.3. HCC, hemochromatosis, cirrhosis, histopathology (from a different patient). A Photograph shows a siderotic and cirrhotic liver containing a large HCC. B A detailed photograph shows sharp margination of HCC to the liver.
C Photomicrograph: large glandular structures indicate cholangiolar type of HCC, which appear bright on T2-weighted images. H&E, × 100. D Drawing explains the findings of MRI above