


80 Part IIC – Primary Solid Liver Lesions in Cirrhotic Liver
37 Cirrhosis III – Dysplastic Nodules
Cirrhotic livers may contain various types of nodules including regenerative nodules, dysplastic nodules, and hepatocellular carcinoma (HCC). These nodules are part of the stepwise carcinogenesis of HCC, which is based on increasing cellularity and size of the liver lesion. In 1995, an International Working Party of Gastroenterology proposed a terminology in which dysplastic features of the hepatic nodule were expressed. The currently accepted nomenclature in stepwise carcinogenesis of HCC is regenerative nodule →low grade dysplastic nodule →high grade dysplastic nodule →small HCC → large HCC. Dysplastic lesions are composed of hepatocytes which show histologic characteristics of abnormal growth caused by presumed or proved genetic alteration. Dysplastic nodules include dysplastic focus and dysplastic nodule. Dysplastic focus is defined as a cluster of hepatocytes less than 1 mm in diameter with dysplasia but without definite histologic criteria of malignancy. Dysplasia indicates the presence of nuclear and cytoplasmic changes, such as minimal to severe nuclear atypia and increased amounts of cytoplasmic fat or glycogen, within the cluster of cells that compose the focus. Dysplastic foci are common in cirrhosis.
Literature
1.International Working Party (1995) Terminology of nodular hepatocellular lesions. Hepatology 22:983 – 993
2.Hussain SM, Zondervan PE, et al. (2002) Benign versus malignant hepatic nodules: MR imaging findings with pathologic correlation. Radiographics 22:1023 – 36
3.Van den Bos IC, Hussain SM, Terkivatan T, et al. (2006) Step-wise carcinogenesis of hepatocellular carcinoma in the cirrhotic liver: demonstration on serial MR imaging. JMRI (in press)
MR Imaging Findings
At MR imaging, the signal intensity and enhancement characteristics of the dysplastic nodules are not yet well established. Due to a gradual stepwise transition from a regenerative nodule into a lowgrade dysplastic nodule, a high-grade dysplastic nodule, and eventually into a small and a large HCC, the hepatocytes within hepatic nodules undergo numerous changes that might not be reflected in their signal intensity or vascularity. So, current MRI sequences might not be able to distinguish regenerative nodules from dysplastic nodules with certainty. A majority of high-grade dysplastic lesions and well-differentiated small HCC may have high signal intensity on T1-weighted images. Other findings associated with dysplastic nodules may be fat accumulation, gradual increase in size, increased signal intensity, and increased enhancement (Figs. 37.1 – 37.3).
Management
In a cirrhotic liver, any nodule with increased size, changed signal intensity, and increased enhancement warrants clinical correlation with alpha-fetoprotein and follow-up with MR imaging.
37 Cirrhosis III – Dysplastic Nodules 81
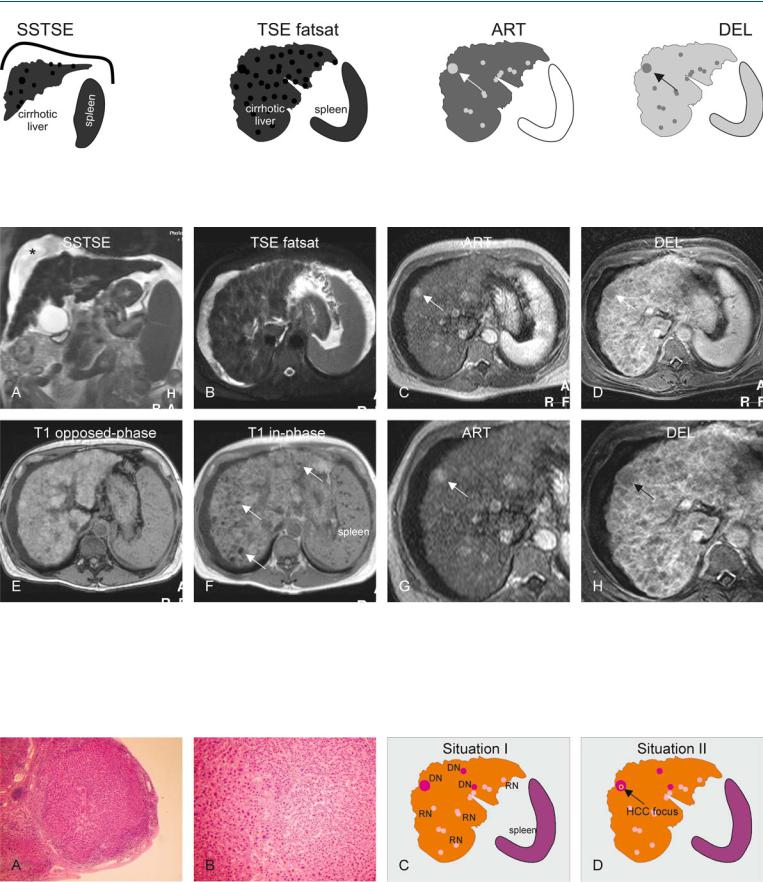
Fig. 37.1. Dysplastic nodules, cirrhotic liver, drawings. Coronal SSTSE: multiple low signal intensity nodules are visible in a cirrhotic liver with ascites. TSE fatsat: all nodules have low signal intensity; ART: the largest nodule (arrow)
Fig. 37.2. Dysplastic nodules, cirrhotic liver, MRI findings. A Coronal SSTSE image (SSTSE): Multiple low signal intensity nodules are present with a cirrhotic liver with splenomegaly and ascites (*). B Axial fat-suppressed TSE image (TSE fatsat): All nodules show low signal intensity. C Axial arterial phase image (ART): The largest nodule shows increased enhancement (arrow); other lesions show variable enhancement. D Axial delayed phase image (DEL): The largest nodule (arrow) does not show any enhancing tu-
shows increased enhancement; other nodules show variable enhancement; DEL: the largest (arrow) as well as other nodules do not show any tumor capsule
mor capsule. E Axial opposed-phase image (T1 opposed-phase): Most hepatic nodules are bright. F Axial in-phase image (T1 in-phase): Several nodules lose their signal due to iron accumulation, i.e. siderotic nodules (arrows); note also the dark Gamna-Gandy bodies in the spleen. G Detailed view of the arterial phase (ART): The largest nodule clearly shows enhancement (arrow). H Detailed view of the delayed phase (DEL): The largest nodule does not show a tumor capsule (arrow)
Fig. 37.3. Dysplastic nodules, histopathology, drawings. A Photomicrograph shows a large nodule surrounded by fibrous septa. H&E stain, × 20. B A detailed photomicrograph shows increased cellularity with variable size of the nuclei indicating at least dysplastic changes. H&E stain, × 100. C Situation I
shows the presence of several dysplastic (DN) and regenerative (RN) nodules in a cirrhotic liver. D Situation II shows the presence of a focus of HCC with the largest DN (arrow)

82 Part IIC – Primary Solid Liver Lesions in Cirrhotic Liver
38 Cirrhosis IV – Dysplastic Nodules – HCC Transition
Developing hepatocellular carcinoma (HCC) in cirrhosis can be demonstrated on serial MR imaging. State-of-the-art MR imaging may show a spectrum of findings in the initial detection of developing HCC, including (1) localized fatty infiltration within a developing dysplastic nodule that gradually evolves into HCC in combination with a slowly increasing alpha-fetoprotein (AFP); (2) development of a focus of HCC with high signal intensity on T2-weighted imaging within a dysplastic nodule; and (3) prominent neovasculature. These findings confirm the stepwise carcinogenesis of HCC is regenerative nodule → low grade dysplastic nodule → high grade dysplastic nodule → small HCC → large HCC. MR imaging should be the modality of choice for the evaluation and follow-up of patients with cirrhosis.
Literature
1.Van den Bos IC, Hussain SM, Terkivatan T, et al. (2006) Step-wise carcinogenesis of hepatocellular carcinoma in the cirrhotic liver: demonstration on serial MR imaging. JMRI (in press)
2.Sakamoto M, Hirohashi S, Shimosato Y (1991) Early stages of multistep hepatocarcinogenesis: adenomatous hyperplasia and early hepatocellular carcinoma. Hum Pathol 22:172 – 178
3.Mitchell DG, Rubin R, Siegelman ES, et al. (1991) Hepatocellular carcinoma within siderotic regenerative nodules: appearance as a nodule within a nodule on MR images. Radiology 178:101 – 103
4.Ito K, Fujita T, Shimizu A, et al. (2004) Multiarterial phase dynamic MRI of small early enhancing hepatic lesions in cirrhosis or chronic hepatitis: differentiating between hypervascular hepatocellular carcinomas and pseudolesions AJR 183:699 – 705
MR Imaging Findings
At MR imaging, developing HCC may be associated with fat accumulation (visible on inand opposed-phase imaging), gradual increase in size, increased signal intensity on T2-weighted images with a nodule-in-nodule appearance, and increased enhancement in the arterial phase, and washout with enhancement of a tumor capsule in the delayed phase imaging of the dynamic gadoliniumenhanced imaging. These observations can only be made optimally if the MR imaging protocol includes a number of important sequences such as chemical shift imaging, T2-weighted imaging with and without fat suppression, and dynamic gadolinium-enhanced imaging (Figs. 38.1 – 38.3).
Differential Diagnosis
The differential diagnosis of small enhancing lesions within livers with hepatitis or cirrhosis includes dysplastic nodule, small HCC, arterioportal shunt, and pseudolesions (i.e., areas with non-specific transient increased enhancement). Follow-up MR imaging facilitates differentiation.

38 Cirrhosis IV – Dysplastic Nodules – HCC Transition 83
Fig. 38.1. Dysplastic nodules (DN)-HCC transition in a patient with hepatitis C for > 20 years. T2 fatsat: no lesions are visible; T1 inand op-phase: a small focus of fatty infiltration suggests a nodule with fat (arrow); ART: the nodule
Fig. 38.2. DN-HCC transition in a patient with hepatitis C for > 20 years, MRI findings. A Axial fat-suppressed T2-w TSE image (T2 fatsat): No lesions are visible. B Axial T1-in- and opposed-phase images (T1-in and op): A small focus of decreased signal (arrow) suggests a nodule with fatty infiltration. C Axial arterial phase image (ART): The nodule appears hypointense due to fat suppression; no apparent enhancement is present. D Axial delayed phase image (DEL): The nodule (arrow) remains hypointense. E (Patient refused a fol- low-up MRI at 3 months and came back after 1 year.) Axial fat-suppressed
is hypointense due to fat suppression (arrow); no apparent enhancement is visible; DEL: the nodule remains hypointense (arrow)
TSE image (T2 fatsat): no lesions are visible. F Axial T1-in- and opposedphase images (T1-in and op): The nodule has increased in size on the opposed phase image (arrow). G Axial arterial phase image (ART): The nodule shows some enhancement (arrow). H Axial delayed phase image (DEL): The nodule (arrow) may have some washout. The findings suggest at least a dysplastic nodule with a focus of HCC (patient refused liver transplantation or resection)
Fig. 38.3. DN-HCC transition, follow-up MRI. A Axial fat-suppressed TSE image (T2 fatsat): a large hyperintense lesion (arrow). B Axial T1-in- and opposedphase images (T1-in and op): No signs of fatty infiltration are present in the large lesion (arrows). C Axial arterial phase image (ART): The nodule shows
intense (almost) homogeneous enhancement (arrow). D Axial delayed phase image (DEL): The nodule is surrounded by a tumor capsule (arrow). The findings are consistent with an HCC