


126 Part IID – Primary Solid Liver Lesions in Non-Cirrhotic Liver
59Focal Nodular Hyperplasia VI – Atypical with T2 Dark Central Scar
Focal nodular hyperplasia (FNH) may show more than one atypical feature at MR imaging and cause difficulty in diagnosis. Such lesions may mimic other primary liver lesions including hepatocellular carcinoma (HCC) in a non-cirrhotic liver. In Europe and North America, a large percentage (up to 40 %) of HCCs may occur in non-cirrhotic livers and form a differential diagnostic problem with atypical benign primary liver lesions including atypical FNH. HCC in non-cirrhotic liver often presents as a solitary large lesion with a central scar with variable signal intensity on T2-weighted images. Knowledge of the appearance of atypical FNH may help to avoid unnecessary anxiety, follow-ups with US and CT, and surgery for the patient.
Literature
1.Terkivatan T, Van den Bos IC, Hussain SM, et al. (2006) Focal nodular hyperplasia: lesion characteristics on state-of-the-art MRI including dynamic gadolinium-enhanced and superparamagnetic iron-oxide-up- take sequences in a prospective study. JMRI 24:864 – 872
2.Hussain SM, Zondervan PE, et al. (2002) Benign versus malignant hepatic nodules: MR imaging findings with pathologic correlation. Radiographics 22:1023 – 36
3.Hussain SM, Semelka RC, Mitchell DG (2002) MR imaging of hepatocellular carcinoma. Magn Reson Imaging Clin N Am 10:31 – 52
MR Imaging Findings
At MR imaging, atypical FNH may have exceptionally high signal intensity on T2-weighted images with suggestion of lamella, a central scar with low signal intensity on T2-weighted images, a prominent pseudocapsule, and incomplete intense enhancement of the lesion (Figs. 59.1, 59.2). In such cases, the application of the specific type of contrast media may confirm the hepatocellular origin of the lesion. With an homogeneous uptake of such agents in combination with a normal alpha-fetoprotein and viral serology, the patients may be followed with MR imaging safely. If any doubt remains, US-guided biopsy should be carried out of the lesion as well as the surrounding liver to exclude malignancy and cirrhosis.
Management
HCC in non-cirrhotic liver and fibrolamellar carcinoma should be excluded in atypical FNH by means of follow-up with MR imaging and US-guided biopsy. HCC in non-cirrhotic livers may show a T2-dark central scar, but signal intensity on T1and T2-weighted images, as well as the enhancement pattern, is quite different from atypical FNH, which may rarely resemble the MR imaging appearance of an orange (Fig. 59.3). Surgery is justified in patients with inconclusive imaging findings or biopsy.
59 Focal Nodular Hyperplasia VI – Atypical with T2 Dark Central Scar 127
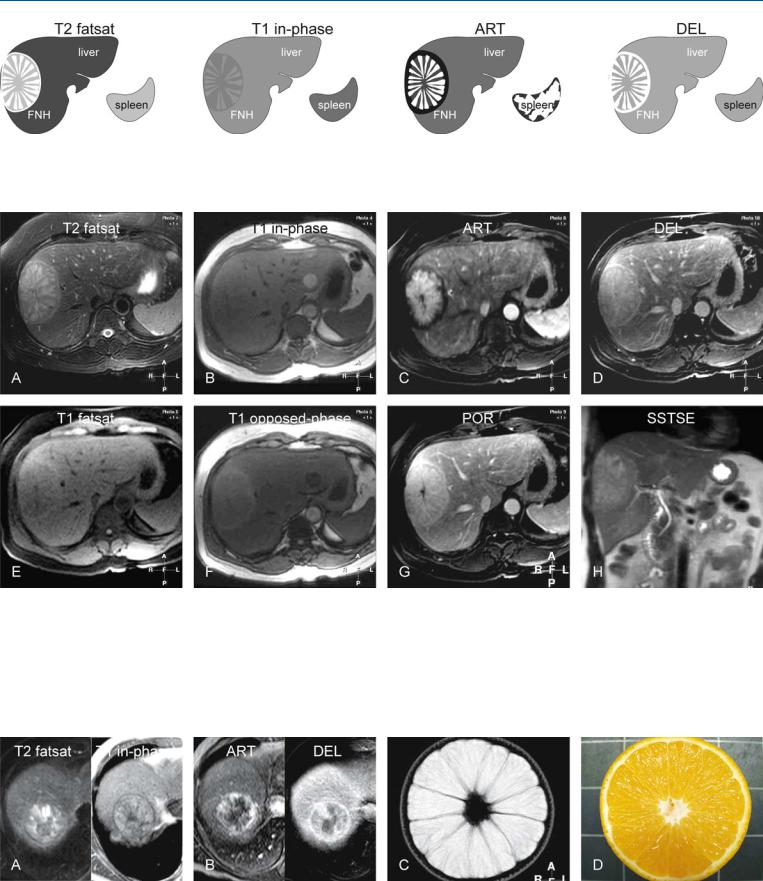
Fig. 59.1. FNH, very bright on T2 and with a dark central scar, drawings. T2 fatsat: FNH is very bright to the liver with a spoke-wheel configuration; note also the bright pseudocapsule and a dark central scar; T1 in-phase: FNH is pre-
Fig. 59.2. FNH, very bright on T2 with a dark central scar, MRI findings. A Axial TSE image (T2 fatsat): FNH is very bright to the liver with a spoke-wheel configuration; note also the bright pseudocapsule and a dark central scar. B Axial in-phase image (T1 in-phase): FNH is predominantly isointense to the liver. C Axial arterial phase image (ART): FNH shows intense enhancement in the spoke-wheel part. D Axial delayed phase image (DEL): FNH shows almost homogeneous enhancement, including the central scar and the pseudocapsule. E Axial fat-suppressed GRE image (T1 fatsat): FNH is
dominantly isointense to the liver; ART: FNH shows in part intense enhancement; DEL: FNH shows almost homogeneous enhancement, including the central scar and the pseudocapsule
slightly hypointense to the liver. F Axial opposed-phase image (T1 opposedphase) shows diffuse fatty infiltration in the liver; therefore FNH appears relatively brighter. G Axial portal phase image (POR): The central scar is not fully enhanced yet and is still visible. H Coronal SSTSE image (SSTSE) shows the FNH within a normal liver with smooth contours and normal bile ducts. During a 2-year follow-up, FNH remained completely unchanged and showed uptake of SPIO on one of the MRI examinations
Fig. 59.3. HCC with a dark central scar (another patient), MRI findings, and MR-or- ange correlation. A Axial TSE image (T2 fatsat): HCC is heterogeneous and shows a dark central scar; T1 in-phase image shows HCC surrounded by dark tumor capsule. B Axial arterial (ART) and delayed (DEL) phase images
show heterogeneous enhancement with washout and capsular enhancement. C and D show a T2-weighted MR image and the cross section of an orange with striking similarity to the FNH shown above
128 Part IID – Primary Solid Liver Lesions in Non-Cirrhotic Liver
60 Hepatic Angiomyolipoma – MR-CT Comparison
Angiomyolipoma (AML) is a benign, unencapsulated mesenchymal tumor that is composed of varying proportions of three elements: smooth muscle cells, thick-walled blood vessels, and mature adipose tissue. Renal AMLs are associated with tuberous sclerosis in 20 % of patients, whereas hepatic AMLs are associated with tuberous sclerosis in only 6 %. Hepatic AMLs may mimic other primary hypervascular, fat-containing hepatic lesions including hepatocellular adenomas (may contain fat in up to 78 %) and hepatocellular carcinomas (may contain fat in up to 10 %). However, hepatic AMLs often occur in conjunction with renal AMLs. Chemical shift MR imaging was recently shown to have high sensitivity and specificity (96 % and 93 %, respectively) for renal AMLs with minimal fat. Therefore, MR imaging should also be applied in patients who are known to have renal AMLs and present with hepatic lesions.
Literature
1.Worawattanakul S, Semelka RC, Kelekis NL, et al. (1996) Hepatic angiomyolipoma with minimal fat content: MR demonstration. MRM 14: 687 – 689
2.Ahmadi T, Itai Y, Takahashi M, et al. (1998) Angiomyolipoma of the liver: significance of CT and MR dynamic study. Abdom Imaging 23:520 – 526
3.Balci NC, Akinci A, Akun E, et al. (2002) Hepatic angiomyolipoma: demonstration by out of phase MRI. Clin Imaging 26:418 – 420
4.Kim JK, Kim SH, Jang YJ, et al. (2006) Renal angiomyolipoma with minimal fat: differentiation from other neoplasms at double-echo chemical shift FLASH MR imaging. Radiology 239:174 – 180
MR Imaging Findings
At MR imaging, multiple lesions may be present with somewhat variable but predominantly high signal intensity on T2-weighted sequences. In addition, on fat-suppressed T2-weighted images the lesions contain areas with low signal intensity likely due to muscle and fat components. Chemical shift (inand opposed-phase) imaging however provides specific information by showing a small amount of fat in the lesions which lowers the signal intensity on the opposed-phase imaging. The lesions show intense heterogeneous enhancement in the arterial phase. The enhancement may be somewhat decreased but grossly persists in the delayed phase (Figs. 60.1, 60.2). The findings on CT are often non-specific mainly because CT is insensitive to the small amount of fat with hepatic AMLs (Fig. 60.3).
Differential Diagnosis
Fatty hepatocellular adenomas (HCAs) and carcinomas (HCCs) differ considerably in tumor morphology and enhancement from hepatic AMLs. HCAs are near isointense on T1and T2-weighted images, and show homogeneous enhancement, fading to isointensity in the delayed phase. Small multiple fat-containing HCCs typically occur in cirrhotic livers, have a mosaic pattern on T1and T2-weighted images, and show washout with capsular enhancement in the delayed phase. Liposarcoma and teratoma are very rare fat-containing hepatic tumors.
60 Hepatic Angiomyolipoma – MR-CT Comparison 129
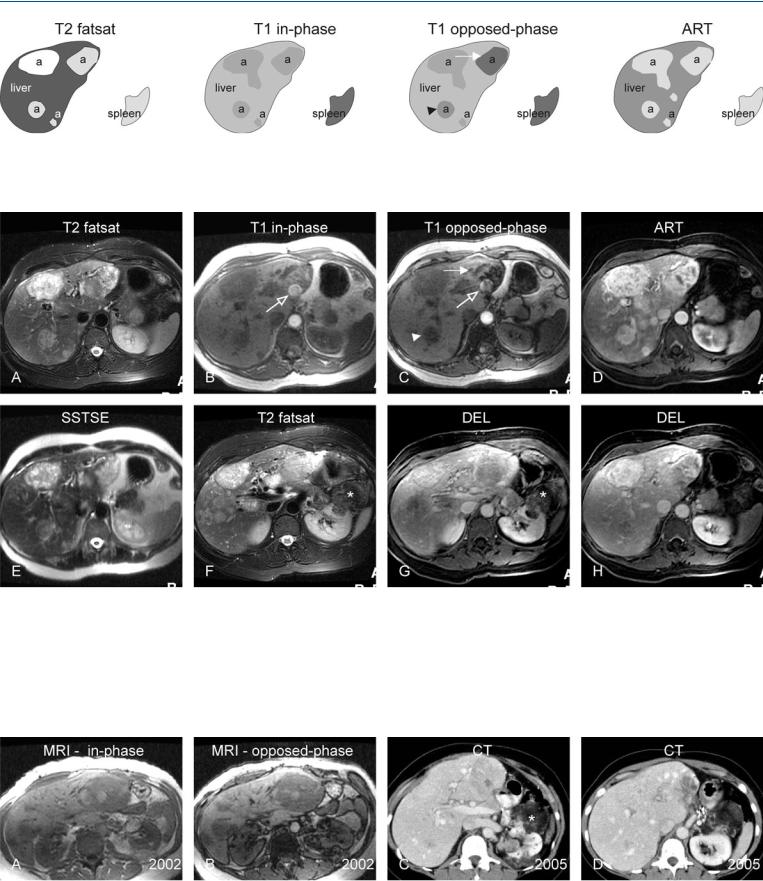
Fig. 60.1. Hepatic angiomyolipoma (a), drawings. T2 fatsat: multiple angiomyolipomas show predominantly hyperintense signal to the liver; T1 in-phase: lesions show predominantly hypointense signal to the liver; T1 opposed-
Fig. 60.2. Hepatic angiomyolipoma, MRI findings. A Axial TSE image (T2 fatsat): multiple angiomyolipomas show predominantly hyperintense signal to the liver. B Axial in-phase image (T1 in-phase): lesions show predominantly hypointense signal to the liver. Aortic pulsation artifact (open arrow). C Axial opposed-phase image (T1 opposed-phase): One lesion shows marked (solid arrow) and another mild (arrowhead) signal loss due to variable fatty content. Aortic pulsation artifact (open arrow). D Axial arterial phase image (ART): angiomyolipomas show intense heterogeneous enhancement. E Axi-
phase: one lesion shows marked (solid arrow) and another mild (arrowhead) signal loss due to variable fatty content; ART: angiomyolipomas show intense heterogeneous enhancement
al SSTSE image (SSTSE) image: multiple angiomyolipomas show predominantly hyperintense signal to the liver. F Axial TSE image (T2 fatsat) image at a different level: Note a large fat-containing renal angiomyolipoma (*). G Axial delayed phase image (DEL): hepatic and renal (*) angiomyolipomas show similar enhancement. H Axial delayed phase image (DEL) image at a different level: hepatic angiomyolipomas show similar enhancement in parts of the tumors
Fig. 60.3. Hepatic angiomyolipoma, MRI findings (same examination as above) with follow-up CT. A, B Axial inand opposed-phase images show multiple angiomyolipomas with more fatty content and signal loss in renal lesions.
C, D Contrast-enhanced CTs (3 years after MRI examination) at two different levels show the essentially unchanged size and appearance of the renal (*) and hepatic lesions