


36 Part IIA – Metastases: Colorectal
17 Colorectal Metastases I – Typical Lesion
Metastases are the most common malignant tumors of the liver in Western countries. Liver metastases usually appear as solitary or multiple lesions. Unlike many other cancers, the presence of distant metastases from colorectal cancer does not preclude curative treatment. About 25 % of patients with colorectal liver metastases have no other distant metastases. Of these 10 – 25 % are candidates for surgical resection. For the 75 – 90 % of patients with liver metastases who are not amenable to surgery, several new minimally invasive treatments are available such as radiofrequency ablation, stereotactic radiation therapy, and systemic chemotherapy.
Literature
1.Outwater E, Tomaszewski JE, Daly JM, et al. (1991) Hepatic colorectal metastases: Correlation of MR imaging and pathologic appearance. Radiology 180:327 – 332
2.Semelka RC, Cance WG, Marcos HB, et al. (1999) Liver metastases: comparison of current MR techniques and spiral CT during arterial portography for detection in 20 surgically staged cases. Radiology 213:86 – 91
3.Hussain SM, Semelka RC (2005) Liver masses. Magn Reson Imaging Clin N Am 13:255 – 275
MR Imaging Findings
At MR imaging, most colorectal carcinoma liver metastases have a target-like appearance. The lesions have predominantly low signal intensity on T1-weighted images and moderately high signal intensity on T2-weighted images with fat suppression. On T2-weighted images, the internal tumor anatomy has a target-like configuration:
(a) the highest (fluid-like) signal intensity is in the center of the lesion due to coagulative necrosis; (b) there is a lower signal intensity in a relatively broad zone outside the center due to the presence of desmoplastic reaction, which mainly forms the tumor matrix; and
(c) again there is a slightly higher signal intensity in the outermost zone (growing edge) due to more compact tumor cells with more vessels and less desmoplasia. The growing edge of the colorectal metastases is usually very thin. Some lesions may also be surrounded by edema within the surrounding compressed liver parenchyma. After administration of gadolinium, most colorectal metastases show an irregular continuous ring-shaped (as opposed to the broken ring or peripheral nodular enhancement of hemangioma) enhancement in the arterial phase. This ring-shaped enhancement represents the vascularized growing edge of the lesion. In the portal and delayed phase the metastases often show washout in the outer parts with progressive enhancement toward the center of the lesions (Figs. 17.1 – 17.3). Larger lesions may show heterogeneous, cauliflower like enhancement.
Differential Diagnosis
Benign (small) liver lesions such as cysts (see p. 6), biliary hamartomas (see p. 4), hemangiomas (see p. 18), and focal nodular hyperplasia (see p. 116) are common liver entities, which may coexist with the metastatic lesions and form a common differential diagnostic problem. State-of-the-art MR imaging is highly accurate in distinguishing malignant from benign liver lesions.
17 Colorectal Metastases I – Typical Lesion 37
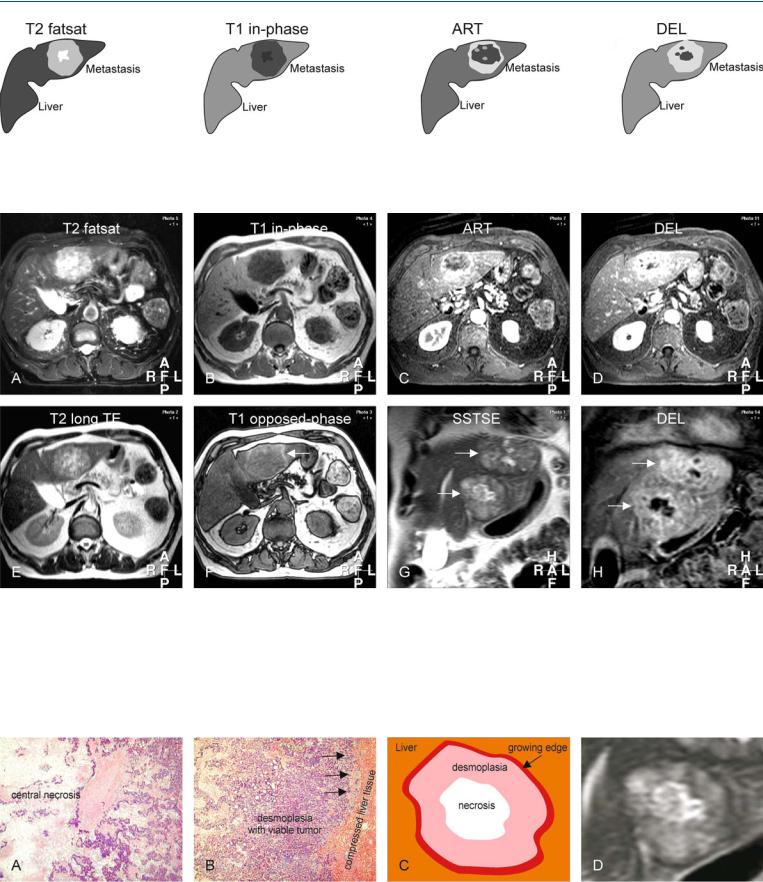
Fig. 17.1. Metastasis, colorectal, drawings. T2 fatsat: metastasis is predominantly hyperintense to the liver with a brighter center; T1 in-phase: metastasis is hypointense to the liver; ART: metastasis shows a typical irregular
Fig. 17.2. Metastasis, colorectal, MRI findings. A Axial fatsat T2-w turbo spin echo (TSE) image (T2 fatsat): Metastasis is predominantly hyperintense to the liver with a brighter center. B Axial in-phase T1-w gradient recalled echo (GRE) (T1 in-phase): Metastasis is hypointense to the liver. C Axial arterial phase post-Gd 3D T1-w GRE image (ART): Metastasis shows typical irregular ring-shaped enhancement. D Axial delayed phase image (DEL): metastasis becomes more heterogeneous. E Axial T2-w single-shot TSE (SSTSE) image with an echo time (TE) of 120 ms (T2 longer TE): Metastasis shows a
ring-shaped enhancement; DEL: metastasis shows heterogeneous enhancement
lower signal in the outer parts indicating the solid nature. F Axial opposedphase T1-w GRE image (T1 opposed-phase) shows a signal drop in the liver indicating steatosis. Metastasis becomes isointense with persistent high perifocal signal due to compressed liver (arrow). G Coronal T2-w SSTSE (SSTSE) shows two identical metastases with typical tumor anatomy (arrows). H Coronal delayed phase image (DEL) clearly shows the less enhanced central parts of the metastases (arrows)
Fig. 17.3. Metastasis, colorectal, tumor anatomy. A Photomicrograph from the central part of a metastasis shows the less vascularized coagulative necrosis. H&E, × 100. B Photomicrograph from the outer part shows the desmoplasia
with viable tumor tissue and the growing edge (arrows). H&E, × 100. C Drawing illustrates the tumor anatomy. D A detailed view of the axial SSTSE image shows the metastasis anatomy in-vivo
38 Part IIA – Metastases: Colorectal
18 Colorectal Metastases II – Typical Multiple Lesions
Colorectal metastases can occur as multiple lesions. Unlike many other cancers, the presence of multiple colorectal metastases does not preclude curative treatment. Therefore, it is important to detect and characterize the liver lesions with the best possible imaging modality available today. MR imaging should be the modality of choice because it can make a distinction between very small metastases and benign liver lesions such as small cysts and hemangiomas. In addition, the ability of MR imaging to detect and characterize diffuse parenchymal liver disease is unparalleled.
Literature
1.Semelka RC, Cance WG, Marcos HB, et al. (1999) Liver metastases: comparison of current MR techniques and spiral CT during arterial portography for detection in 20 surgically staged cases. Radiology 213:86 – 91
2.Seneterre E, Taorel P, Bouvier Y, et al. (1996) Detection of hepatic metastases: ferumoxides-enhanced MR imaging versus unenhanced MR imaging and CT during arterio-portography. Radiology 200:785 – 792
3.Outwater E, Tomaszewski JE, Daly JM, et al. (1991) Hepatic colorectal metastases: Correlation of MR imaging and pathologic appearance. Radiology 180:327 – 332
MR Imaging Findings
At MR imaging, the individual lesions in the setting of multiple liver metastases will often demonstrate a typical MR imaging appearance as described in the previous chapter: the lesions have a targetlike appearance on T2-weighted images and show irregular continuous ring-shaped enhancement in the arterial phase (see Chap. 17 for detailed description). In the context of multiple liver metastases, the liver parenchyma may show changes due to the presence of variable fatty infiltration, edema, and mild biliary dilatation. Due to these and other changes like vascular compression and obstruction, transient perilesional or (sub)segmental parenchymal enhancement may be present (Figs. 18.1 – 18.3).
Differential Diagnosis
Especially at ultrasound (US) and computed tomography (CT), very small multiple colorectal liver metastases may coalesce and mimic diffuse parenchymal liver disease. The impression of diffuse liver disease may even become more confusing by concurrent diffuse fatty infiltration. In general, within fatty livers the individual lesions are difficult to recognize at CT. MR imaging – based on the high intrinsic soft tissue contrast of T2-weighted images, the application of chemical shift imaging, and the strong T1 shortening effect of gadolinium on contrast-enhanced images – facilitates the detection and characterization of multiple colorectal metastases even in the presence of diffuse parenchymal changes caused by fatty infiltration and edema.

18 Colorectal Metastases II – Typical Multiple Lesions 39
Fig. 18.1. Metastases, colorectal, multiple, drawings. T2 fatsat: metastases (m) are surrounded by the high signal intensity edema. Dilated bile ducts are very bright and the normal liver is darker; T1 in-phase: metastases and the
Fig. 18.2. Metastases, colorectal, multiple, steatosis, dilated bile ducts, MRI findings. A Axial TSE image (T2 fatsat): Metastases (m) are surrounded by the high signal intensity liver edema and dilated bile ducts. The normal liver is much darker (*). B Axial in-phase image (T1 in-phase): Metastases and the bile ducts are hypointense to the liver. C Axial arterial phase image (ART): Metastases show typical irregular ring-shaped enhancement with increased diffuse enhancement around the dilated bile ducts. D Axial delayed phase image (DEL): Persistent enhancement indicates diffuse metastatic or in-
bile ducts are hypointense to the liver; ART: metastases show typical irregular ring-shaped enhancement, with diffuse increased enhancement around bile ducts; DEL: persistent enhancement indicates diffuse disease
flammatory (cholangitis) disease. E Axial SSTSE image: The findings are less apparent than on the T2 fatsat image. F Axial opposed-phase image (T1 op- posed-phase) shows diffuse steatosis centrally (*). G A detailed view of the arterial phase image shows the typical irregular ring-shaped enhancement of mainly the growing edge of the lesion (arrow). H A detailed view of the T2 fatsat image shows the growing edge of the lesion brighter (arrow) than the central part (*). Dilated bile duct (open arrow)
Fig. 18.3. Metastases, colorectal, multiple, steatosis, MRI findings (another patient). A Axial TSE image (T2 fatsat): Metastases are hyperintense to the liver with a typical target-configuration. B Axial in-phase image (T1 in-phase): Metastases are hypointense to the liver. C Axial opposed-phase image
(T1 opposed-phase): Mild diffuse steatosis causes faint high perilesional signal due to compressed non-fatty liver tissue (arrow). D Axial arterial phase image (ART): Metastases show typical irregular ring-shaped enhancement