

88 Part IIC – Primary Solid Liver Lesions in Cirrhotic Liver
41 Cirrhosis VII – Hemangioma in a Cirrhotic Liver
Hepatocellular carcinoma may occur in up to 22 % of patients with long-standing cirrhosis. Hemangiomas can occur in up to 20 % of the general population. In the setting of cirrhosis, however, the incidence of hemangiomas (about 2 %) is lower than expected. The events leading to cirrhosis may obliterate and change the appearance and vascularity of particularly small hemangiomas. MR imaging is likely to offer some advantages over CT in this challenging setting. In general, contrast enhancement of the cirrhotic liver at CT is often suboptimal. Because of its greater sensitivity to small differences in intrinsic tissue contrast as well as gadolinium enhancement, MR imaging is likely to perform better than CT for the detection and characterization of liver lesions especially in the setting of cirrhosis.
Literature
1.Brancatelli G, Federle MP, Blachar A, et al. (2001) Hemangioma in the cirrhotic liver: diagnosis and natural history. Radiology 219:69 – 74
2.Dodd GD III, Baron RL, Oliver JH III, et al. (1999) Spectrum of imaging findings of the liver in end stage cirrhosis. II. Focal abnormalities. AJR 173:1185 – 1192
3.De Caralt TM, Ayuso JR, Ayuso C, et al. (1999) Distortion of subcapsular hepatic hemangioma by hepatic cirrhosis. Can Assoc Radiol J 50: 137 – 138
4.Hussain SM, Semelka RC (2005) Liver masses. Magn Reson Imaging Clin N Am 13:255 – 275
MR Imaging Findings
At MR imaging, small and medium-sized hemangiomas have a characteristic appearance with moderately high signal intensity on T2-weighted sequences and peripheral nodular enhancement in the arterial phase and persistent enhancement in the delayed phase (Figs. 41.1, 41.2). This characteristic appearance of hemangioma may however change due to gradual parenchymal changes that lead to cirrhosis (Fig. 41.3). The signal intensity as well as the enhancement pattern may become unreliable even on state-of-the-art MR imaging. Therefore, atypical small, and fibrotic or hyalinized hemangiomas may be difficult to diagnose. In such cases, clinical correlation with alpha-fetoprotein and follow-up studies are preferred to US-guided biopsy, which may be undesirable in the setting of cirrhosis.
Differential Diagnosis
Small HCCs can show moderately high signal intensity on T2-weighted images but the signal intensity is typically much lower than for the hemangiomas and the signal may decrease on heavily T2-weighted sequences due to their solid nature. In addition, HCCs usually do not show any persistent enhancement in the delayed phase.
41 Cirrhosis VII – Hemangioma in a Cirrhotic Liver 89
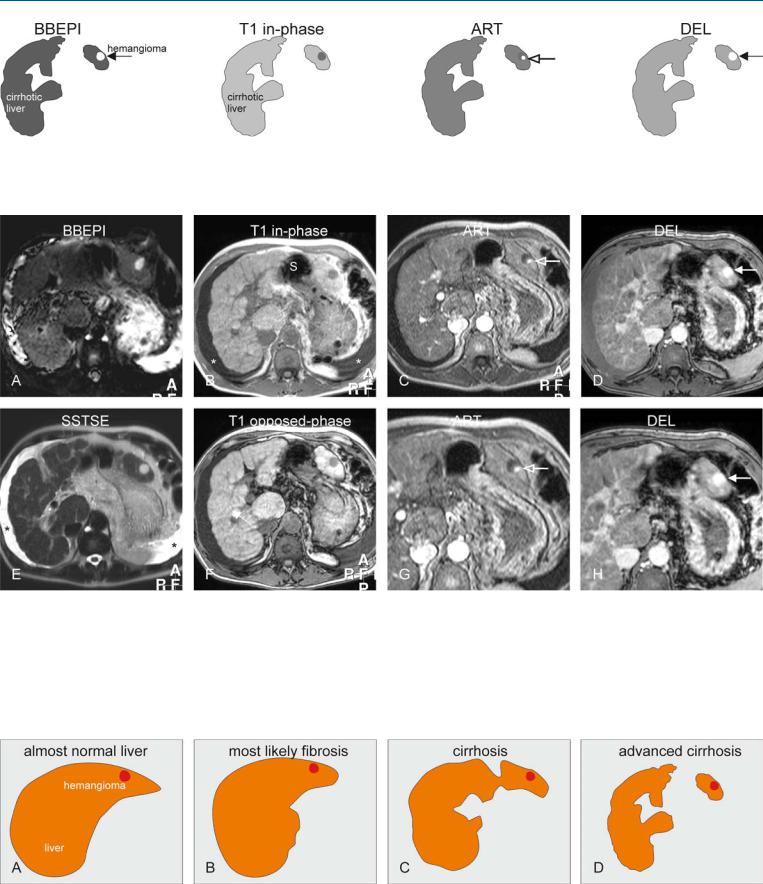
Fig. 41.1. Hemangioma in a cirrhotic liver, drawings. BBEPI: hemangioma is markedly hyperintense to the cirrhotic liver (solid arrow); T1 in-phase: hemangioma is hypointense to the cirrhotic liver; ART: hemangioma typi-
Fig. 41.2. Hemangioma in a cirrhotic liver, MRI findings. A Axial T2-weighted black-blood echo planar imaging (BBEPI): Hemangioma is hyperintense to the liver (arrow). B Axial in-phase (T1 in-phase): Hemangioma is hypointense to the cirrhotic liver (irregular contours, multiple regenerative nodules, and ascites). Note the ascites (*) and the interposition of the stomach (S) due to liver atrophy. C Axial arterial phase image (ART): Hemangioma shows typical peripheral nodular enhancement (open arrow). D Axial delayed phase (DEL): Hemangioma is completely enhanced and retains its
cally shows a peripheral nodular enhancement (open arrow); DEL: hemangioma becomes completely enhanced and retains its contrast (solid arrow)
contrast (arrow). E Axial T2-w SSTSE image with TE of 120 ms (SSTSE): Hemangioma retains its high signal indicating its non-solid nature. Ascites
(*). F Axial opposed-phase image (T1 opposed-phase): Hemangioma is hypointense to the liver. G A detailed view of the arterial phase shows more clearly the peripheral nodular enhancement (open arrow). H A detailed view of the delayed phase shows the homogeneously enhanced hemangioma (arrow)
Fig. 41.3. Preexisting hemangioma in cirrhotic liver, temporal changes, drawings. A Drawing shows almost normal contours and morphology of the liver. B Drawing shows signs of fibrosis (enlargement of the right liver; rounded edges). C Drawing shows signs of cirrhosis (irregular contours with nodules,
atrophy, and left-sided hypertrophy. D Drawing shows signs of advanced cirrhosis such as complete atrophy of the area around the falciform ligament with interposition of stomach

90 Part IIC – Primary Solid Liver Lesions in Cirrhotic Liver
42 HCC in Cirrhosis I – Typical Small with Pathologic Correlation
Hepatocellular carcinoma (HCC) is a malignant neoplasm composed of cells with hepatocellular differentiation. Small HCC is defined as measuring  2 cm in diameter. The criteria used to distinguish HCC from high-grade dysplastic nodules are not clearly defined. At histology, criteria in favor of malignancy include prominent nuclear atypia, high nuclear-cytoplasmic ratio with nuclear density twice normal, plates three or more cells thick, numerous unaccompanied arteries, mitoses in moderate numbers, and invasion of stroma or portal tracts. Most small HCC cannot be distinguished histologically from dysplastic nodules with certainty. By understanding the events of the stepwise carcinogenesis of HCC and taking advantage of the abundant neovascularity of HCC, one can more easily make sense of the complex nodularity depicted in cirrhotic livers on multiple MRI pulse sequences.
Literature
1.International Working Party (1995) Terminology of nodular hepatocellular lesions. Hepatology 22:983 – 993
2.Hussain SM, Zondervan PE, et al. (2002) Benign versus malignant hepatic nodules: MR imaging findings with pathologic correlation. Radiographics 22:1023 – 36
3.Hussain SM, Semelka RC, Mitchell DG (2002) MR imaging of hepatocellular carcinoma. Magn Reson Imaging Clin N Am 10:31 – 52
4.Van den Bos IC, Hussain SM, Terkivatan T, et al. (2006) Step-wise carcinogenesis of hepatocellular carcinoma in the cirrhotic liver: demonstration on serial MR imaging. JMRI (in press)
MR Imaging Findings
At MR imaging, small HCCs are often detected on the arterial phase as early enhancing lesions. On T2-weighted images, such lesions may have slightly increased signal compared to the surrounding parenchyma but may appear as isointense or even low in signal intensity areas. Classically, an early enhancing nodule of  2 cm with moderately increased signal intensity on T2-weighted images should be considered a small HCC (Figs. 42.1, 42.2). The appearance on T1-weighted sequences may vary and often does not play a role in the diagnosis unless a nodule shows evidence of fatty infiltration on chemical shift imaging. Fatty infiltration as well as increased vascularity are recognized signs of small HCC.
Pathology
At pathology, multiple regenerative nodules surrounded by fibrous septa may be present in cirrhotic livers. At gross pathology, HCC may appear as a dominant yellowish nodule (Fig. 42.3). At histology, small HCCs are usually well differentiated. Increased cellularity, loss of normal reticulin structure, and plates of more than three cells thick are features of HCC. Also, invasion of stroma or portal tracts is highly suggestive of malignancy.
42 HCC in Cirrhosis I – Typical Small with Pathologic Correlation 91
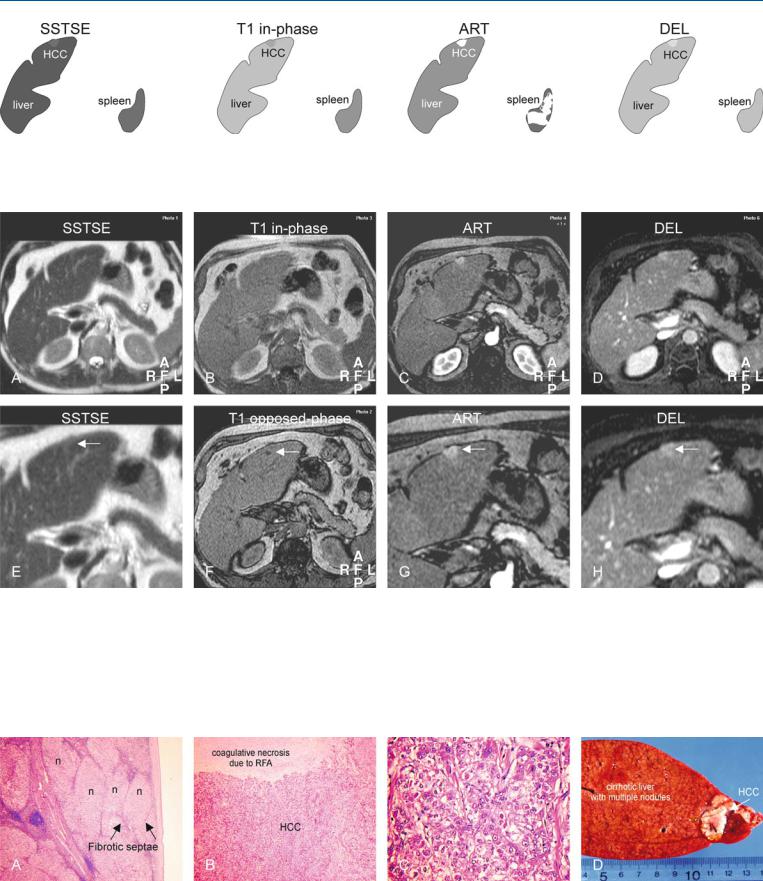
Fig. 42.1. HCC, cirrhosis, small, drawings. SSTSE: HCC is only minimally hyperintense to the cirrhotic liver; T1 in-phase: HCC is almost isointense to the liver; ART: HCC shows intense and homogeneous enhancement with slight
Fig. 42.2. HCC, cirrhosis, small, typical MRI findings. A Axial SSTSE image (SSTSE): HCC is minimally hyperintense to the cirrhotic liver, with rounded edges and peripheral atrophy. B Axial in-phase image (T1 in-phase): HCC is isointense compared to the liver. C Axial arterial phase image (ART): HCC shows intense homogeneous enhancement with some bulging of the liver contour. D Axial delayed phase image (DEL): HCC shows some washout and becomes heterogeneous. E A detailed view of the axial SSTSE image (SSTSE): HCC is minimally hyperintense compared to the liver (arrow).
bulging of the liver contour; DEL: HCC shows some washout and becomes somewhat heterogeneous
F Axial opposed-phase image (T1 opposed-phase): HCC is predominantly isointense to the liver, though a small area within the lesion shows decreased signal due to fatty infiltration (arrow). G A detailed view of the axial arterial phase image (ART): HCC shows intense homogeneous enhancement with some bulging of the liver contour (arrow). H A detailed view of the axial delayed phase image (DEL): HCC shows some washout and becomes heterogeneous (arrow)
Fig. 42.3. HCC, cirrhosis, small, direct MR-pathology correlation. A Photomicrograph of the liver shows multiple nodules (n) surrounded by fibrous septa, compatible with cirrhosis. H&E, × 40. B Photomicrograph shows typical aspect of HCC with coagulative necrosis after local treatment with radiofre-
quency ablation (RFA) therapy. H&E, × 100. C Photomicrograph shows poorly differentiated HCC. H&E, × 400. D Photograph of the explant (3 months after MRI above) shows a small HCC containing two RFA needle marks (arrow)