


92 Part IIC – Primary Solid Liver Lesions in Cirrhotic Liver
43 HCC in Cirrhosis II – Small With and Without a Tumor Capsule
Small ( 2 cm) hepatocellular carcinoma (HCC) may not show a tumor capsule at imaging. True tumor capsule, however, is a specific sign of mainly the larger HCC, and histologically is composed of fibrous tissue with relatively large extracellular space. In contrast, pseudocapsule is a term used for non-specific tissue changes that may be present around hepatic lesions. Pseudocapsules may be composed of compressed liver parenchyma, inflammatory infiltrates, compressed vessels, and non-steatosis. MR imaging facilitates differentiation between true capsule and pseudocapsule.
Literature
1.Hussain SM, Zondervan PE, et al. (2002) Benign versus malignant hepatic nodules: MR imaging findings with pathologic correlation. Radiographics 22:1023 – 36
2.Hussain SM, Semelka RC, Mitchell DG (2002) MR imaging of hepatocellular carcinoma. Magn Reson Imaging Clin N Am 10:31 – 52
3.Mazzaferro V, Regalia E, Doci R, et al. (1996) Liver transplantation for the treatment of small hepatocellular carcinomas in patients with cirrhosis. N Engl J Med 334:693 – 699
MR Imaging Findings
At MR imaging, very small HCC may show low signal on T1weighted images, high signal on T2-weighted images, intense homogeneous enhancement in the arterial phase, and washout with heterogeneity in the delayed phase. Relatively larger lesions may show a true tumor capsule with increasing thickness. The true capsule has low signal intensity on T1as well as T2-weighted images and shows enhancement in the delayed phase (Figs. 43.1 – 43.3). Pseudocapsules display high signal on T2-weighted images.
Management
A diagnostic biopsy of an HCC with a capsule may cause rupture with increased probability of dissemination. Currently, treatments for HCC include liver transplantation (LTX), resection, and minimally invasive treatment (MIT). LTX can cure both the tumor and the underlying cirrhosis. LTX is effective in patients with a single tumor ( 5 cm) or no more than three tumors, each 3 cm or less in diameter. If LTX is not possible and the liver has sufficient functional reserve, resection may be an option. MIT has become an alternative to (1) resection, (2) a means for local control while patients may be waiting for LTX, and (3) a method for palliation. MIT includes laser therapy, cryotherapy, thermal ablation, ethanol or acetic acid injection, and arterial chemoembolization.
43 HCC in Cirrhosis II – Small With and Without a Tumor Capsule 93
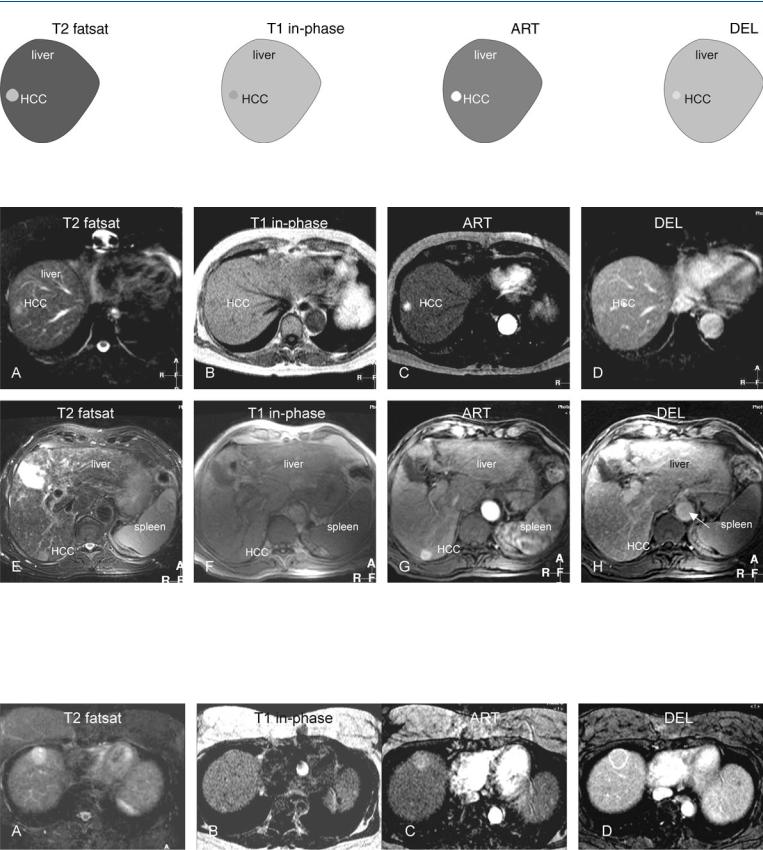
Fig. 43.1. HCC, cirrhosis, small, drawings. T2 fatsat: HCC is hyperintense to the liver; T1 in-phase: HCC is slightly hypointense to the liver; ART: HCC shows
Fig. 43.2. HCC, cirrhosis, small HCC without a capsule, slightly larger HCC with a tumor capsule, MRI findings. A Axial fat suppressed T2-w TSE image (T2 fatsat): HCC is hyperintense to the liver. B Axial in-phase image (T1 in-phase): HCC is slightly hypointense to the liver. C Axial arterial phase image (ART): HCC shows intense homogeneous enhancement. D Axial delayed phase image (DEL): HCC shows washout with some residual enhancement but no tu-
intense homogeneous enhancement; DEL: HCC shows washout with some residual enhancement but no tumor capsule
mor capsule. E Axial TSE image (T2 fatsat) in a different patient: HCC is hyperintense to the liver. F Axial in-phase image (T1 in-phase): HCC is slightly hypointense to the liver. G Axial arterial phase image (ART): HCC shows intense homogeneous enhancement. H Axial delayed phase image (DEL): HCC shows washout with an enhanced tumor capsule
Fig. 43.3. HCC, cirrhosis, mid-size HCC, MRI findings. A Axial TSE image (T2 fatsat): HCC is hyperintense to the liver, containing two smaller brighter nodules. B Axial in-phase image (T1 in-phase): HCC is surrounded by a dark
capsule. C Axial arterial phase image (ART): HCC shows almost homogeneous enhancement. D Axial delayed phase image (DEL): HCC shows washout with enhanced capsule

94 Part IIC – Primary Solid Liver Lesions in Cirrhotic Liver
44 HCC in Cirrhosis III – Nodule-in-Nodule Appearance
High-grade dysplastic nodules and small hepatocellular carcinoma (HCC) ( 2 cm) may have a nodule-in-nodule appearance on MR images, especially if a focus of HCC originates within a siderotic regenerative nodule. Such a lesion in fact is a developing HCC and can be considered as a transition between low-grade dysplastic nodule and a small HCC. State-of-the-art MR imaging displays a spectrum of findings in the initial detection of developing HCCs, including
(1) localized fatty infiltration within a developing dysplastic nodule that gradually evolves into HCC, maybe in combination with increasing alpha-fetoprotein; (2) development of a focus of HCC with high signal intensity on T2-weighted imaging in a dysplastic nodule; and (3) prominent neovasculature as the initial sign of developing HCC. These findings may represent various genetic pathways of developing HCC.
Literature
1.Mitchell DG, Rubin R, Siegelman ES, et al. (1991) Hepatocellular carcinoma within siderotic regenerative nodules: appearance as a nodule within a nodule on MR images. Radiology 178:101 – 103
2.Sadek AG, Mitchell DG, Siegelman ES, et al. (1995) Early hepatocellular carcinoma that develops within macroregenerative nodules: growth rate depicted at serial MR imaging. Radiology 195:753 – 756
3.Van den Bos IC, Hussain SM, Terkivatan T, et al. (2006) Step-wise carcinogenesis of hepatocellular carcinoma in the cirrhotic liver: demonstration on serial MR imaging. JMRI (in press)
4.Kanai T, Hirohashi S, Upton MP, et al. (1987) Pathology of small hepatocellular carcinoma: a proposal for a new gross classification. Cancer 60:810 – 819
MR Imaging Findings
At MR imaging, the appearance of a developing or small HCC may consist of low intensity of a large nodule, with one or more internal foci of higher signal intensity on T2-weighted images. On T1weighted chemical shift imaging, such lesions may show signal loss due to fatty infiltration. In the arterial phase, the central nodule may show more enhancement, indicating the development of increased tumor neovascularity (Figs. 44.1 – 44.3).
Management
The recognition of developing HCC is important because the average doubling time for volume of such HCCs may be less than 3 months. In addition, early detection of HCC provides more options for patient management.
44 HCC in Cirrhosis III – Nodule-in-Nodule Appearance 95
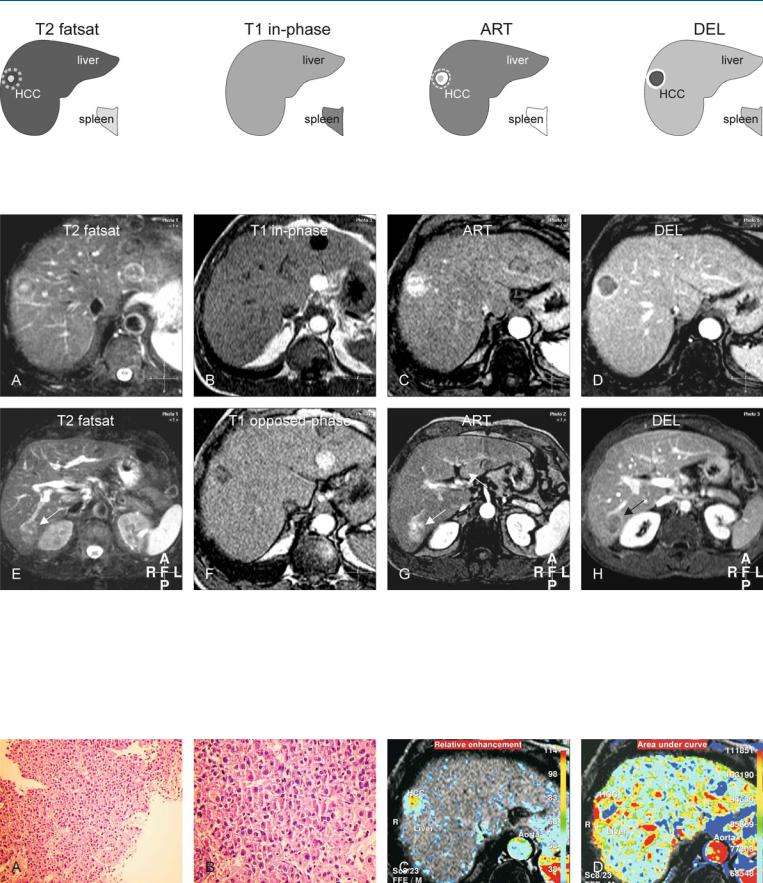
Fig. 44.1. HCC, cirrhosis, nodule-in-nodule, drawings. T2 fatsat: HCC shows a hyperintense smaller nodule within a larger darker lesion; T1 in-phase: HCC is isointense to the liver; ART: HCC shows intense (almost) homoge-
Fig. 44.2. HCC, cirrhotic liver, nodule-in-nodule, MRI findings. A Axial fat suppressed T2-w TSE image (T2 fatsat): HCC shows a nodule-in-nodule appearance (a bright nodule within a darker nodule). B Axial in-phase image (T1 in-phase): HCC is isointense to the liver. C Axial arterial phase image (ART): HCC shows intense (almost) homogeneous enhancement with more enhancement around the inner nodule. D Axial delayed phase image (DEL): HCC shows washout with an enhancing thick tumor capsule, a specific sign of HCC. E Axial fat suppressed T2-w TSE image at a lower anatomic level (T2
neous enhancement (the inner nodule is surrounded by more enhancement); DEL: HCC shows washout with enhancement of a thick fibrous tumor capsule
fatsat) shows a second HCC with predominantly high signal (arrow). F Axial opposed-phase T1-w GRE image (T1 opposed-phase): HCC shows loss of signal due to fatty infiltration. G Axial arterial phase image at a lower anatomic level (ART) shows heterogeneous enhancement of the second HCC (arrow). H Axial delayed phase image at a lower anatomic level (DEL): HCC shows washout with an enhancing tumor capsule that partially surrounds the HCC (arrow)
Fig. 44.3. HCC, MR biopsy correlation. A Photomicrograph from a subcutaneous metastasis of one of the lesions in the liver (shown above) shows a lesion of hepatocellular origin. H&E, × 200. B A detailed view shows the abnormal hepatocytes arranged in thickened cell plates (more than two). H&E, × 400.
C Pixelwise presentation of the relative enhancement (based on the dynamic imaging) shows the presence of tumor vessels (red areas). D Pixelwise presentation of the area-under-the-curve shows the enhancement of the tumor capsule