


100 Part IIC – Primary Solid Liver Lesions in Cirrhotic Liver
47 HCC in Cirrhosis VI – Mosaic Pattern with Fatty Infiltration
Hepatocellular carcinomas (HCCs) may present as T1-bright lesions. The recent literature indicates that high signal intensity on T1-weighted images is correlated with the presence of an increased amount of copper protein in the lesion. Fatty change is generally present in approximately 10 % of HCCs. Fatty accumulation within cirrhotic nodules may be an indication of ongoing dysplastic changes. Dysplasia indicates the presence of nuclear and cytoplasmic changes, such as minimal to severe nuclear atypia and an increased amount of cytoplasmic fat or glycogen. In fact, a nodule with fatty infiltration may be the initial presentation of a developing HCC. Chemical shift (inand opposed-phase) imaging is a simple and highly sensitive and specific method for demonstrating fatty infiltration in tissues including liver lesions.
Literature
1.Ebara M, Fukuda H, Kojima Y, et al. (1999) Small hepatocellular carcinoma: relationship of signal intensity to histopathologic findings and metal content of the tumor and surrounding hepatic parenchyma. Radiology 210:81 – 88
2.Hussain SM, Semelka RC, Mitchell DG (2002) MR imaging of hepatocellular carcinoma. Magn Reson Imaging Clin N Am 10:31 – 52
3.Van den Bos IC, Hussain SM, Terkivatan T, et al. (2006) Step-wise carcinogenesis of hepatocellular carcinoma in the cirrhotic liver: demonstration on serial MR imaging. JMRI (in press)
4.Hussain SM, Van den Bos IC, Dwarkasing S, et al. (2006) Hepatocellular adenoma: findings at state-of-the-art magnetic resonance imaging, ultrasound, computed tomography and pathologic analysis. Eur Radiol 16: 1873 – 1886
MR Imaging Findings
At T1-weighted opposed-phase imaging, fat-containing HCCs show signal loss compared to the in-phase imaging. HCCs may be composed of various smaller nodules with a variable amount of fat and variation in the signal intensity on T1-weighted images (mosaic pattern). In addition, the lesion may be surrounded by a tumor capsule (Figs. 47.1, 47.2). These are the characteristic diagnostic features of mainly a large fat-containing HCC.
Pathology
At pathology, nodules may have a variable amount of dysplastic changes which include small cell and large cell dysplasia (Fig. 47.3A, B). Fat accumulation can also be considered as part of the ongoing dysplastic changes within cirrhotic nodules and HCC. Fibrous capsule may surround fatty areas within HCCs, which appear bright at histology (Fig. 47.3C, D).
Differential Diagnosis
Hepatocellular adenomas contain fat in up to 70 % of cases but tumor morphology and enhancement differ from those in fatty HCCs. Hepatic angiomyolipoma and lipoma are rare fatty tumors.
47 HCC in Cirrhosis VI – Mosaic Pattern with Fatty Infiltration 101
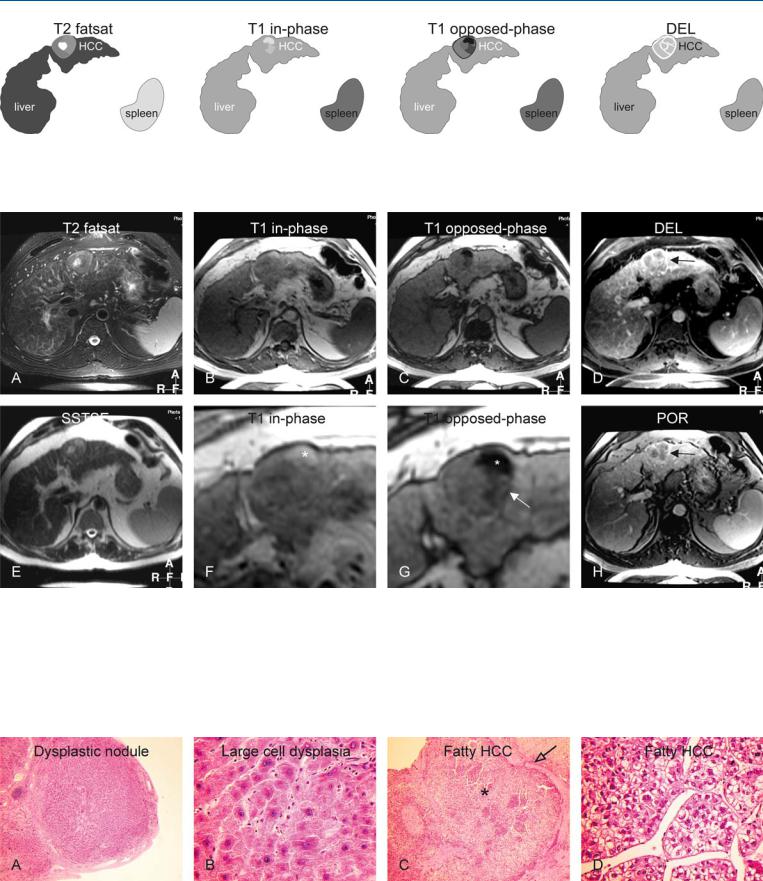
Fig. 47.1. HCC, cirrhotic liver, mosaic pattern with fatty lesion, drawings. T2 fatsat: HCC appears as dominant nodule that is slightly hyperintense to the liver with a brighter center; T1 in-phase: HCC is almost isointense to the liver.
Fig. 47.2. HCC, cirrhotic liver, mosaic pattern with fatty lesion, MRI findings. A Axial TSE image (T2 fatsat): HCC appears as a dominant nodule that is slightly hyperintense to the liver with a brighter center. B Axial in-phase image (T1 in-phase): HCC is almost isointense to the liver. C Axial opposedphase image (T1 opposed-phase): parts of HCC show moderate to marked signal loss due to the variable amount of fatty infiltration. D Axial delayed phase image (DEL): HCC shows washout with enhanced septa and a tumor capsule (arrow). E Axial SSTSE image (SSTSE): HCC is predominantly
T1 opposed-phase: parts of HCC shows moderate to marked signal loss due to variable amount of fatty infiltration; DEL: HCC shows washout with enhanced septae and a tumor capsule
hyperintense to the liver. F A detailed view of the in-phase image (T1 in-phase): one part of the HCC is much brighter (*). G A detailed view of the opposed-phase image (T1 opposed-phase): one part of the HCC shows marked signal loss, whereas another part shows moderate signal loss (arrow), which is related to the amount of fatty infiltration. H Axial portal phase image (POR): HCC shows washout with enhanced septa and a tumor capsule (arrow)
Fig. 47.3. HCC, direct MR-biopsy correlation. A Photomicrograph shows a dysplastic nodule surrounded by fibrous septa. H&E, × 40. B Photomicrograph shows typical large cell dysplasia with large abnormal hepatocytes with thickened plates. H&E, × 400. C Photomicrograph shows the HCC (shown
above) with the most fatty part (*) surrounded by a fibrous tumor capsule (open arrow). H&E, × 100. D Photomicrograph shows in detail the hepatocytes composed of abnormal nuclei and cytoplasm with fat, consistent with the fatty HCC shown above. H&E, × 200

102 Part IIC – Primary Solid Liver Lesions in Cirrhotic Liver
48HCC in Cirrhosis VII – Large Growing Lesion with Portal Invasion
Large hepatocellular carcinomas (HCCs) have a number of characteristic features, including vascular invasion with or without extracapsular extension with the formation of satellite nodule(s). Vascular invasion in fact is also a hallmark of diffuse HCC. Both the portal as well as the hepatic veins may be affected. In a recent study, 15.5 % of cases showed macroscopic and 59.0 % microscopic venous invasion proved at histopathology. In this study, the lesions with vascular invasion were associated with a larger tumor size, a higher  -fetoprotein level, and less frequent encapsulation. In a metaanalysis of 7 reports with 1497 patients, portal vein invasion was found in 24 % of the cases with HCC.
Literature
1.Hussain SM, Semelka RC, Mitchell DG (2002) MR imaging of hepatocellular carcinoma. Magn Reson Imaging Clin N Am 10:31 – 52
2.Tsai T-J, Chau G-Y, Lui W-Y, et al. (2000) Clinical significance of microscopic tumor venous invasion in patients with resectable hepatocellular carcinoma. Surgery 127:603 – 608
3.Lee YT, Geer DA (1987) Primary liver cancer: pattern of metastasis. J Surg Oncol 36:26 – 31
4.Hussain SM, De Becker J, Hop WCJ, et al. (2005) Can a single-shot blackblood T2-weighted spin-echo echo-planar imaging sequence with sensitivity encoding replace the respiratory-triggered turbo spin-echo sequence for the liver? – An optimization and a feasibility study. JMRI 21:219 – 229
MR Imaging Findings
Vascular invasion is visible as a lack of signal void on multislice T1-weighted gradient echo and flow-compensated T2-weighted fast spin-echo images. The signal in vessels may however vary on such sequences depending on the cardiac cycle and flow rate. On blackblood T2-weighted echoplanar MR imaging, flow within vessels is actively dephased by applying low diffusion gradients. On this sequence, normal vessels are visible with signal void whereas thrombosed vessels appear bright. On gadolinium-enhanced MR images, the tumor thrombus from HCC typically shows early enhancement on images acquired during the arterial phase and a filling defect on images acquired during later phases. A combination of various T2-weighted, T1-weighted, and dynamic gadolinium-enhanced sequences is critical in the detection of large HCC as well as small satellite nodules with vascular invasion (Figs. 48.1, 48.2). With the interval growth, the lesions may change their signal intensity and become more apparent (Fig. 48.3).
Differential Diagnosis
Rarely other liver lesions such as metastases and cholangiocarcinomas may show vascular invasion. Bland thrombosis of the hepatic vessels may be caused by underlying Budd-Chiari syndrome. Bland thrombosis however does not show any arterial enhancement. In the presence of unexplained portal vein thrombosis, any concealed diffuse HCC should be excluded.
48 HCC in Cirrhosis VII – Large Growing Lesion with Portal Invasion 103
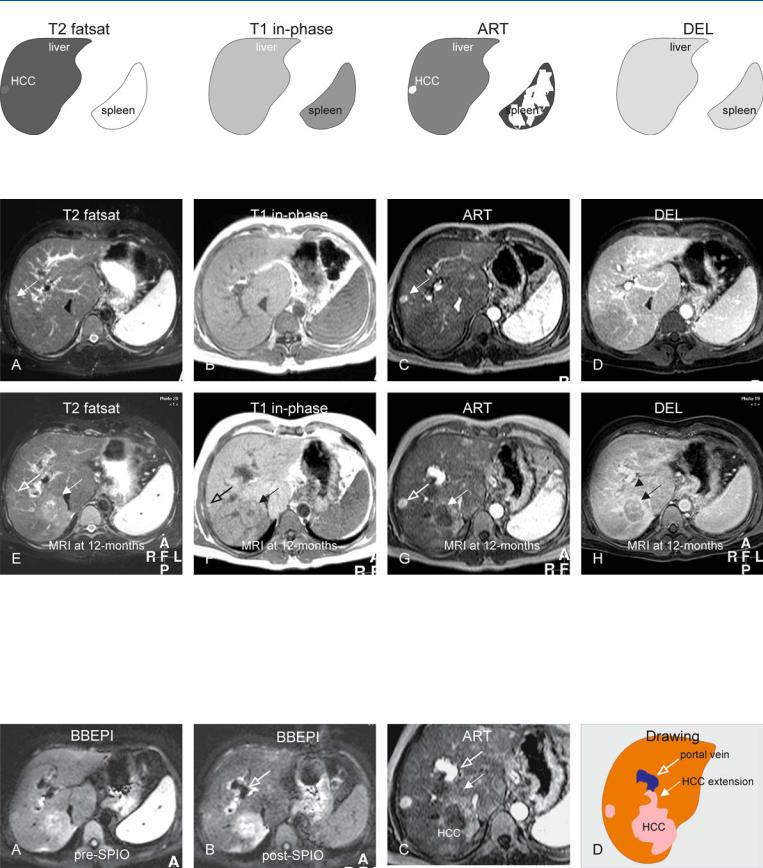
Fig. 48.1. HCC, cirrhosis, multiple. T2 fatsat: HCC is only slightly brighter to the cirrhotic liver; T1 in-phase: HCC is isointense to the cirrhotic liver; ART:
Fig. 48.2. HCC, cirrhosis, multiple growing lesions, MRI findings. A Axial TSE image (T2 fatsat): HCC is only slightly brighter to the cirrhotic liver (arrow). B Axial in-phase image (T1 in-phase): HCC is isointense to the cirrhotic liver. C Axial arterial phase image (ART): HCC shows intense almost homogeneous enhancement. D Axial delayed phase image (DEL): HCC becomes isointense to the liver. E Axial TSE image (T2 fatsat) at 12 months: smaller HCC is increased in size (open arrow). An additional larger HCC (solid arrow) has emerged with predominantly high signal to the liver. F Axial in-phase image
HCC shows intense almost homogeneous enhancement; DEL: HCC becomes isointense to the liver
(T1 in-phase): HCCs have predominantly low signal to the liver; note a bright nodule at the site of the smaller HCC (open arrow). Larger HCC is surrounded by a capsule (solid arrow). G Axial arterial phase image (ART): small HCC shows similar enhancement; the larger lesion shows heterogeneous enhancement. H Axial delayed phase image (DEL): small HCC becomes isointense to the liver. The larger lesion shows washout with enhancement of septa (arrow), and probably also suspicion of portal invasion (arrowhead)
Fig. 48.3. HCC, cirrhosis, multiple lesions, additional MRI findings at 6 months. A Axial BBEPI image before uptake of SPIO: Both HCCs are hyperintense to the liver. B Axial BBEPI image after uptake of SPIO shows improved delineation of the HCC with abruptly ending right portal vein (open arrow). C A de-
tailed view of the arterial phase image indeed shows a faint enhancing extension of the larger HCC (solid arrow) into the portal vein (open arrow). D Drawing presents the findings schematically