


204 Part V – Biliary Tree Abnormalities
95 Choledocholithiasis (Bile Duct Stones)
Choledocholithiasis (bile duct stones) has been reported to occur in up to 15 % of patients with symptomatic gallstones. The sensitivities of US for common duct stones range from 18 % to 74 %. This variable sensitivity is related in part to the operator-dependent nature of US and the obscuration of stones by bowel gas. Many centers still perform diagnostic endoscopic retrograde cholangiopancreatography (ERCP) in patients with suspected bile duct stones. Recent data show that ERCP is associated with major complications in 4.0 % of cases, including pancreatitis (1.3 %), cholangitis (0.87 %), hemorrhage (0.76 %), duodenal perforation (0.58 %), and others (0.51 %). Diagnostic ERCPs show a major complication rate of 1.38 % and a death rate of 0.21 %, whereas therapeutic ERCPs show a significantly higher rate for major complications (5.4 %) and deaths (0.49 %). Sensitivity and specificity of MRCP for choledocholithiasis exceeds 90 %. Negative predictive values of MRCP are also quite high, ranging from 96 % to 100 %. Thus, perhaps more important than the ability of MRCP to detect common bile duct stones is its ability to exclude stones because the absence of common bile duct stones at MRCP may result in avoidance of diagnostic ERCP along with its potential complications. Excellent performance of MRCP can result in the avoidance of ERCP in 52 % and 80 % of patients with high and low risk for common bile duct stones, respectively.
Literature
1.Soto JA, Barish MA, Alvarez O, et al. (2000) Detection of choledocholithiasis with MR cholangiography: comparison of three-dimensional fast spin-echo and singleand multisection half-Fourier rapid acquisition with relaxation enhancement sequences. Radiology 215:737 – 45
2.Reinhold C, Taourel P, Bret PM, et al. (1998) Choledocholithiasis: evaluation of MR cholangiography for diagnosis. Radiology 209:435 – 442
3.Fulcher AS, Turner MA, Capps GW, et al. (1998) Half-Fourier RARE MR cholangiopancreatography in 300 subjects. Radiology 207:21 – 32
4.Loperfido S, Angelini G, Benedetti G, et al. (1998) Major early complications from diagnostic and therapeutic ERCP: a prospective multicenter study. Gastrointest Endosc 48:1 – 10
5.Fulcher AS (2002) MRCP and ERCP in the diagnosis of common bile duct stones. Gastroint Endosc 56:S178 – 182
MR Imaging Findings
At MR imaging, the bile duct stones are visible as signal void within the bright fluid of the bile duct on MRCP and heavily T2-weighted sequences. Two-dimensional thick-slab MRCP sequences provide an overview of the anatomy and a road map for any therapeutic procedures. The exact number and location of stones can be visualized. In addition, intrahepatic bile duct stones with or without any underlying biliary disease or pneumobilia can also be visualized non-invasively (Figs. 95.1 – 95.3). MRCP should be performed in combination with gadolinium-enhanced imaging to demonstrate any unexpected soft tissue abnormalities such as cholangitis and tumors causing biliary obstruction.

95 Choledocholithiasis (Bile Duct Stones) 205
Fig. 95.1. Choledocholithiasis (bile duct stones), drawings. SSTSE: a stone appears as signal void (arrow) and almost completely fills the common bile duct; note a thin film of bright fluid surrounds the stone; T1 in-phase: the
Fig. 95.2. Choledocholithiasis (bile duct stones), typical MRI findings. A Axial SSTSE image (SSTSE) shows a stone as a signal void (arrow) and almost completely fills the common bile duct (CBD). B Axial in-phase image (T1 inphase): The stones appear larger because the fluid is also dark. C Axial arterial phase image (ART): No enhancement is present. D Axial delayed phase image (DEL): The stone is the darkest structure in the image. E Coronal SSTSE image (SSTSE) shows in fact two large stones within the distal, slightly dilated CBD (solid arrow). Normal pancreatic duct (open arrow). F MRCP
stone appears larger because the surrounding fluid is also dark; ART: obviously, the stone does not show enhancement and remains dark; DEL: the stone is the darkest structure in the image
(thick slab of 40 mm) provides an overview of the biliary tree with the two stones in the CBD (solid arrow). Note the normal pancreatic duct (open arrow). G Axial SSTSE image (SSTSE) shows bile duct stone (solid arrow). Pancreatic duct (open arrow). H A detailed view of the axial fat-suppressed SSTSE image (SSTSE fatsat) shows similar findings of the CBD stone (solid arrow) and the pancreatic duct (open arrow) but the anatomic detail is less obvious due to fat suppression
Fig. 95.3. Choledocholithiasis – intrahepatic stones (two different patients), MRI findings. A Axial TSE image (T2 fatsat) shows large dilated ducts in a patient with Caroli’s disease, containing a large calculus (arrow). B Axial T1 inphase image (T1 in-phase) shows – in part bright – calculus (cholesterol
stone). C Axial T1 image (T1 fatsat) (another patient) shows dilated bile ducts with pneumobilia (solid arrow) and cholelithiasis (open arrow). D Coronal SSTSE image (SSTSE) shows the biliary tree with typical appearance of PSC

206 Part V – Biliary Tree Abnormalities
96 Gallbladder Carcinoma I – Versus Gallbladder Wall Edema
Primary carcinoma of the gallbladder is the sixth most common gastrointestinal malignancy, following cancer of the colon, pancreas, stomach, liver, and esophagus. Annually, about 7000 new cases are diagnosed. Risk factors may include chronic Salmonella typhi infection, exposure to chemicals used in the rubber, automobile, wood finishing, and metal fabricating industries, and cholelithiasis. The symptoms at presentation are vague and are most often related to adjacent organ invasion. Therefore, despite advances in cross-sectional imaging, early-stage tumors are not often encountered. The vast majority of gallbladder carcinomas are adenocarcinomas. Because most patients present with advanced disease, the prognosis is poor, with a reported 5-year survival rate of less than 5 % in most large series. Imaging studies may reveal a mass replacing the normal gallbladder (up to 65 %), diffuse or focal thickening of the gallbladder wall (up to 30 %), or a polypoid mass within the gallbladder lumen (up to 25 %). The liver may be involved by direct contiguous spread in up to 90 % of cases, followed by the colon, duodenum, and pancreas.
Literature
1.Levin B (1999) Gallbladder carcinoma. Ann Oncol 10:129 – 130
2.Yoshimitsu K, Honda H, Jimi M, et al. (1999) MR diagnosis of adenomyomatosis of the gallbladder and differentiation from gallbladder carcinoma: importance of showing Rokitansky-Aschoff sinuses. AJR 172: 1535 – 1540
3.Demachi H, Matsui O, Hoshiba K, et al. (1997) Dynamic MRI using a surface coil in chronic cholecystitis and gallbladder carcinoma: radiologic and histopathologic correlation. JCAT 21:643 – 651
4.Loud PA, Semelka RC, Kettritz U, et al. (1996) MRI of acute cholecystitis: comparison with the normal gallbladder and other entities. MRI 14:349 – 355
5.Chun KA, Ha HK, Yu ES, et al. (1997) Xanthogranulomatous cholecystitis: CT features with emphasis on differentiation from gallbladder carcinoma. Radiology 203:93 – 97
MR Imaging Findings
At MR imaging, gallbladder carcinoma may be visible with irregular wall thickening as well as a mass at the level of the gallbladder fossa due to direct contiguous spread. Gallstones may be present. Concurrent liver metastases often have a similar T2 appearance and enhancement pattern to the primary lesion. Wall thickening due to edema can easily be distinguished from neoplastic lesions based on morphology and enhancement pattern (Figs. 96.1 – 96.3).
Differential Diagnosis
Smooth gallbladder wall thickening may be caused by heart failure, cirrhosis, hepatitis, hypoalbuminemia, renal failure, and cholecystitis (xanthogranulomatous cholecystitis with irregular wall thickening mimics carcinoma). Smoothly delineated enhancement is reported to be present in chronic cholecystitis, and irregular progressive enhancement in carcinomas. Transient increased pericholecystic hepatic enhancement can be seen in acute cholecystitis. Other causes of wall abnormality can be adenomyomatosis.
96 Gallbladder Carcinoma I – Versus Gallbladder Wall Edema 207
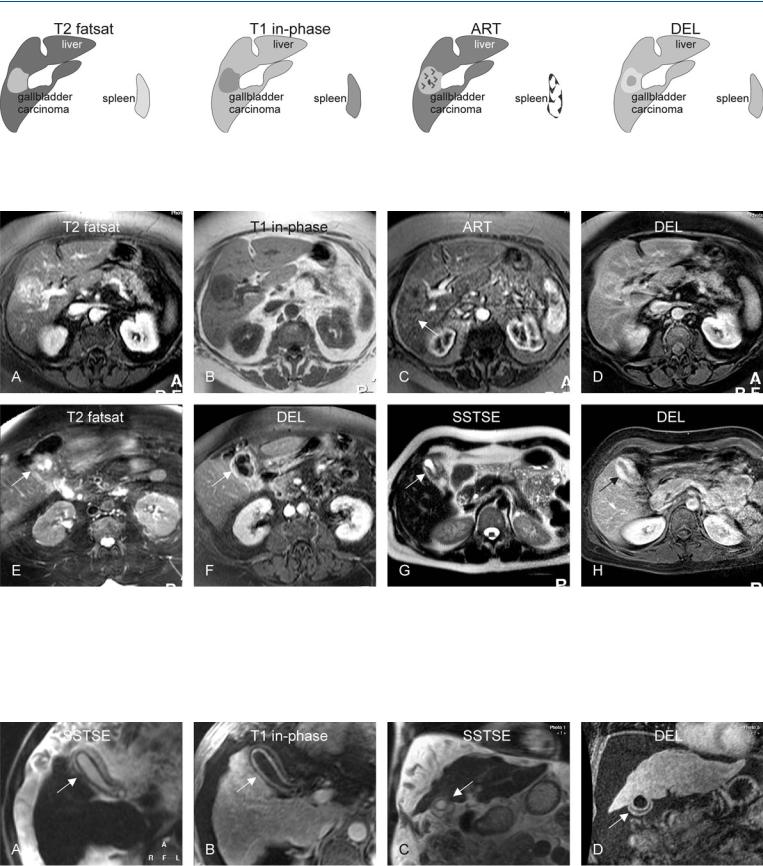
Fig. 96.1. Gallbladder carcinoma (GBC), drawings. T2 fatsat: GBC is hyperintense to the liver and represents a cranial intrahepatic extension within the gallbladder fossa; T1 in-phase: GBC is hypointense to the liver; ART: GBC
Fig. 96.2. Gallbladder carcinoma (GBC), MRI findings (G and H show another patient). A Axial TSE image (T2 fatsat): GBC is hyperintense to the liver and represents a cranial intrahepatic extension within the gallbladder fossa. B Axial in-phase image (T1 in-phase): GBC is hypointense to the liver. C Axial arterial phase image (ART): GBC shows heterogeneous enhancement. D Axial delayed phase image (DEL): GBC shows in part washout and in part persistent enhancement. E Axial TSE image at a lower anatomic level (T2 fat-
shows heterogeneous enhancement; DEL: GBC shows in part washout and in part persistent enhancement
sat): Gallbladder shows irregular wall thickening consistent with the GBC, which extends into the liver and presents as a mass shown in the previous images (arrow). F Axial delayed phase image (DEL): Thickened gallbladder wall shows heterogeneous enhancement (arrow). G Axial SSTSE image (SSTSE) and H axial delayed phase image (DEL) from another patient show another example of gallbladder carcinoma (arrow)
Fig. 96.3. Gallbladder wall thickening (with cirrhosis, portal hypertension and ascites). A Axial SSTSE image (SSTSE) shows smooth and evenly thickened gallbladder wall caused by edema (arrow). B Axial delayed phase image (DEL) shows thin mucosal and serosal enhancement, excluding a solid le-
sion (arrow). C Coronal SSTSE image (SSTSE) shows the cirrhotic liver with edematous gallbladder wall (arrow). D Coronal delayed phase image (DEL) shows clearly the two smooth and enhanced layers of the gallbladder wall (arrow)