

168 Part III – Diffuse (Depositional) Liver Diseases
79 Focal Fatty Infiltration Mimicking Metastases
Hepatic steatosis is one of the most common morphological abnormalities identified on liver biopsy. Detection and quantification of fat within the liver is important in patients with suspected non-al- coholic steatohepatitis, liver donors or liver transplants. Multifocal hepatic steatosis or multifocal nodular fatty infiltration of the liver is an incidental finding at imaging and can cause misleading findings in the differential diagnosis when using ultrasound (US) and computed tomography (CT). Particularly, at US the lesions appear as hyperechoic nodules which cannot be distinguished from metastatic lesions. MR imaging allows accurate differentiation. Chemical shift MR imaging is a simple and effective method to characterize multifocal nodular fatty infiltration.
Literature
1.Mitchell DG (1992) Focal manifestations of diffuse liver disease at MR imaging. Radiology 185:1 – 11
2.Martin J, Puig J, Falco J, et al. (1998) Hyperechoic liver nodules: characterization with proton fat-water chemical shift MR imaging. Radiology 207:325 – 330
3.Kronkce TJ, Taupitz M, Kivelitz D, et al. (2000) Multifocal nodular fatty infiltration of the liver mimicking metastatic disease on CT: imaging findings and diagnosis using MR imaging. Eur Radiol 10:1095 – 1100
4.Kemper J, Poll LW, Jonkmanns C, et al. (2002) CT and MRI findings of multifocal hepatic steatosis mimicking malignancy. Abdom Imaging 27:708 – 710
5.Pilleul F, Chave G, Dumortier J, et al. (2005) Fatty infiltration of the liver: detection and grading using dual T1 gradient echo sequences on clinical MR system. Gastroenterol Clin Biol 29:1143 – 1147
MR Imaging Findings
At MR imaging, multifocal nodular fatty infiltration is visible only on the opposed-phase images as focal hepatic areas with signal loss compared to the in-phase images. On T2-weighted images, the liver should appear completely normal without any sign of hyperintense focal lesions. The liver shows normal enhancement in the delayed images (Figs. 79.1, 79.2). Currently, inand opposed-phase sequences can be acquired in a single breath-hold with two echo time (TE) values (at 1.5T, shortest opposed-phase TE is 2.3 ms and shortest in-phase 4.6 ms). The resultant set of images is identical and displays signal loss only in the pixels with fatty infiltration.
Some patients may have strong fatty infiltration in certain areas. Such areas can show increased signal on in-phase images and show strong signal loss on opposed-phase images (Fig. 79.3).

79 Focal Fatty Infiltration Mimicking Metastases 169
Fig. 79.1. Focal fatty infiltration mimicking metastases, drawings. T2 fatsat: the signal intensity of the liver is homogeneous and normal; T1 in-phase: the liver has a normal appearance; T1 opposed-phase: decreased focal signal in
Fig. 79.2. Focal fatty infiltration mimicking metastases, MRI findings. A Axial fatsuppressed turbo spin echo (TSE) image (T2 fatsat) shows no bright lesions. B Axial in-phase image (T1 in-phase) shows homogeneous liver without any liver lesions. C Axial opposed-phase image (T1 opposed-phase) shows decreased focal signal in the entire liver caused by focal fatty infiltration, mimicking liver lesions. D Axial delayed phase image (DEL) shows homogeneous enhancement of the liver without any lesions. E Axial arterial phase image
the entire liver indicates focal fatty infiltration; DEL: the liver shows normal homogeneous enhancement without any liver lesions
(ART) shows no enhancing lesions. F Axial portal phase image (POR) shows homogeneous enhancement of the liver without any sign of liver lesions. G A detailed view of the opposed-phase image (T1 opposed-phase) shows clearly the focal fatty infiltration with the phase cancellation artifact at the interface between the liver and the surrounding fat (arrow). H A detailed view of the in-phase image (T1 in-phase) shows homogeneous liver without any liver lesions
Fig. 79.3. Fatty infiltration, phase cancellation effect based on chemical shift. A Drawing explaining phase cancellation: at 1.5T, water and fat are in-phase at a minimum TE of 4.6 ms and opposed-phase at a minimum TE of 2.3 ms. B Photomicrograph from a liver with fatty infiltration. H&E, × 200. C Axial
in-phase image from a different patient shows focal area of increased signal (arrow). D Axial opposed-phase image shows signal loss consistent with focal fatty infiltration (arrow)

170 Part III – Diffuse (Depositional) Liver Diseases
80 Focal Fatty Sparing Mimicking Liver Lesions
Occasionally, focal areas of normal parenchyma in an otherwise diffuse fatty liver may mimic mass lesions. Focally decreased blood flow from the main portal vein associated with aberrant venous drainage is a likely cause of the focal fatty sparing. These areas may be seen in the posterior edges of segments II and IV, and around the gallbladder fossa. One of the most common sites of focal fatty sparing is the posterior edge of segment IV (aberrant left gastric vein). To some extent sonographic features may facilitate identification of focal fatty sparing based on (1) characteristic location within the liver, (2) non-displaced blood vessels and (3) geometric pattern with straight edges. These findings, however, are non-specific. In addition, other benign or malignant lesions may concur. MR imaging should be applied if further characterization is necessary, for instance in patients with an underlying malignancy.
Literature
1.Mitchell DG, Kim I, Chang TS, et al. (1991) Fatty liver. Chemical shift phase-difference and suppression magnetic resonance imaging techniques in animals, phantoms, and humans. Invest Radiol 26:1041 – 52
2.Chong VF, Fan YF (1994) Ultrasonographic hepatic pseudolesions: normal parenchyma mimicking mass lesions in fatty liver. Clin Radiol 49:326 – 329
3.Matsui O, Kadoya M, Takahashi S, et al. (1995) Focal sparing of segment IV in fatty livers shown by sonography and CT: correlation with aberrant gastric venous drainage. AJR 164:1137 – 1140
MR Imaging Findings
At MR imaging, focal fatty sparing appears as an area with high signal intensity on the opposed-phase images because the remainder of the liver shows signal loss due to fatty infiltration. Depending on the extent of the diffuse steatosis, focal fatty sparing may appear isoor slightly hyperintense on the fat suppressed T2-weighted images. Focal fatty sparing may show some persistent enhancement; the enhancement pattern however should resemble the normal liver tissue. Other focal liver lesions such as small hemangiomas may concur (Figs. 80.1 – 80.3). In doubtful cases, follow-up with MR imaging may be considered or specific MR imaging contrast media may be applied to demonstrate the hepatic nature of the focal fatty sparing.
Differential Diagnosis
The differential diagnosis for liver lesions with high signal intensity on T1-weighted images may include melanoma metastases (visible on in-phase as well as opposed-phase images; highly vascular lesions); hemorrhage (often very bright rim of methemoglobin surrounds the lesion; no enhancement); and mucinousor proteinrich metastases (lesions have solid component with completely different enhancement pattern).
80 Focal Fatty Sparing Mimicking Liver Lesions 171
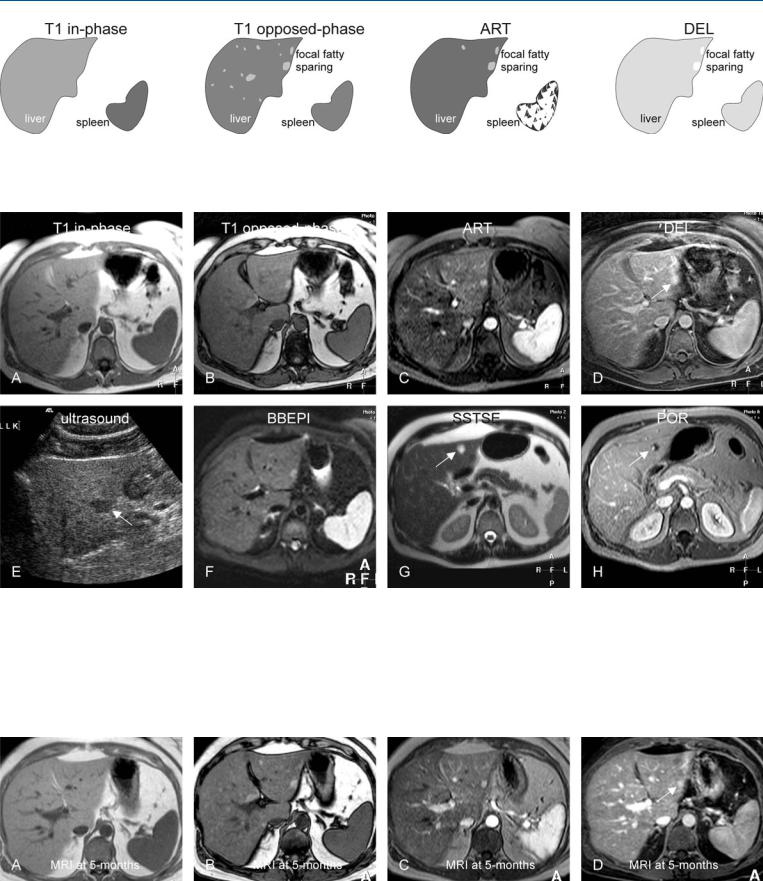
Fig. 80.1. Focal fatty sparing mimicking malignant liver lesions, drawings.
T1 in-phase: the liver shows a normal homogeneous signal without lesions; T1 opposed-phase: the liver shows signal loss due to diffuse fatty infiltra-
Fig. 80.2. Focal fatty sparing mimicking malignant liver lesions, MRI findings. A Axial in-phase image (T1 in-phase) shows a normal liver with homogeneous signal without lesions. B Axial opposed-phase image (T1 opposedphase): The liver shows signal loss due to diffuse fatty infiltration, and areas with persistent high signal due to focal fatty sparing. C Axial arterial phase image (ART) shows faint enhancement in some of the areas with focal fatty sparing. D Axial delayed phase image (DEL) shows persistent enhancement in one or two areas (arrow). E Ultrasound (prior to MRI) shows a hypoecho-
tion, and areas with persistent high signal due to focal fatty sparing; ART: some of the areas with focal fatty sparing show faint enhancement; DEL: focal fatty sparing shows persistent enhancement
ic lesion with suspicion of a metastasis (arrow). F Axial black-blood echoplanar imaging (BBEPI) shows unusually high signal in one of the focal fatty sparing areas (arrow). Based on this and the enhancement, a follow-up MRI was advised in 3 – 6 months. G Axial single-shot turbo spin echo image (SSTSE) at a different anatomic level shows a bright lesion (arrow). H Axial portal phase image (POR) shows peripheral nodular enhancement consistent with a small hemangioma
Fig. 80.3. Focal fatty sparing mimicking malignant liver lesions, MRI findings at 5 months follow-up. A Axial in-phase image (T1 in-phase) shows a normal liver with homogeneous signal without lesions. B Axial opposed-phase image (T1 opposed-phase): The areas with focal fatty sparing are completely
unchanged. C Axial arterial phase image (ART) shows similar enhancement to the previous MRI. D Axial delayed phase image (DEL) shows unchanged persistent enhancement in one or two areas (arrow)