

238 Part VI – Differential Diagnosis
111 T2 Bright Central Scar
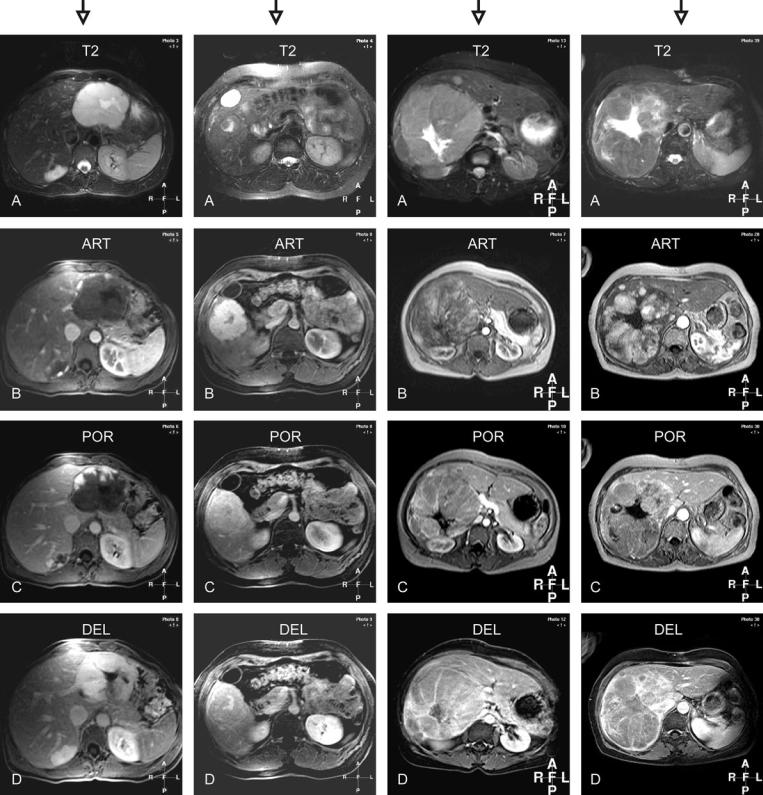
Evaluation of the T2-weighted sequence (Figs. 111.1A – 111.4A):
–All lesions have a bright central scar in non-cirrhotic liver. In the first example, the lesion is bright with a brighter central scar. The second example shows only the bright central scar within an almost isointense lesion. The third and fourth examples show large course central scars within large soli-
tary lesions.
Evaluation of the arterial enhancement pattern (Figs. 111.1B – 111.4B):
–In the first example, the lesion shows peripheral nodular enhancement. The second lesion shows very intense homogeneous enhancement with a central scar and septal sparing.
The third and fourth lesions show heterogeneous enhancement.
Evaluation of the portal enhancement pattern (Figs. 111.1C – 111.4C):
–In the first example, the lesion shows more prominent peripheral nodular enhancement. The following lesion becomes almost isointense. The third and fourth lesions show washout
with some capsular enhancement. Evaluation of the delayed enhancement pattern (Figs. 111.1D – 111.4D):
–In the first example, the lesion shows persistent enhancement with central scar sparing. The second lesion became isointense with central scar and septal enhancement.
Based on the following pertinent combination of findings the lesions can be characterized as:
1.Giant hemangioma (T2 bright lesion with a brighter central scar and peripheral nodular enhancement)
2.Focal nodular hyperplasia (isointense on T2; bright wellformed central scar; intense homogeneous arterial enhancement, and enhanced central scar and septa)
3.Hepatocellular carcinoma (large solitary lesion; large coarse central scar; heterogeneous enhancement with washout and capsular enhancement in a non-cirrhotic liver)
4.Hepatocellular carcinoma (idem)
|
|
|
111 T2 Bright Central Scar 239 |
|
|
|
|
T2 bright lesion |
T2 isointense |
T2 slightly bright lesion |
T2 slightly bright lesion |
T2 brighter scar |
T2 slightly brighter scar |
T2 brighter scar |
T2 brighter scar |
Peripheral nodular enhancement |
Homogeneous enhancement |
Heterogeneous enhancement |
Heterogeneous enhancement |
Persistent enhancement |
fades to isointensity |
Washout with capsular |
Washout with capsular |
|
|
enhancement |
enhancement |
Fig. 111.1. Giant and a mid-size |
Fig. 111.2. Focal nodular hyperplasia Fig. 111.3. Hepatocellular carcinoma Fig. 111.4. Hepatocellular carcinoma |
hemangioma |
|

240 Part VI – Differential Diagnosis
112 Lesions in Fatty Liver
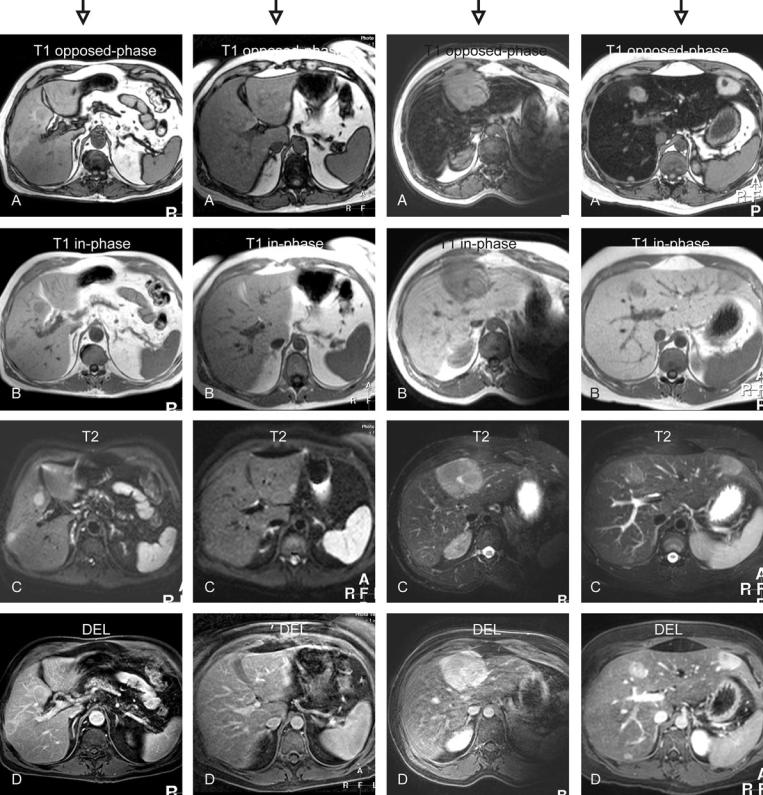
Evaluation of the opposedand in-phase T1-weighted sequence (Figs. 112.1A, B – 112.4A, B):
–All livers become dark on opposed-phase images consistent with fatty liver. The lesions in the first example are isointense and surrounded by a rim of fatty sparing. In the third and fourth examples, the liver is severely fatty infiltrated and the
lesions appear bright on opposed-phase images.
Evaluation of the T2-weighted sequences (Figs. 112.1C – 112.4C):
–The lesions appear brighter than the liver. The third lesion contains a bright central scar.
Evaluation of the delayed enhancement pattern (Figs. 112.1D – 112.4D):
–In the first example, the lesions show some persistent perilesional enhancement. The lesions in the third example become almost isointense. The third lesion shows enhanced central scar and the lesion appears brighter within a strongly fatty liver after fat suppression. In the fourth example, the lesions appear brighter within a strongly fatty liver after fat suppression.
Based on the following pertinent combination of findings the lesions can be characterized as:
1.Colorectal carcinoma metastases (T2 bright lesions; persistent perifocal fatty sparing and enhancement)
2.Focal fatty sparing (isointense on in-phase T1; appear bright on fat-suppressed T2 and show faintly more enhancement)
3.Focal nodular hyperplasia (the appearance of this classical FNH is changed due to the severe fatty infiltration of the surrounding liver)
4.Hepatocellular adenoma (strong fatty infiltration of the liver is common in multiple adenomas)
|
|
|
112 Lesions in Fatty Liver 241 |
|
|
|
|
T1 opposed-phase: lesions sur- |
T1 opposed-phase: lesions |
T1 opposed-phase: lesion appears |
T1 opposed-phase: lesions |
rounded by persistent high |
hyperintense |
hyperintense to the dark liver |
appear hyperintense to the |
signal of non-steatosis |
T1 in-phase: no lesions are |
T1 in-phase: lesion is hypointense |
dark liver |
T1 in-phase: hypointense lesions |
visible; liver has normal |
T2: lesion is hyperintense to the |
T1 in-phase: lesions are |
T2: hyperintense lesions |
signal |
liver with a bright central scar |
hypointense |
delayed phase: irregular |
T2: some areas show high signal |
delayed phase: lesion shows |
T2: lesions are slightly |
ring-enhancement |
delayed phase; some lesions |
enhanced central scar |
hyperintense |
|
show faint persistent |
|
delayed phase: lesions show |
|
enhancement |
|
homogeneous enhancement |
Fig. 112.1. Colorectal carcinoma |
Fig. 112.2. Focal fatty sparing |
Fig. 112.3. Focal nodular hyperplasia Fig. 112.4. Hepatocellular adenomas |
metastases |
|
|

Part VII
Appendices |
VII |