

The results seem sensible and agree with what we might expect. In what way has this second detailed model improved on the earlier? Here we have allowed for wind direction and investigated the various cases more thoroughly. All the results for rain collection are less than the value of 2 litres obtained for the initial model. Also the orders of magnitude are what we might expect. It is difficult to validate the numerical results of the model, but the idea of ‘moving with the rain’ can be tried out in practice, assuming that you do not mind getting wet. The overall conclusions from the model are as follows.
1. If the rain is driving towards you, then the strategy should be simply to run as fast as possible. 2.
If the rain is being blown from behind, then you should keep pace with the rain, which means moving with a speed equal to the wind speed.
Note in passing here that the conclusions are given in simple everyday terms that are easily understood. It is no good telling a non-mathematician to run at r sin α (m s −1) .
Box 6: Write a report and present the results
We shall look at report writing and presentations in some detail in chapter 10. A sample report is given there and it may then be beneficial to return to the rain problem to write up your account.
Summary
We have set out a structure for use in modelling assignments. The methodology will act as a guide to help to make a start when considering a particular newly presented situation that seems
3.1intractable. You must not become too encumbered by formal methods, however, since half the fun in creating mathematical models is to try your own ideas. However, a balance is needed between rushing in perhaps without adequate thought and being overcautious in trying to fit a rigid methodology to every situation.
The important issues for a successful approach to mathematical modelling have been systematically
3.2set out in section 3.3. It is advisable to refer to the items listed as you gradually gain in confidence and experience.
For future reference, it is convenient to have a clear understanding of the terms used in a modelling
3.3context. The brief discussion here in section 3.2 should help you to place the subsequent models treated in the book in the correct context.
CHAPTER 4
Modelling Skills
Aims and objectives
In this chapter we outline some of the essential skills involved in developing models including listing factors, making assumptions, translating into mathematics and keeping track of units.
4.1 Introduction
It would not be possible to write down a list of all the skills which may be needed in developing mathematical models. They are many and varied: some of them may be described as intuitive, others come from long experience and practice, and some could be described as just plain common sense. In this chapter, we draw attention to some of the skills which are most commonly involved in modelling and which can be developed by practising with examples such as those presented here.
4.2 Listing factors
In chapter 3, we saw that the second step in the modelling process requires us to list all the factors that we can identify as being relevant to the problem. This may well be a long list and some of the factors will usually be more important than others. In our first run through the modelling cycle, we try to keep the model as simple as possible and this usually means reducing the list of factors to a manageable size. To do this, we go through the list and throw out the least relevant factors, retaining only the more important ones. We have to use our judgement plus whatever knowledge we have about the system that we are trying to model, including possibly any data that happen to be available. We may well find later that we have discarded some factors which ought to have been included. This will come to light at the validation stage when we find that the model gives an inadequate representation of reality. (Of course, this inadequency may be due to other reasons rather than to the omission of certain factors.)
On our next trip through the modelling cycle, we may well decide to include more factors, thereby complicating but hopefully also improving the model.
Quite often the degree of importance of a particular factor cannot be judged at the outset but, when we have developed our model and used it to produce an answer, we can investigate what effect that particular factor has on the answer by varying the factor and noting what happens to the answer. This is also known as sensitivity analysis and we shall return to it again in chapter 8.
The word ‘factor’ is quite general and includes a number of different entities. A factor may be quantifiable, i.e. can be given a numerical value, or it may be a quality which can be named but not measured numerically. A factor could also be simply a relationship between two other factors. Quantifiable factors can normally be divided into variables, parameters and constants. Constants such as the speed of light have fixed values. Parameters have constant values for a particular problem but can change from problem to problem. For example, suppose that we are developing a model to solve a problem which involves a fluid. It is very likely that the density of the fluid would appear in our model and would thus be a parameter. We could use our model to predict what would happen if a fluid with a different density were used by changing the value of this parameter.
Variables can be discrete (i.e. capable of taking only certain isolated values such as integers) or continuous (i.e. capable of taking all values in a real interval). Variables can also be random or
deterministic. It is often useful to distinguish between variables (or parameters) which are inputs to a model and those which are outputs from the model. In some cases, it will be possible, after working through the model, to express the output variables in terms of the inputs by mathematical expressions. In other cases the connection between outputs and inputs will have to be derived in the form of tables of numerical values. The answer required from the model will usually be the behaviour of all or some of the output variables or some value to be calculated from them.
In order to simplify the mathematics, it is normal to abbreviate the names of the variables and some thought should be given to choosing a suitable notation. It is a good idea to use symbols which remind us of the variables to which they refer, e.g. t for time, p for pressure and F for force. It is also sensible
to conform to common usage and to denote angles by Greek letters such as α, β, γ, θ or  and lengths by x, y, z or l. Keep symbols such as π and e for their usual mathematical meaning. When our model involves several similar variables, an indexed notation such as X 1 , X 2 , X 3 ,… or A 1, 1 , A 1, 2 , … may be appropriate. When a model is implemented on a computer, it is wise to lengthen the variable names – for example, use DIST for distance rather than just the single letter x. This helps to make the computer program understandable especially if there are many variables.
Having listed our factors and rejected the least important ones, our next step is to think about the relations between the factors, also bearing in mind the purpose of our model and its domain of validity. It can be useful at this stage to form groups of closely related factors, i.e. to list the factors under a
number of headings. We can then try to formulate relationships between factors within a group before we try to relate the groups. The form of the relationship between any two or more factors will first emerge as a verbal statement which we must then translate into a mathematical statement. This step is difficult to carry out and we look at some of the skills involved in the remaining sections of this chapter.
Example 4.1 Problem statement
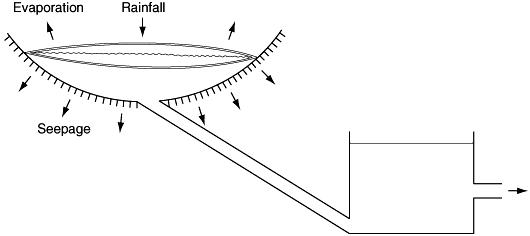
A water tank is supplied with water through a pipe from a distant reservoir. The reservoir receives its water from rainfall and inflow from rivers. Water is also lost from the reservoir through seepage into the soil and evaporation into the air. Water for domestic use is taken from the water tank through an outlet pipe.
Objective
A model is required which will predict the depth of water in the tank at any time, given all the relevant information (Figure 4.1).
Model
We could list some of the relevant factors as follows. Capacity of reservoir.
Depth of water in reservoir. Rainfall rate.
River inflow rate. Evaporation. Seepage.
Size of supply pipe from reservoir.
Flow rate through supply pipe.
Capacity of water tank.
Depth of water in the tank.
Size of outlet pipe from the tank.
Flow rate through tank outlet.
Some questions to ask at this stage are the following.
Figure 4.1
1.Have we left out anything vital?
2.Have we defined our factors meaningfully and precisely, e.g. what do we mean by the ‘size’ of a pipe?
In reply to question (a), we might add the difference in height between the reservoir and the tank as a factor which ought to have been included and, in reply to question (b), we could say that the pipe diameter is the relevant measurement although in the case of the supply pipe from the reservoir the pipe length might also be relevant. In the case of the outlet pipe from the tank, we also need to know the height of the outlet above the bottom of the tank.
One obvious way of grouping our factors would be as follows. Factors concerning the reservoir.
Shape.
Capacity. Water depth. Rainfall rate.
River inflow rate. Evaporation. Seepage.
Factors concerning the connecting pipe. Pipe diameter.
Pipe length.
Height difference between ends of pipe. Flow rate in the pipe.
Factors concerning the tank. Capacity.
Cross-sectional area. Water depth.
Diameter of outlet pipe.
Height of outlet pipe above bottom of tank. Flow rate through outlet.
If the purpose of the model is to predict the depth of water in the tank, then this is clearly going to be an output variable. What are the input variables? Before we try to answer this question, we can make things easier by firstly going through the factor list and identifying those factors which are either constants or parameters. The reservoir capacity, the dimensions of the connecting pipe, the height difference, the capacity of the water tank, the diameter of the outlet pipe and the height of the outlet pipe above the bottom of the pipe are all parameters. The remaining factors are all variables.
The next step in distinguishing input variables and output variables is to look for relationships within each group of factors. Can we see that some variables are direct consequences of other variables? Which variables are clearly independent of any other variables?
In the group of factors concerning the reservoir, the rainfall rate and the river inflow rate are obviously independent of the other variables. Are they independent of each other? Probably they are not because, if there has been a lot of heavy rainfall, the rivers will be swollen while in dry conditions the river inflow might dwindle to zero. Remember, however, that we should try to keep a model as simple as possible unless it proves to be inadequate. In our case, it will help us to assume that the rainfall rate and the river inflow rate are independent of each other. Their independence of any other variables means that they are input variables to the model.
The evaporation and seepage obviously have something to do with the amount of water in the reservoir at any moment although we could simplify matters by assuming them to be constants. More realistically, the evaporation rate depends on the area of water surface in the reservoir, which can be related to the depth of the water if we know the physical shape of the reservoir (we could model it as part of a sphere for example). Both the evaporation and (to a lesser extent) the seepage will also be affected by weather conditions, in particular the air temperature around the reservoir and the presence of wind. However, we have not included the weather in our model and we could justify this by saying that we have ‘averaged out’ the weather variations.
The depth of water in the reservoir is clearly a consequence of the flow of water into the reservoir and the flow through the connecting pipe into the water tank. The water depth is therefore an output variable from the model. If we decide to regard the seepage and evaporation as functions of the water depth in the reservoir, then these will also be output variables from the model.
The depth of water in the tank clearly depends on the flow rates in and out of the tank and on its dimensions and is therefore an output variable. The flow rate through the outlet is assumed to be controlled by the domestic users. We have to know their needs before we can calculate the flow rate through the outlet which is consequently an input variable for the model. We note that no outflow is
possible if the water depth in the tank falls below the level of the outlet pipe.
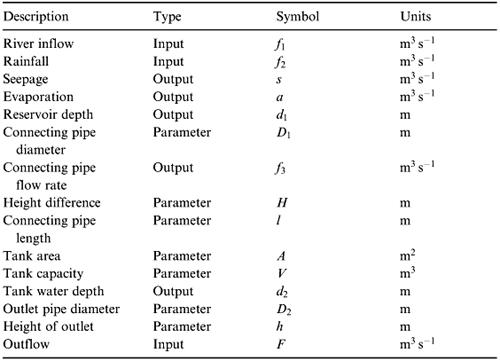
To complete our list of factors, we give each a symbol and also indicate its units of measurement (Table 4.1).
It may appear strange at first glance that the water outflow is classified as an input but remember that we are referring to information inputs and outputs and we are assuming that information on the use of the water is going to be available.
We are now in a position to formulate our model objectives in the standard ‘given–find’ form. It is simply this: given the inputs and the parameter values, find the outputs. In more detail, the objective of our model is to find the relationships between the outputs (seepage, evaporation, reservoir depth, tank water depth and rate of flow in connecting pipe) and the inputs (river inflow, rainfall and domestic water outflow) given the parameters (connecting pipe diameter and length, height difference, tank capacity, outlet pipe diameter and height of outlet). This completes the first step in the modelling cycle and we shall not continue further with this particular model.
Table 4.1
Exercises
4.1Make a list of all the factors which might be relevant in helping to decide whether or not to install double glazing in an existing house.
4.2The headmaster of a new school is trying to decide how long the lessons should be. Write down all the factors that he may need to consider before making his decision.
4.3What factors would you include in a mathematical model to help a shot putter to maximise the distance of his throw?
4.4You are on the sixth floor of a tower block. How long do you expect to have to wait for a lift? What information do you need before you can answer this question? How many floors would you walk