- •Preface
- •1.1 Introduction
- •1.2 Models and modelling
- •1.3 The learning process for mathematical modelling
- •Summary
- •Aims and objectives
- •2.1 Introduction
- •2.2 Examples
- •2.3 Further examples
- •Appendix 1
- •Appendix 2
- •Aims and objectives
- •3.1 Introduction
- •3.2 Definitions and terminology
- •3.3 Methodology and modelling flow chart
- •3.4 The methodology in practice
- •Background to the problem
- •Summary
- •Aims and objectives
- •4.1 Introduction
- •4.2 Listing factors
- •4.3 Making assumptions
- •4.4 Types of behaviour
- •4.5 Translating into mathematics
- •4.6 Choosing mathematical functions
- •Case 1
- •Case 2
- •Case 3
- •4.7 Relative sizes of terms
- •4.8 Units
- •4.9 Dimensions
- •4.10 Dimensional analysis
- •Summary
- •Aims and objectives
- •5.1 Introduction
- •5.2 First-order linear difference equations
- •5.3 Tending to a limit
- •5.4 More than one variable
- •5.5 Matrix models
- •5.6 Non-linear models and chaos
- •5.7 Using spreadsheets
- •Aims and objectives
- •6.1 Introduction
- •6.2 First order, one variable
- •6.3 Second order, one variable
- •6.4 Second order, two variables (uncoupled)
- •6.5 Simultaneous coupled differential equations
- •Summary
- •Aims and objectives
- •7.1 Introduction
- •7.2 Modelling random variables
- •7.3 Generating random numbers
- •7.4 Simulations
- •7.5 Using simulation models
- •7.6 Packages and simulation languages
- •Summary
- •Aims and objectives
- •8.1 Introduction
- •8.2 Data collection
- •8.3 Empirical models
- •8.4 Estimating parameters
- •8.5 Errors and accuracy
- •8.6 Testing models
- •Summary
- •Aims and objectives
- •9.1 Introduction
- •9.2 Driving speeds
- •Context
- •Problem statement
- •Formulate a mathematical model
- •Rewritten problem statement
- •Obtain the mathematical solution
- •9.3 Tax on cigarette smoking
- •Context
- •Problem statement
- •Formulate a mathematical model
- •Obtain the mathematical solution
- •9.4 Shopping trips
- •Context
- •Problem statement
- •Formulate a mathematical model
- •Obtain the mathematical solution
- •Interpret the mathematical solution
- •Using the model
- •9.5 Disk pressing
- •Context
- •Problem statement
- •Formulate a mathematical model
- •Obtain the mathematical solution
- •Interpret the mathematical solution
- •Further thoughts
- •9.6 Gutter
- •Context and problem statement
- •Formulate a mathematical model
- •Obtain the mathematical solution
- •9.7 Turf
- •Context
- •Problem statement
- •Formulate a mathematical model
- •Obtain the mathematical solution
- •Interpret the solution
- •9.8 Parachute jump
- •Context and problem statement
- •Formulate a mathematical model
- •Obtain the mathematical solution
- •9.9 On the buses
- •Context
- •Problem statement
- •Formulate a mathematical model
- •Obtain the mathematical solution
- •9.10 Further battles
- •Discrete deterministic model
- •Discrete stochastic model
- •Comparing the models
- •9.11 Snooker
- •Context
- •Problem statement
- •Formulate a mathematical model
- •Obtain the mathematical solution
- •Interpret the mathematical solution
- •9.12 Further models
- •Mileage
- •Heads or tails
- •Picture hanging
- •Motorway
- •Vehicle-merging delay at a junction
- •Family names
- •Estimating animal populations
- •Simulation of population growth
- •Needle crystals
- •Car parking
- •Overhead projector
- •Sheep farming
- •Aims and objectives
- •10.1 Introduction
- •10.2 Report writing
- •Preliminary
- •Main body
- •Appendices
- •Summary
- •General remarks
- •10.3 A specimen report
- •Contents
- •1 PRELIMINARY SECTIONS
- •1.1 Summary and conclusions
- •1.2 Glossary
- •2 MAIN SECTIONS
- •2.1 Problem statement
- •2.2 Assumptions
- •2.3 Individual testing
- •2.4 Single-stage procedure
- •2.5 Two-stage procedure
- •2.6 Results
- •2.7 Regular section procedures
- •2.8 Conclusions
- •3 APPENDICES
- •3.1 Possible extensions
- •3.2 Mathematical analysis
- •10.4 Presentation
- •Preparation
- •Giving the presentation
- •Bibliography
- •Solutions to Exercises
- •Chapter 2
- •Example 2.2 – Double wiper overlap problem
- •Chapter 4
- •Chapter 5
- •Chapter 6
- •Chapter 8
- •Index
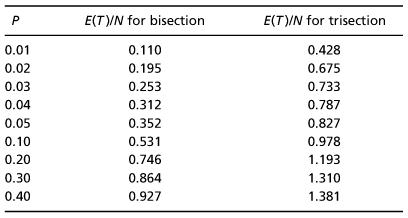
followed by a division of the population arbitrarily into two halves and a pooled test is applied to each half. Every positive result leads to another bisection until we get down to the level of individuals. Exact expressions for the number of tests required seem difficult to obtain. Simulation runs were carried out with N = 256 for the bisection procedure and N = 243 for a similar trisection procedure. Typical results are shown in Table 2 although the variance is appreciable with a coefficient of variation of about 2%.
The bisection results are better than the equivalent results for the single-stage procedure but less good than the two-stage results. The trisection results apparently show it to be the least efficient of the procedures considered.
2.8 Conclusions
Of the procedures examined, the most efficient in terms of minimising the expected total number of tests is the two-stage procedure in which the
Table 2
population is divided into groups each containing K 1 individuals at the first stage and K 2 individuals at the second stage. The optimal values of K 1 and K 2 are independent of the population size N, depending only on the value of P, the incidence of the condition being tested in the population. For small P the saving obtained over the single-stage test is about 50%. It is possible that an improvement could be made using procedures with more than two stages but, in practice, two stages seem likely to be sufficient.