


358 Implementing Query Diagnostics
Managing a diagnostics session
Once you set up the Query Diagnostics options as shown in the previous recipe, you can run a session and see what results you get thanks to this feature. In this recipe, we will perform some transformation steps, and then run a diagnostics session and observe the type of results.
Getting ready
For this recipe, you need to download the FactInternetSales CSV file. In this example, we will refer to the C:\Data folder.
How to do it…
Once you open your Power BI Desktop application, you are ready to perform the following steps:
1.Click on Get data and select the Text/CSV connector.
2.Browse to your local folder where you downloaded the FactInternetSales CSV file and open it. A window with a preview of the data will pop up; click on
Transform Data.
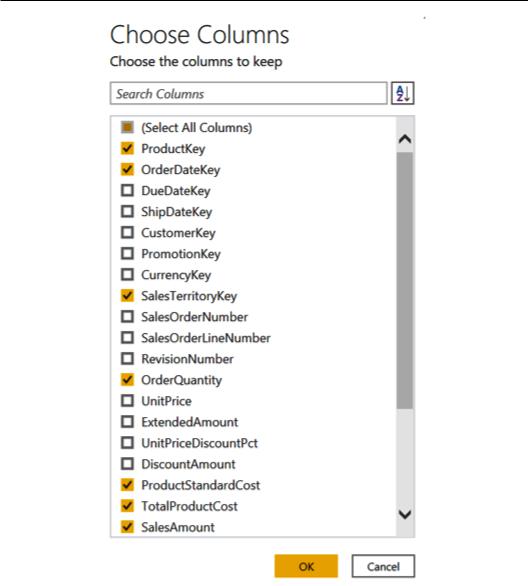
3.Browse to the Home tab and click on the Choose Columns button. The Choose Columns window will pop up. Flag the ProductKey, OrderDateKey,
SalesTerritoryKey, OrderQuantity, ProductStandardCost, TotalProductCost, SalesAmount, and OrderDate columns and click on OK.
Managing a diagnostics session 359
Figure 10.5 – Choose Columns
360 Implementing Query Diagnostics
4. Change the ProductKey data type to Text.
Figure 10.6 – Changing the data type
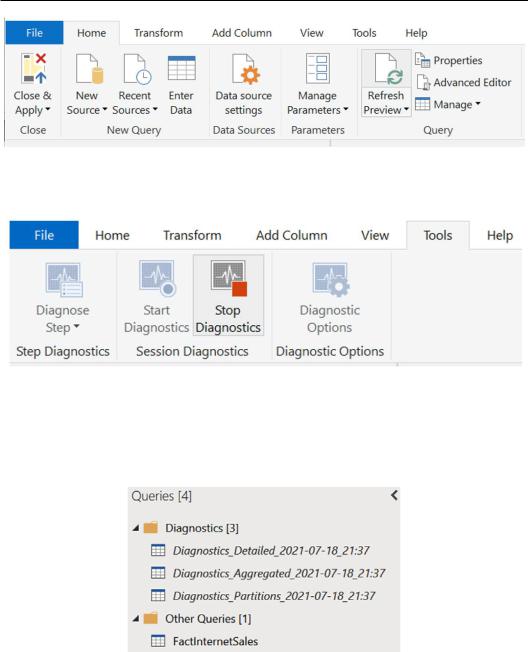
5.Browse to the Tools tab and click on Start Diagnostics, as shown in the following screenshot:
Figure 10.7 – Start Diagnostics button
6.You will see that the Start Diagnostics icon will be deactivated, and Stop Diagnostics will be enabled. This means that the session is currently active, and it is recording all the steps you are doing.
Now, browse to the Home tab and click on the Refresh Preview button to run the diagnostics on all Power Query steps performed previously at once.
Managing a diagnostics session 361
Figure 10.8 – Refresh Preview button
7. After the refresh finishes, go back to the Tools tab and click on Stop Diagnostics.
Figure 10.9 – Stop Diagnostics button
8.Once you click the Stop Diagnostics button, the output of the session will be generated. Under the Queries section, you will find the three query outputs grouped in the Diagnostics folder, all created automatically by Power Query, as you can see in the following screenshot:
Figure 10.10 – Diagnostics output
362Implementing Query Diagnostics
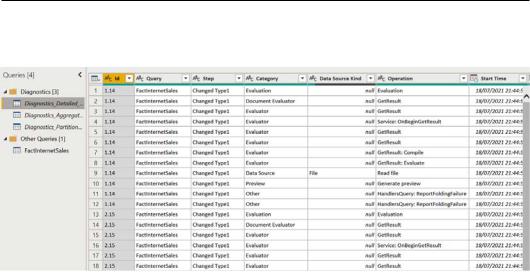
9.If you click on the Diagnostics_Detailed query, you will see a query appear with data regarding the diagnostic session, as follows:
Figure 10.11 – Diagnostics schema
A high volume of information has been retrieved on the refresh we performed.
You will end up with three output queries, Diagnostics_Detailed, Diagnostics_ Aggregated, and Diagnostics_Partitions, and they correspond to the output that you defined in the Options window in the Exploring diagnostics options recipe.
These three queries always have the same schema and you can read and interpret them to understand what has happened on the backend while Power Query was performing the refresh.
The most relevant dimensions can be summed up as follows:
•Id: Unique identifier for the evaluation of a single recording session.
•Query: Name of the query evaluated, listed under the Queries section on the left side of the UI.
•Step: Name of the applied step, listed under the Query settings pane on the right side of the UI.
•Category: The operation category.
•Data Source Kind: The data source you are accessing. In this example, it is File.