


326Performance Tuning with Power BI Dataflows
3.See how the different artifacts (data sources, dataflows, the dataset, and the report) are displayed in a way that makes it easy for the user to understand how data moves:
Figure 9.34 – Lineage view
In general, instead of having datasets directly connected to the data sources, you can create an intermediate layer with the dataflows to which multiple users can connect to create their own data models and reports. In this way, you can create centralized ETL pipelines with a familiar low-code tool, Power Query, making them reusable and available to your organization. You do not need to necessarily connect to the original source data and then create multiple datasets but can use standardized dataflows, integrate them with external data, and create reports and dashboards on top of them.
Building dataflows with Power BI Premium capabilities
The Power BI service has different licensing options and the Premium one allows you to access some advanced capabilities with the dataflows feature. You can use computed entities and linked entities, which means you can link a new dataflow to an existing one without modifying the previous one. In this recipe, we will see these features in addition to the previous recipe, Centralizing ETL with dataflows.
Getting ready
For this recipe, you need to have access to Power BI Portal, for which you need a Power BI Pro license. You also need to have access to a Power BI workspace with Premium capacity. In this recipe, a Premium Per User license will be used.

Building dataflows with Power BI Premium capabilities 327
Check this link to see the different licensing options:
https://docs.microsoft.com/en-us/power-bi/admin/service-admin- licensing-organization#license-types-and-capabilities
How to do it...
For this recipe, you need to replicate the steps from the previous recipe to create the three dataflows in the workspace.
You should start this recipe by having a similar situation to this one:
Figure 9.35 – Workspace view
Let's now follow the next steps to explore the Premium feature:
1. First, we need to assign a premium capacity to this workspace by clicking on Settings:
Figure 9.36 – Settings icon

328Performance Tuning with Power BI Dataflows
2.The Settings window will appear on the right side of the screen. Click on the Premium tab and select a premium capacity option. In this case, Premium per user should be selected, and then click on Save:
Figure 9.37 – Workspace Settings window
Building dataflows with Power BI Premium capabilities 329
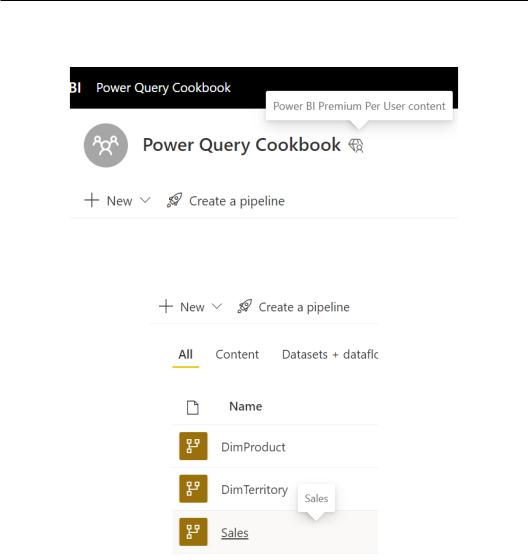
3.Check that the Premium Per User content is enabled by the presence of a diamond icon:
Figure 9.38 – Power BI Premium workspace
4. Now click on the Sales dataflow to see the tables contained in it:
Figure 9.39 – Dataflow selection
330Performance Tuning with Power BI Dataflows
5.You will see the previously loaded table, InternetSales, but now also want to add ResellerSales. Click on Add tables to open the connectors page:
Figure 9.40 – Add tables button
6.After having selected the Web API connector, enter the following URL to connect to a CSV file loaded in the Power Query Cookbook GitHub repository:
https://github.com/PacktPublishing/Power-Query-Cookbook/ blob/main/Chapter09/FactResellerSales.csv. Click on Next to see a data preview.
7.You will the data preview and click on Transform data to access the Power Query online page.
8.Rename the query to ResellerSales under Query Settings.
9.Click on the Choose columns button from the Home tab:
Figure 9.41 – Choose columns button
10.Select the ProductKey, OrderDateKey, OrderQuantity, TotalProductCost, SalesTerritoryKey, SalesAmount, and OrderDate columns and click on OK.
11.Then change the OrderDate column type by clicking on Using locale… since the date in this file is expressed in European format:

Building dataflows with Power BI Premium capabilities 331
Figure 9.42 – Change the data type
12.Select Date for Data type and English (United Kingdom) for Locale and click on
OK to correctly convert the Date column:
Figure 9.43 – Change the column type with locale

332Performance Tuning with Power BI Dataflows
13.Now we want to append InternetSales and ResellerSales queries in one, but first, let's create a Flag column for each query to make the transactions
identifiable as the Internet or Reseller channel. Select ResellerSales from the right side of the page, browse to the Add column tab, and select Custom column:
Figure 9.44 – Add a custom column
14.Create a column called Channel, write "Reseller", and click on OK to create this column with the value Reseller as a flag:
Figure 9.45 – Custom column creation

Building dataflows with Power BI Premium capabilities 333
15.Repeat the previous two steps with InternetSales and write Internet instead of Reseller.
16.Now browse to the Home tab and click on Combine, on Append queries, and then on Append queries as new to append these two tables in to one:
Figure 9.46 – Append queries as new
17.The Append window will appear and from here, you can select InternetSales and ResellerSales as the two tables to be appended:
Figure 9.47 – Append window

334Performance Tuning with Power BI Dataflows
18.The following message will appear and confirm that you are okay to have the data revealed by clicking on Continue:
Figure 9.48 – Revealing data notification
19.You will see that a new query will be generated, called Append as a result of the transformation step. The lightning bolt on the table icon means that this is a computed entity:
Figure 9.49 – Computed entity icon
20.Rename the table to TotalSales under Query Settings.
21.Click on Save & close to save the transformations performed.
You have created a computed entity, which is an in-storage computation. The first two queries, InternetSales and ResellerSales, have been loaded in the underlying storage and when you perform additional transformations combining queries or referencing them, you are creating computed entities, in this case, TotalSales.

Building dataflows with Power BI Premium capabilities 335
Now let's explore another concept through an example, linked entities. Imagine you want to combine some data in two tables that belong to different dataflows. You can do that by leveraging linked entities by following these steps:
1. From the workspace view, click on New and then on Dataflow:
Figure 9.50 – Dataflow creation

336Performance Tuning with Power BI Dataflows
2.Then click on Add linked tables to create a linked entity:
Figure 9.51 – Add linked tables
3.The Power BI dataflows connector page will pop up and you will be required to authenticate your account. Click on Sign in, complete the steps, and then click on the Next button, which will be activated after the authentication:
Figure 9.52 – Power BI dataflows connector
4.You will now see a preview of workspaces and dataflows you have access to. Expand the DimTerritory and Sales dataflows and select, respectively, the DimTerritory and TotalSales tables as in the following screenshot:

Building dataflows with Power BI Premium capabilities 337
Figure 9.53 – Power Query data preview
5.You will see, under Queries on the left side of the page, the two tables, identified as linked entities by the chain icon. These tables are read-only, and you cannot perform any transformation directly on these tables:
Figure 9.54 – Linked tables icon
6.Since they are read-only tables, we will create a transformation and combine them in a third table. Select the DimTerritory query, browse to the Home tab, click on Merge queries, and then on Merge queries as new as in the following example:
Figure 9.55 – Merge queries as new

338Performance Tuning with Power BI Dataflows
7.Select DimTerritory for Left table for merge, TotalSales for Right table for merge, and the SalesTerritoryKey column for both queries. Then select Left outer under Join kind and click on OK:
Figure 9.56 – Merge window

Building dataflows with Power BI Premium capabilities 339
8.A new query called Merge will be created and you can observe how the newly created table is a computed entity:
Figure 9.57 – Computed table icon
9.The new table contains DimTerritory columns and a column to expand with values coming from TotalSales. Click on the expand icon of the TotalSales column, flag
TotalProductCost and SalesAmount, and then click on OK:
Figure 9.58 – Expand column
340Performance Tuning with Power BI Dataflows
10.You have two new additional columns with sales data by geography:
Figure 9.59 – Power Query page
11.Rename the query Merge to SalesGeo.
12.Click on Save & close.
13.Name the dataflow Sales Geography and click on Save.
14.Click on Close to go back to the workspace view:
Figure 9.60 – Close dataflow view
15. Now click on View and then on Lineage to access the lineage view:
Figure 9.61 – Lineage button