


354 Implementing Query Diagnostics
The minimum requirements for installation are the following:
•.NET Framework 4.6 (Gateway release August 2019 and earlier)
•.NET Framework 4.7.2 (Gateway release September 2019 and later)
•A 64-bit version of Windows 8 or a 64-bit version of Windows Server 2012 R2 with current TLS 1.2 and cipher suites
•4 GB disk space for performance monitoring logs
You can find the data resources referred to in this chapter at https://github.com/ PacktPublishing/Power-Query-Cookbook/tree/main/Chapter10.
Exploring diagnostics options
You can use the Query Diagnostics tool to carry out an assessment of your queries and the steps performed. This means that once you have created Power Query steps, you can initiate a session that records and analyzes all the steps performed before you end that session. You can record what happens at the query level or deep dive at the single-step level. In this recipe, we will see where to find the Query Diagnostics option and how to set up the environment before starting a session.
Getting ready
For this recipe, you need to download the FactInternetSales CSV file. In this example, we will refer to the C:\Data folder.
How to do it…
Once you open your Power BI Desktop application, you are ready to perform the following steps:
1.Click on Get data and select the Text/CSV connector.
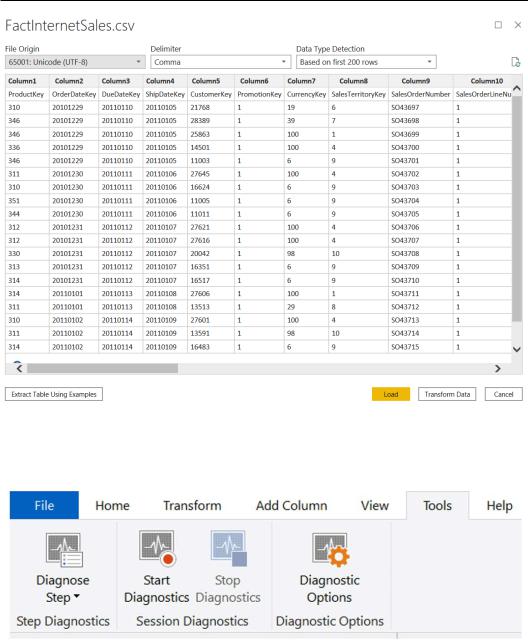
2.Browse to your local folder where you downloaded the FactInternetSales CSV file and open it. The following window with a preview of the data will pop up. Click on Transform Data:
Exploring diagnostics options 355
Figure 10.1 – Data preview
3.Browse to the Tools tab and you will see the different tools you can use to start a diagnostic session.
Figure 10.2 – Tools tab
You have the chance to diagnose a single step or start a general session and trace different actions, such as query refresh or the creation of a new step.
356Implementing Query Diagnostics
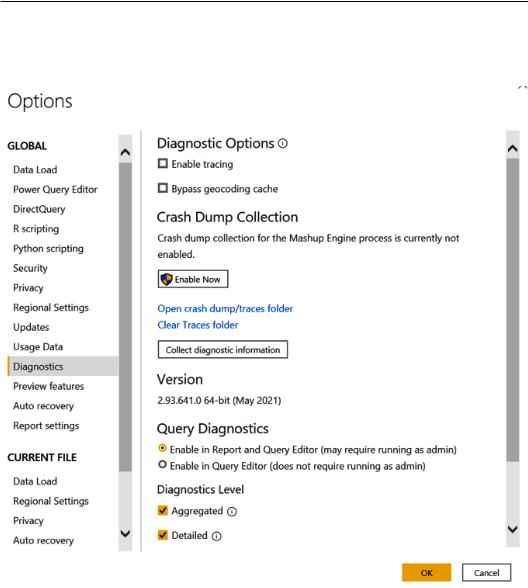
4.Before using this tool, we need to check the Diagnostic Options section. Click on the Diagnostic Options button, the last one in the Tools tab, and you will see the Options window pop up on the Diagnostics tab.
Figure 10.3 – Diagnostics tab in Options
Exploring diagnostics options 357
5.Scroll down to the end and focus on the Query Diagnostics section, as shown in the following screenshot:
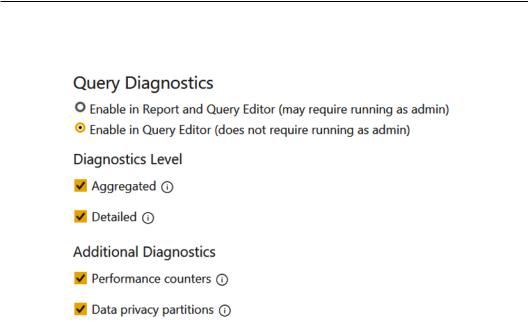
Figure 10.4 – Query Diagnostics in Options detail
You can enable diagnostics at the report and Query Editor levels, but this could require you to have admin rights. If you cannot run it, enable only Query Editor, as shown in the preceding screenshot.
You can select a diagnostics level and select which type of output to get:
•Aggregated: You will easily understand diagnostics information because the information will be grouped allowing you to take immediate action.
•Detailed: All diagnostics information is shown at the highest level of detail.
You will also have the chance to select an Additional Diagnostics option, such as Performance counters (including resource consumption and information about CPU and memory) and Data privacy partitions (logical partitions used to isolate steps for data privacy).
From here, you can define which type of information you want to see and analyze once you run the diagnostics session. Remember to check the information before using this tool.