


96Data Exploration in Power Query
7.From this view, you can carry out the following actions:
a)Edit Settings: Make changes within a step.
b)Rename a step by giving it a more explicit or intelligible name.
c)Delete a step.
d)Delete Until End: Delete all steps until the end, including the one selected.
An intermediate window will appear, asking if you are sure you want to perform this action.
e)Insert Step After the step you have selected.
f)Move before/Move after the step selected. You can achieve the same by dragging and dropping the step you want to move.
g)Extract Previous queries if you want to transfer a set of transformations to a new query. When you click on this, a window will appear, where you will be required to name the new query.
h)View Native Query: When clickable, you can see the query statements that are running against your data source.
i)Diagnose: You can click this to run a detailed analysis for that particular step and get diagnostics insights.
j)Properties…: A window will pop up where you can rename a step and add a description.
Using Schema view and Diagram view
You often need to visualize tables and columns focusing on a data schema and with the aim of performing transformations at a metadata level. Using the traditional Power Query view may end up being slower because the calculations are performed for all displayed rows, both the preview or the entire dataset. Another need is related to having a visual way to transform data whereby it is easier to understand the data preparation flow.
This recipe aims to show how to leverage the recently introduced Schema view and Diagram view available in Power Query Online.
Getting ready
For this recipe, you need to have access to the Power BI service and to have an existing workspace.
Using Schema view and Diagram view 97
You need also to connect to an Azure SQL database with AdventureWorks data. You need to have access to a running database.
How to do it…
After you log in to the Power BI portal, perform the following steps:
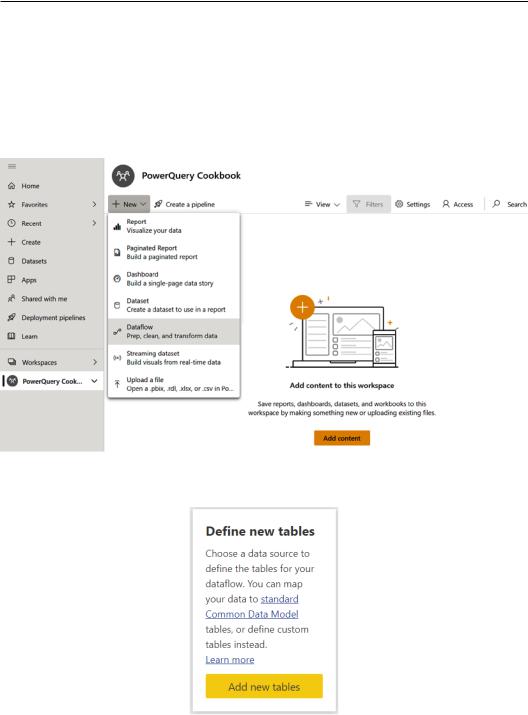
1. Browse to your workspace, click on New, and click on Dataflow:
Figure 3.43 – Creating a dataflow
2. Click on Add new tables:
Figure 3.44 – Add new tables button
98Data Exploration in Power Query
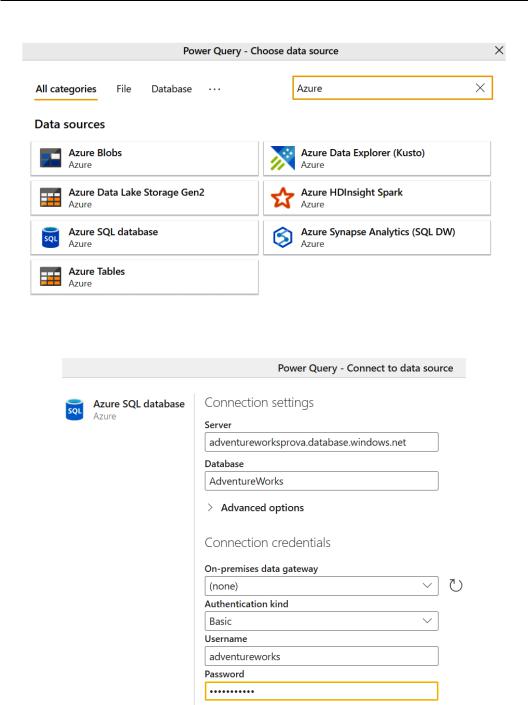
3.Search for Azure SQL database and click on the connector:
Figure 3.45 – Azure SQL database connector
4. Enter the server and database name and authentication details:
Figure 3.46 – Azure SQL database details
Using Schema view and Diagram view 99
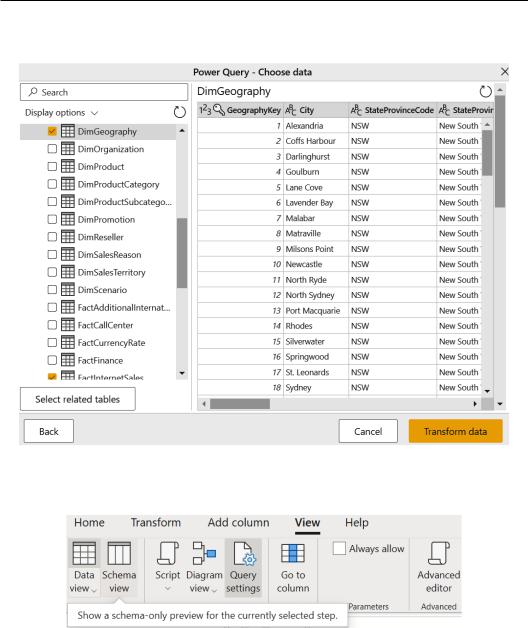
5.Select the DimGeography and FactInternetSales tables and click on
Transform data:
Figure 3.47 – Data preview
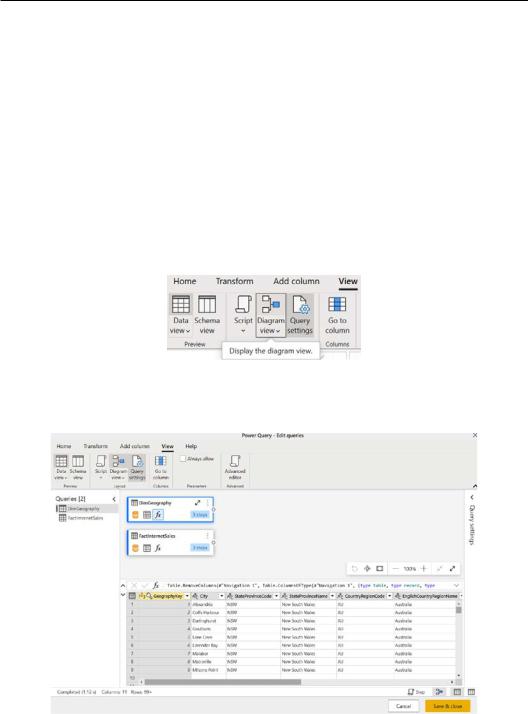
6. Browse to the View tab and click on Schema view:
Figure 3.48 – Schema view button
100Data Exploration in Power Query
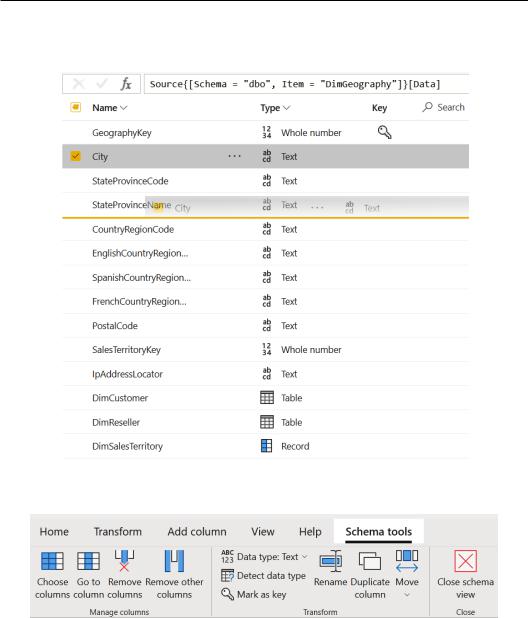
7.Data information will be viewed in the following mode:
Figure 3.49 – Schema view
Using Schema view and Diagram view 101
8.Activities that you can perform thanks to Schema view include the following: a) Reordering columns with drag and drop:
Figure 3.50 – Reordering a column in Schema view b) Applying a transformation listed on the Schema tools tab:
Figure 3.51 – Schema tools tab
102 Data Exploration in Power Query
As you can see, you can perform varied tasks such as choosing or removing columns, changing data types, marking a column as a key, duplicating, and renaming. You can also use other transformations available in other tabs. You can always go back to Data view by closing Schema view.
In general, this view is useful when you want to speed up some transformation and focus only on metadata. Once you close Schema view, you will apply the steps together, which ends up being more efficient.
You can also use a visual method to apply transformations to your data and leverage a feature available in Power Query Online: Diagram view.
Let's see how you can use this feature by following the next steps:
1.Once you have closed Schema view from the previous example, let's open Diagram view. Browse to the View tab and click on Diagram view:
Figure 3.52 – Diagram view button
2.Once you have turned to Diagram view, you will see that each query is defined by a block, as illustrated in the following screenshot. You can also see a table preview:
Figure 3.53 – Diagram view queries
Using Schema view and Diagram view 103
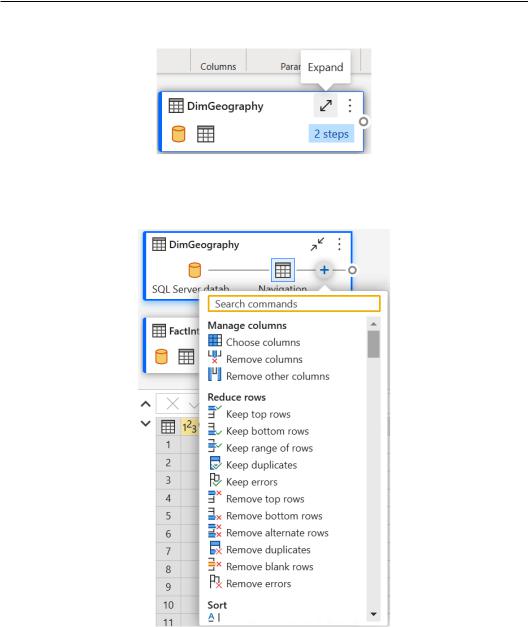
You can click on the Expand icon and visualize steps applied to each query:
Figure 3.54 – Expand option in DimGeography
3.After you have expanded the query, you can click on the plus (+) icon and navigate and choose the transformation step you want to perform:
Figure 3.55 – Adding a new step in Diagram view

104Data Exploration in Power Query
4.Click on Choose columns (the first option you see), select columns as shown in the following screenshot, and click on OK:
Figure 3.56 – Choosing columns
5. Add another step by clicking on the plus (+) icon and select Merge queries as new:
Figure 3.57 – Merge queries as new
Using Schema view and Diagram view 105
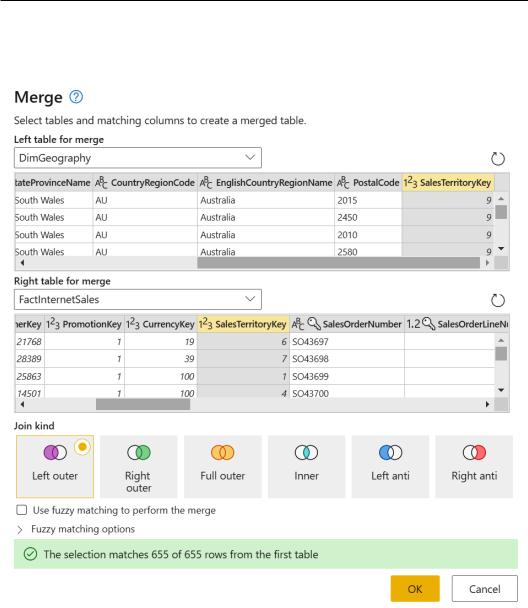
6.Select the SalesTerritoryKey column from DimGeography as Left table for merge and from FactInternetSales as Right table for merge. Then, select
Left outer in the Join kind field and click on OK:
Figure 3.58 – Merge queries window
106Data Exploration in Power Query
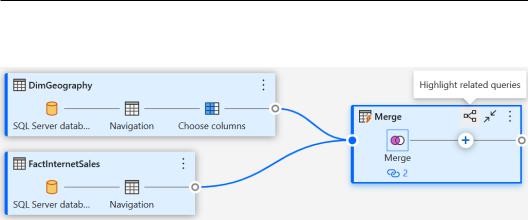
7.Click on Highlight related queries and see how queries involved with the Merge operation are highlighted:
Figure 3.59 – Merging in Diagram view
In general, Diagram view is useful for understanding the flow of data, seeing quickly how queries, parameters, and lists are related to each other, and easily expanding details for every step.
4
Reshaping Your Data
When data grows in size and complexity, you need tools that allow you to make sense of your data and create views that can be relevant for reporting and presenting that data. In order to do this, they need features and options to reshape their data properly and to
clean it if needed, especially when you can't edit data sources directly. Often, they connect to data that does not have a correct schema or a correct column name and they need to group and change how data is displayed.
In the recipes in this chapter, you will see how to leverage Power Query's built-in features that will allow you to reshape your data, to change its structure, and to adapt it to your reporting needs.
In this chapter, we will cover the following recipes:
•Formatting data types
•Using first rows as headers
•Grouping data
•Unpivoting and pivoting columns
•Filling empty rows
•Splitting columns
•Extracting data