

Using the Query Dependencies view 173
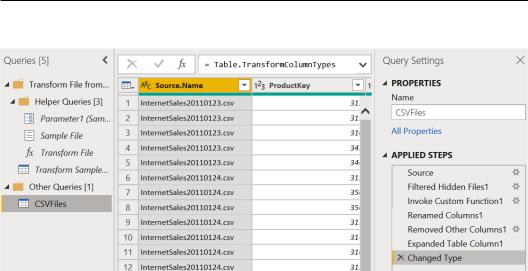
6. You can see that all data from all files is collected in one query:
Figure 5.33 – Combine Files output
With the Combine transformation method, there will be a set of transformations that are automatically generated by the system. These include the definition of a sample file and
a function that iterates over all the files in the folder and then expands and appends them.
Users can customize this generated function and adapt it to their custom use cases. An example will be explored in Chapter 8, Adding Value to Your Data.
Using the Query Dependencies view
Once you become confident using Power Query, you can start adding a higher number of queries, combining them, and applying complex transformation logic. You can often get lost in terms of how queries were built and merged and you may need a view that allows you to map data sources and queries. In this recipe, we will see how the Query Dependencies view will allow us to quickly see what is going on in that Power Query session.
Getting ready
In this recipe, you will need to connect to Azure SQL Database with AdventureWorks data. You need to have access to a running database.
174 Combining Queries for Efficiency
How to do it…
Once you open Power BI Desktop, perform the following steps:
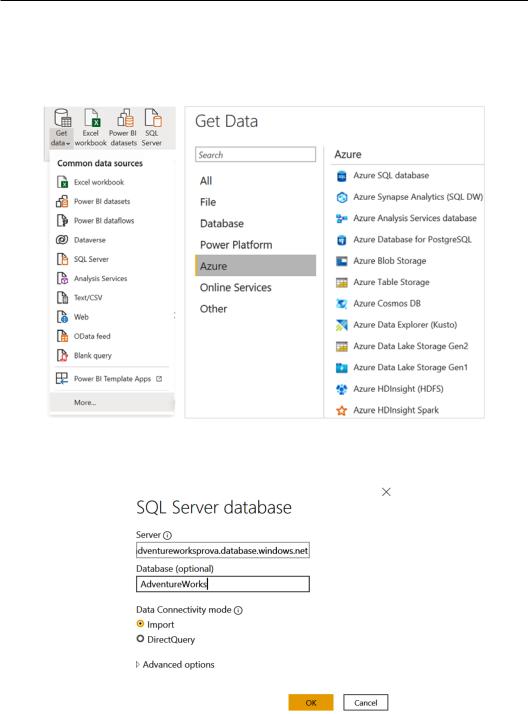
1. Go to Get data, click on More…, and browse for Azure SQL database:
Figure 5.34 – Azure SQL database
2. Enter the server name of your Azure SQL database:
Figure 5.35 – SQL Server information
Using the Query Dependencies view 175
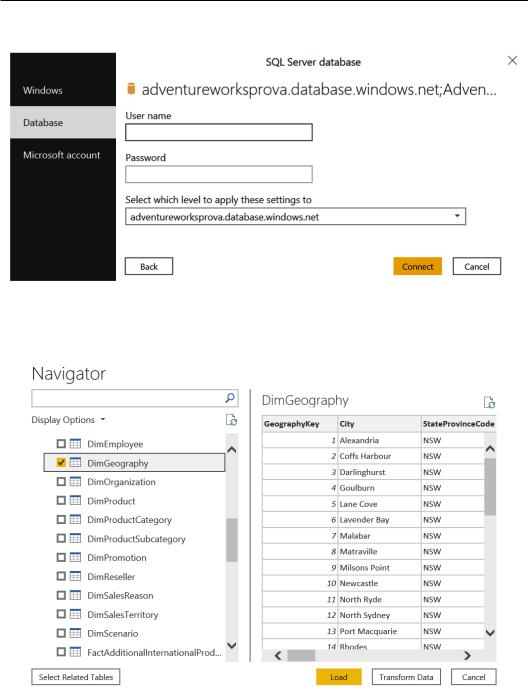
3. Enter authentication details:
Figure 5.36 – Azure SQL database authentication
4.Flag DimGeography, FactInternetSales, and FactResellerSales, and click on Transform Data:
Figure 5.37 – Table selection

176Combining Queries for Efficiency
5.Select FactInternetSales, click on Choose Columns, type Dim in the search bar, and unflag all columns:
Figure 5.38 – Unflagging Dim columns
6.Click on OK and repeat this step for the FactResellerSales query.
Select the FactResellerSales query and click on Append Queries as New:
Figure 5.39 – Append Queries as New button

Using the Query Dependencies view 177
7. Select FactInternetSales in the Second table field:
Figure 5.40 – Append Queries detail
8. Rename the newly created query as TotalSales:
Figure 5.41 – Query Settings properties
9. Browse to the View tab and click on Query Dependencies:
Figure 5.42 – Query Dependencies button
178 Combining Queries for Efficiency
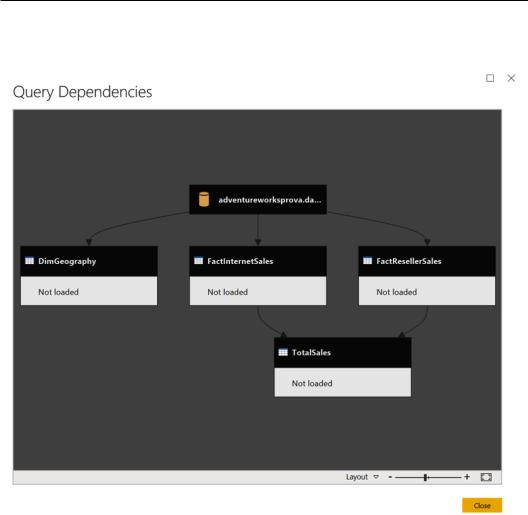
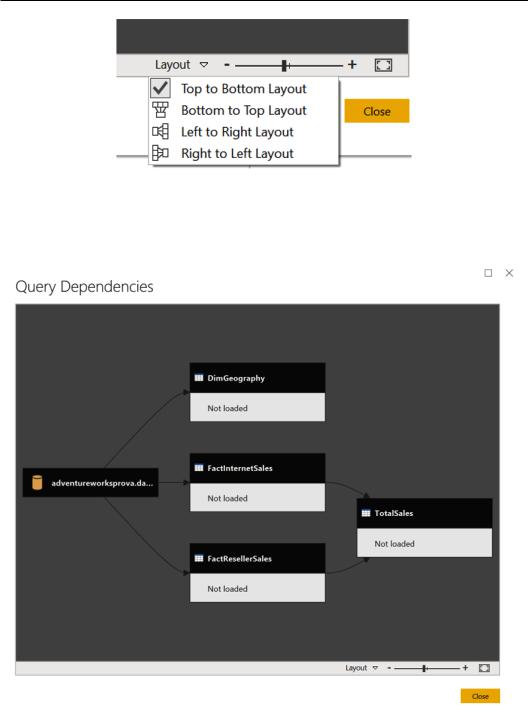
A tree view will open up all queries in the current Power Query session in a mapped format:
Figure 5.43 – Query Dependencies view
10.On the bottom right of the screen, click on Layout and click on Left to Right Layout:
Using the Query Dependencies view 179
Figure 5.44 – Query Dependencies layout
11.A different layout of the view will be displayed, and in the same way, you can change it according to your preferred view. This clearly depends on the complexity and number of queries:
Figure 5.45 – Query Dependencies changed layout
180Combining Queries for Efficiency
12.The dependency tree helps users to map all queries and their dependencies. In this case, we can see how a new TotalSales query is generated by
FactInternetSales and FactResellerSales.
It is possible to use this view to view the overall Power Query design and understand which data sources have been used and what is the level of the queries' complexity in terms of dependency.
6
Optimizing Power Query Performance
Once you become more confident with Power Query and are able to do the main transformations and reshape your data, you are ready to focus on optimizing queries' performance. This topic is important because when you prepare data for reporting or any other further use and you need to refresh data or to retrieve subsets of filtered data, you need to think about and design Power Query steps in a way that helps you to avoid slow queries and suboptimal performance for end users. In this chapter, we will learn how to use concepts such as parameters and query folding that can help you improve queries' loading times.
In particular, you will explore the following performance optimization options within Power Query:
•Setting up parameters
•Filtering with parameters
•Folding queries
•Leveraging incremental refresh and folding
•Disabling query load