

314Performance Tuning with Power BI Dataflows
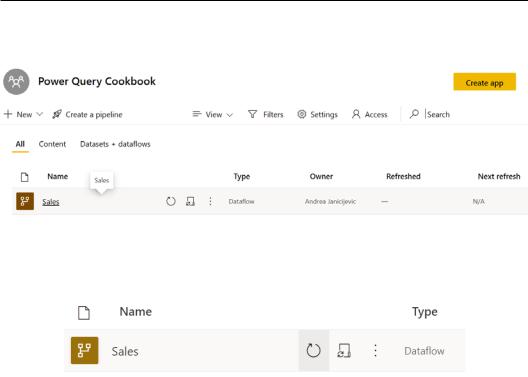
14.When closing the dataflow details view, you will go back to the workspace view and you will see the newly created content:
Figure 9.15 – Dataflows inside the workspace
15.Click now on the refresh icon to effectively load the data inside the storage of your Power BI Pro account:
Figure 9.16 – Refresh icon
You have seen how easy it is to create a dataflow. You can apply Power Query transformations and define data preparation steps directly from the browser and organize the content in workspaces.
Centralizing ETL with dataflows
Data preparation and transformation at an enterprise level, meaning managed centrally, compared to a self-service approach where you can perform your own data cleaning, is one of the most expensive and difficult tasks to manage within a company. Also called centralized ETL, this task is traditionally associated with enterprise tools, but with Power BI dataflows, you can extract, transform, and load data by connecting to data sources, transforming the data applying business logic, and then modeling the data to produce reports and do further analysis.
Centralizing ETL with dataflows 315
In this recipe, you will see how you can create multiple dataflows, and that these can be used by multiple users in their data models to produce reports and visualize all these pieces in the lineage view.
Getting ready
For this recipe, you need to have access to the Power BI portal, for which a Power BI Pro license is needed. You also need to have access to a Power BI workspace.
How to do it...
After you log in to the Power BI portal, perform the following steps:
1.Browse to your workspace, click on New and click on Dataflow.
2.Then click on Add new tables to connect to a data source.
3.Click on the Web API connector to connect to a CSV file from the GitHub repository.
4.Enter the following URL to connect to a CSV file loaded in the Power Query Cookbook GitHub repository: https://github.com/
PacktPublishing/Power-Query-Cookbook/blob/main/Chapter09/ FactInternetSales.csv. Click on Next to see a data preview.
5.A data preview page will appear, then click on Transform data.
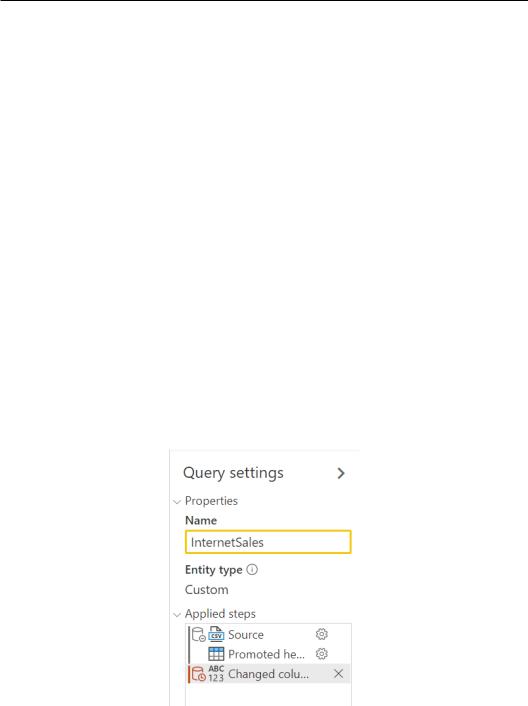
6.Once the Power Query UI appears on the web page, rename the query to InternetSales under the Query settings section on the right side of the UI:
Figure 9.17 – Query settings
316Performance Tuning with Power BI Dataflows
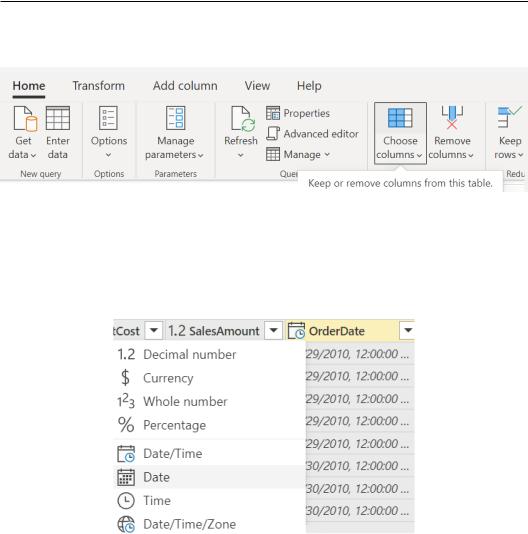
7.Let's apply some common Power Query transformation tasks such as Choose columns. Browse to the Home tab and click on the Choose columns button:
Figure 9.18 – Choose columns button
8.Select the ProductKey, OrderDateKey, OrderQuantity, TotalProductCost, SalesTerritoryKey, SalesAmount, and OrderDate columns and click on OK.
9.Now change the OrderData column's data type to Date:
Figure 9.19 – Change the data type
Centralizing ETL with dataflows 317
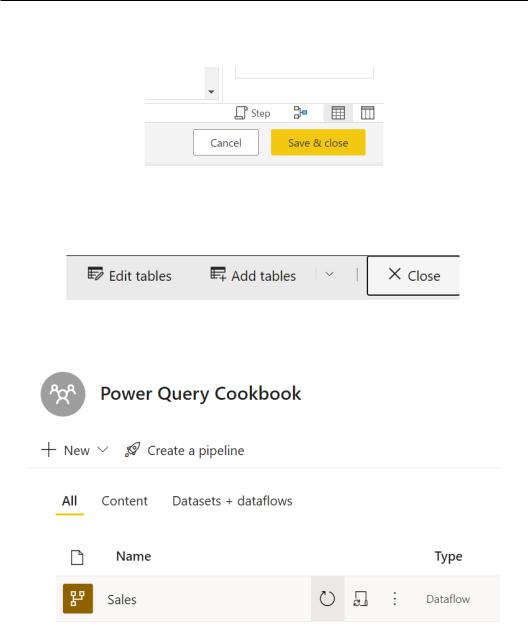
10.Now let's save this query and click on the Save & close button at the bottom right of the UI:
Figure 9.20 – Save & close button
11.Name this dataflow Sales and then click on Save.
12.Click on the Close button at the top right of the UI:
Figure 9.21 – Close dataflow view
13. Click on the refresh icon now to load the data in the underlying storage:
Figure 9.22 – Refresh icon
318 Performance Tuning with Power BI Dataflows
Following these steps, you have created the first dataflow. Now let's again perform steps 1 to 6 and 10 to13 for the CSV files containing DimProduct and DimTerritory. The only steps not to perform are the data transformation ones from 7 to 9.
When loading DimProduct and DimTerritory, refer to the following GitHub links when connecting through the Web API connector:
•https://github.com/PacktPublishing/Power-Query-Cookbook/ blob/main/Chapter09/DimProduct.csv
•https://github.com/PacktPublishing/Power-Query-Cookbook/ blob/main/Chapter09/DimTerritory.csv
When repeating step 6, rename the queries to DimProduct and DimTerritory, and at step 11, name the dataflows in the same way.
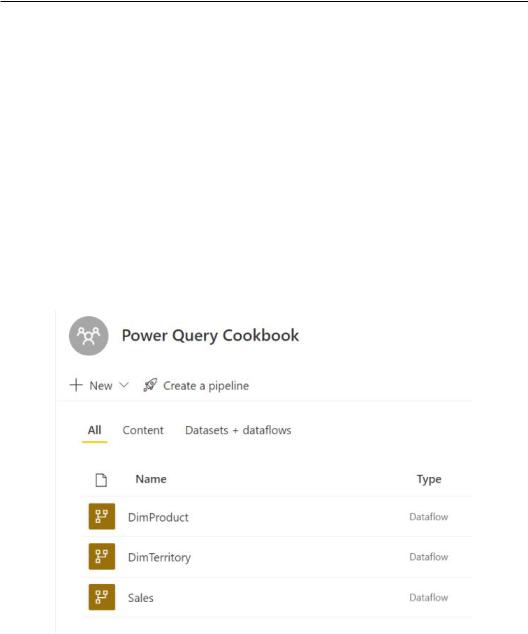
Once you have created these three dataflows, you will see them displayed within the workspace as in the following screenshot:
Figure 9.23 – Dataflows inside the workspace

Centralizing ETL with dataflows 319
Let's now see how we can use these three dataflows in Power BI. Once you open the Power BI Desktop application, perform the following steps:
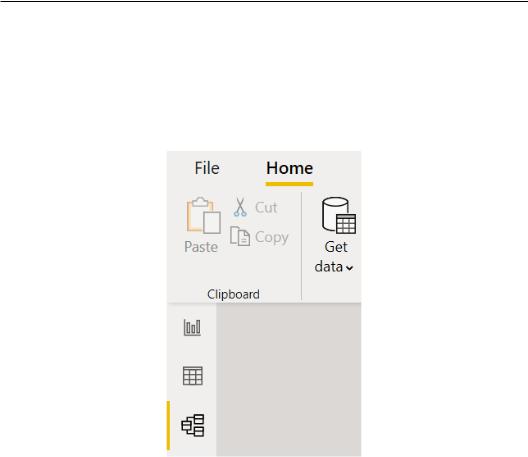
1. Click on Get data and select the Power BI dataflows connector:
Figure 9.24 – The Power BI dataflows connector
2.Authenticate with your user account and click on Connect. In this way, you will be able to access workspaces you have permission to and connect to dataflows:
Figure 9.25 – Power BI dataflows authentication
320Performance Tuning with Power BI Dataflows
3.The Navigator window will pop up, where you can see what dataflows you can connect to. Select the workspace where you have created the three dataflows Sales,
DimProduct, and DimTerritory. In this case, select Power Query Cookbook and then expand the three dataflows' names and flag DimProduct, DimTerritory, and InternetSales. On the right side, you can see a preview of the data, as in the following screenshot:
Figure 9.26 – Dataflow navigator
Centralizing ETL with dataflows 321
You can load and transform data as you normally do with any other data source. You can apply additional Power Query transformations from Power BI Desktop and then load data into your model. In this case, we will directly load the queries in the model.
4.After you have clicked Load, go to the Model view by clicking on the third icon tab on the left side of the UI:
Figure 9.27 – Model view icon
322 Performance Tuning with Power BI Dataflows
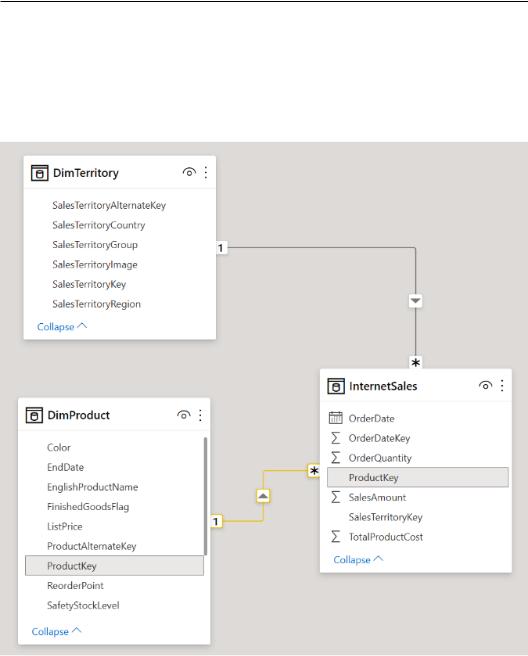
Check the relationships between the DimProduct and DimTerritory tables and InternetSales. You should see the relationships that have already been detected as shown in Figure 9.28 If not, hover your cursor on top of the ProductKey column in DimProduct and drag it to the same column in InternetSales and create a relationship. Repeat the same with DimTerritory to obtain something like in the following screenshot:
Figure 9.28 – Model view

Centralizing ETL with dataflows 323
5.Now go back to the Report view and create a visual as you like (in this recipe, we are focusing on the end-to-end flow; we will not focus on developing a report). In this case, we will quickly create a table like the following one:
Figure 9.29 – Visual creation
324Performance Tuning with Power BI Dataflows
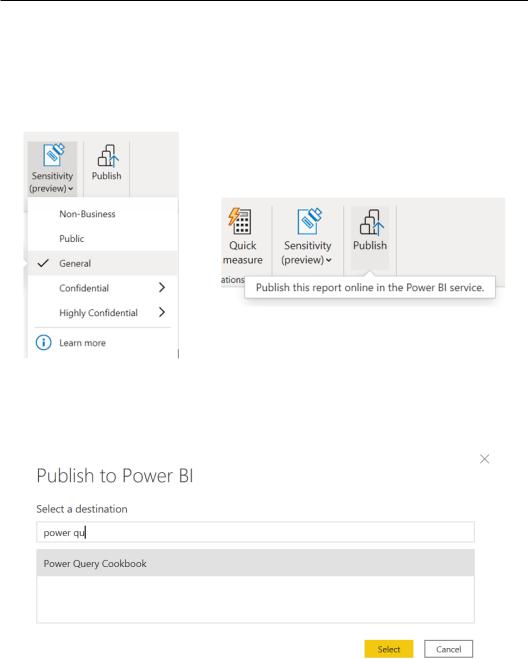
6.Now let's publish the report and its dataset to a workspace you have access to (in this case, we are using the same workspace where we developed the dataflows, Power Query Cookbook). Save the .pbix file somewhere on your PC, browse to the Home tab and apply the Sensitivity (preview) label General, then click on the Publish button as in the following screenshot:
Figure 9.30 – Sensitivity labels
7.Select the workspace you want to publish to the report and its dataset, then click on Select:
Figure 9.31 – Publish to the workspace
You have now connected to your dataflows. You have created a Power BI dataset and a report on top of that dataset.
Centralizing ETL with dataflows 325
Now, again, open your browser and open the workspace where you have published these elements and follow the next steps:
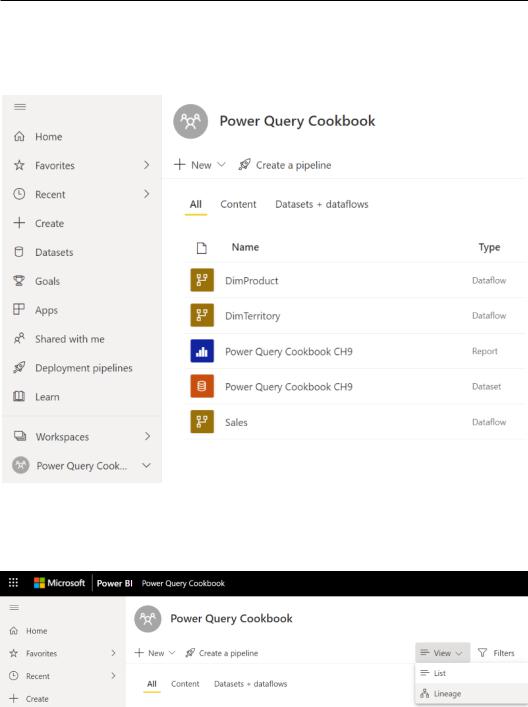
1. Observe the elements displayed in the workspace:
Figure 9.32 – Workspace view
2.Click on View and then on Lineage to see the preceding elements displayed in the lineage view:
Figure 9.33 – Lineage view button