- •Contributors
- •Table of Contents
- •Preface
- •Technical requirements
- •Installing a Power BI gateway
- •Getting ready
- •How it works
- •Authentication to data sources
- •Getting ready
- •How it works
- •Main challenges that Power Query solves
- •Getting ready
- •Technical requirements
- •Getting data and connector navigation
- •Getting ready
- •Creating a query from files
- •Getting ready
- •How it works...
- •Creating a query from a folder
- •Getting ready
- •How it works...
- •Creating a query from a database
- •Getting ready
- •How it works...
- •Creating a query from a website
- •Getting ready
- •How it works...
- •Technical requirements
- •Exploring Power Query Editor
- •Getting ready
- •Managing columns
- •Getting ready
- •Using data profiling tools
- •Getting ready
- •Using Queries pane shortcuts
- •Getting ready
- •Using Query Settings pane shortcuts
- •Getting ready
- •Using Schema view and Diagram view
- •Getting ready
- •Technical requirements
- •Formatting data types
- •Getting ready
- •Using first rows as headers
- •Getting ready
- •Grouping data
- •Getting ready
- •Unpivoting and pivoting columns
- •Getting ready
- •Filling empty rows
- •Getting ready
- •Splitting columns
- •Getting ready
- •Extracting data
- •Getting ready
- •Parsing JSON or XML
- •Getting ready
- •Exploring artificial intelligence insights
- •Getting ready
- •Technical requirements
- •Merging queries
- •Getting ready
- •Joining methods
- •Getting ready
- •Appending queries
- •Getting ready
- •Combining multiple files
- •Getting ready
- •Using the Query Dependencies view
- •Getting ready
- •Technical requirements
- •Setting up parameters
- •Getting ready
- •Filtering with parameters
- •Getting ready
- •Folding queries
- •Getting ready
- •Leveraging incremental refresh and folding
- •Getting ready
- •Disabling query load
- •Getting ready
- •Technical requirements
- •Using M syntax and the Advanced Editor
- •Getting ready
- •Using M and DAX – differences
- •Getting ready
- •Using M on existing queries
- •Getting ready
- •Writing queries with M
- •Getting ready
- •Creating tables in M
- •Getting ready
- •Leveraging M – tips and tricks
- •Getting ready
- •Technical requirements
- •Adding columns from examples
- •Getting ready
- •Adding conditional columns
- •Getting ready
- •Adding custom columns
- •Getting ready
- •Invoking custom functions
- •Getting ready
- •Clustering values
- •Getting ready
- •Technical requirements
- •Using Power BI dataflows
- •Getting ready
- •Centralizing ETL with dataflows
- •Getting ready
- •Building dataflows with Power BI Premium capabilities
- •Getting ready
- •Understanding dataflow best practices
- •Getting ready
- •Technical requirements
- •Exploring diagnostics options
- •Getting ready
- •Managing a diagnostics session
- •Getting ready
- •Designing a report with diagnostics results
- •Getting ready
- •There's more…
- •Using Diagnose as a Power Query step
- •Getting ready
- •Other Books You May Enjoy
- •Index
120Reshaping Your Data
6.You can see that now we have a defined schema with correct column headers:
Figure 4.20 – Cleaned data
When promoting rows to column headers, you will see that a Changed Type1 step is applied automatically.
Grouping data
We connect to a wide variety of data and usually connect to data with high levels of detail that it may not need for reporting. Instead of loading all data, we can define relevant aggregations and group data according to custom logic at the Power Query level. In this recipe, we will see how to define grouping logic and how to aggregate data easily.
Getting ready
For this recipe, you need to have Power BI Desktop running on your machine. You need to download the following file in a local folder:
• FactInternetSales CSV file
In this example, we will refer to the C:\Data folder.
Grouping data 121
How to do it
Once you open your Power BI Desktop application, you are ready to perform the following steps:
1.Click on Get Data and select the Text/CSV connector.
2.Browse to your local folder where you downloaded the FactInternetSales CSV file and open it. A window with a preview of the data will pop up. Click on
Transform Data.
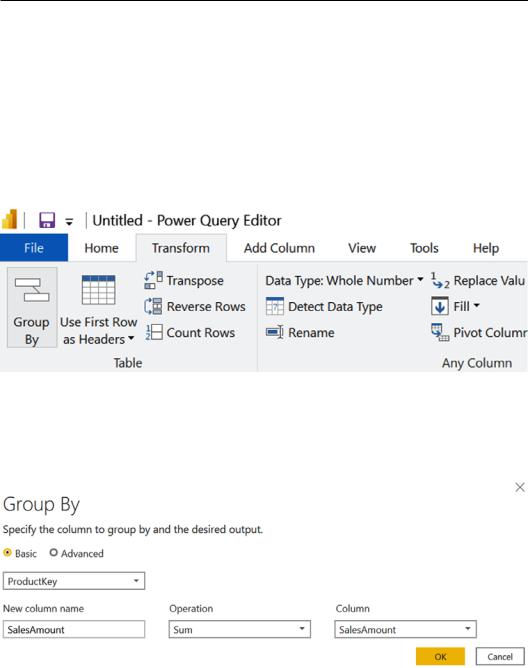
3.Browse to the Transform tab and click on Group By:
Figure 4.21 – Group By
4.Flag Basic and select the ProductKey column. In New column name, type
SalesAmount, define Sum as Operation and SalesAmount as the Column on which to perform the sum, and click OK:
Figure 4.22 – Group By Basic
122Reshaping Your Data
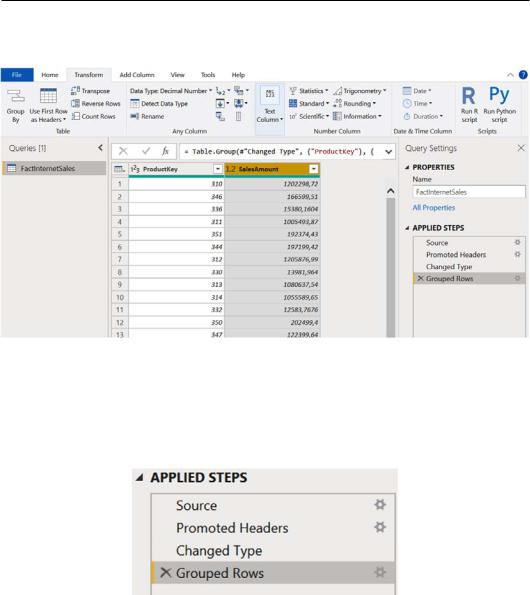
5.You can observe how the aggregation was performed by summing SalesAmount for each ProductKey:
Figure 4.23 – Group By output
This is a simple aggregation based on one column, but this feature allows you to apply advanced grouping logic, as shown in the following steps:
1.Double-click on the Grouped Rows step in order to open the Group By window and edit the step we defined previously:
Figure 4.24 – Grouped Rows step
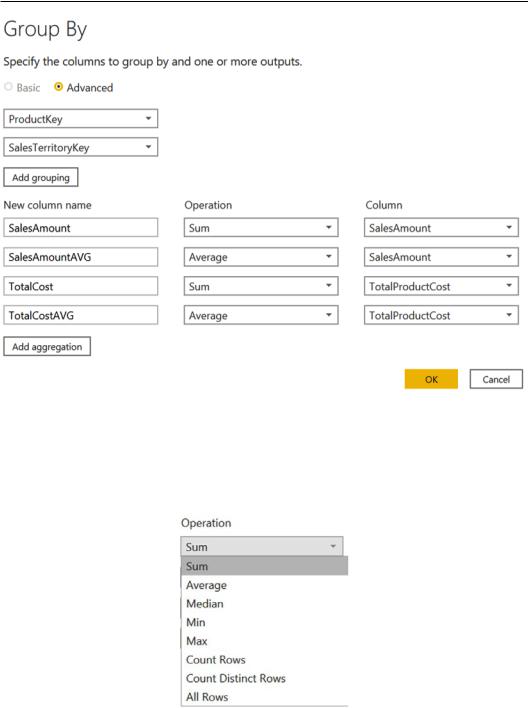
2. Flag Advanced and enter the information as seen in the following screenshot:
Grouping data 123
Figure 4.25 – Group By Advanced
3.You can see that we defined an advanced grouping logic that aggregates data by
ProductKey and TerritoryKey.
You have many possibilities on how to aggregate data. You can perform different built-in calculations, for example:
Figure 4.26 – Group By calculations