

Understanding dataflow best practices 341
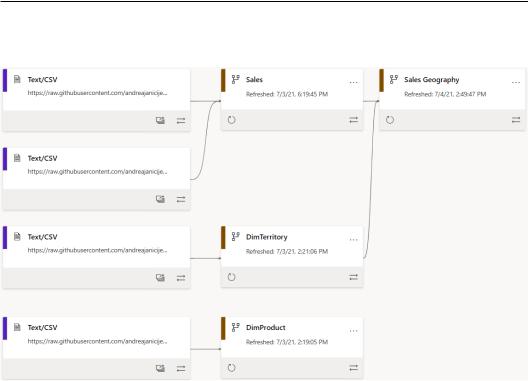
16.You can see, in the lineage view, how the different dataflows depend on each other and from where data is coming:
Figure 9.62 – Lineage view
Linked entities and computed entities are very useful when it comes to minimizing data replication and maximizing data consistency. You can create dataflow derivatives without reconnecting to the data sources, just by referring to existing dataflows.
Understanding dataflow best practices
When you create dataflows and use computed and linked entities, there are some suggestions on how to best optimize the creation, the configuration, and the use of dataflows in the Power BI environment. In this recipe, we will see some common best practices to take into consideration when modeling data with this powerful tool:
•Organizing your dataflows
•Structuring a data refresh
•Understanding the Common Data Model and Azure Data Lake Storage integration

342 Performance Tuning with Power BI Dataflows
Getting ready
For this recipe, you need to refer to the outputs of the previous two recipes and follow the reasoning presented.
It will be easier to follow the recipe's structure after having already created some dataflows.
How to do it...
Power BI dataflows is a powerful tool for centralized data preparation with a low-code approach and to know how to best leverage it, it is important to follow some suggestions for tasks that have always been associated with IT departments, such as extract-transform- load and staging tables.
Organizing your dataflows
The first thing to point out is that you should not have everything in one dataflow and you should not have all dataflows within one workspace.
Since dataflows are meant to be reused by multiple users for different workloads, it could become unmanageable to have all tables in one or a few dataflows. It is important to generally create two types of dataflows:
•Staging dataflows: You can create these dataflows to make the first load of data coming from original data sources (databases and source systems) and create the first layer of data that does not have any type of transformation, like in the following example:

Understanding dataflow best practices 343
Figure 9.63 – Lineage view for staging dataflows
In this case, you have raw data inside this workspace to which you can grant permissions to users to access and create their transformations.
•Transformation dataflows: This is the second layer of data that references not the original data sources, but the first layer, the staging dataflows.
Users have permissions to create linked tables and compute entities and build their dataflows, all pointing to one single source of truth, the staging ones. If you check the recipes in this chapter, you will see how you can combine tables coming from different dataflows and obtain something more complex like the following example within the same workspace as we saw in the previous recipe.

344 Performance Tuning with Power BI Dataflows
You can combine tables coming from different dataflows and obtain something more complex from other workspaces as in the following example:
Figure 9.64 – Linked entities in separate workspaces
In this case, we are referencing two dataflows coming from the Power Query Cookbook workspace and a Sales by Product table was created in the Power Query Cookbook 2 workspace by executing a computed entity.
You can create and manage multiple layers of dataflows and you can distribute them across different workspaces according to company departments and different project use cases.
If you see that a table is used frequently across many datasets, then you may find it useful to create a centralized dataflow and make it available to all users who need that table. Step by step, you can manage to create a complex and efficient extract-transform-load data architecture where you can control, thanks to the lineage view, where your data is most used with a low-code and business-friendly approach.
Structuring a data refresh
Another key topic regarding dataflows is refreshing data. Linking to the previous section, you may define a dataflow distribution across dataflows also according to refresh frequencies.
Tables with different refresh frequencies should stay in separate dataflows and, when possible, you should implement an incremental refresh.
Understanding dataflow best practices 345
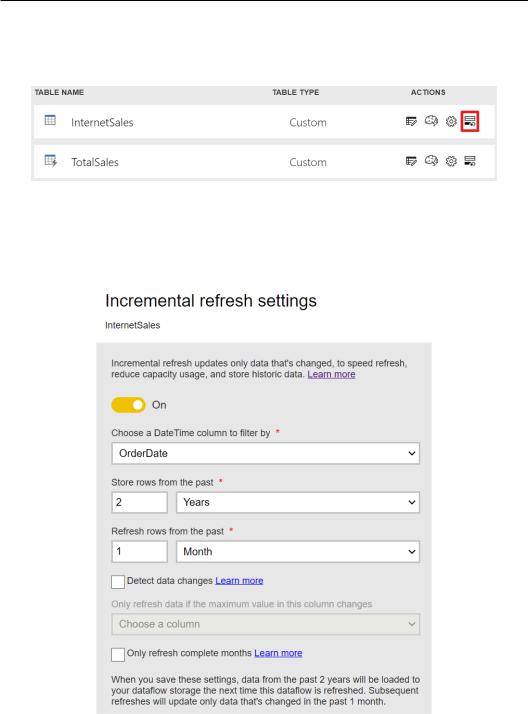
You can set up an incremental refresh when you click on a dataflow from the workspace view. Then, under the ACTIONS section, you can click on the Incremental refresh icon – the last one of the four icons displayed, as shown in red in the following screenshot:
Figure 9.65 – Incremental refresh icon
Once you click on the icon, a section on the right side of the page will pop up where you can enable the incremental refresh. Choose the DateTime column from your table and define the data storage options:
Figure 9.66 – Incremental refresh settings

346 Performance Tuning with Power BI Dataflows
You can check out Leveraging on incremental refresh and folding recipe in Chapter 6,
Optimizing Power Query Performance, to see how to apply this feature to your data and how storage and data refresh logic works.
Let's now concentrate on the relationship between dataflows and datasets when it comes to refreshing.
Following the example from the Centralizing ETL with dataflows recipe, where we realized an end-to-end flow from source to report, it is important to point out that when you trigger the refresh for a dataflow, the dataset will not be refreshed. You must manage the refreshing of these two elements separately, at least from the UI:
Figure 9.67 – Lineage view for dataflows, datasets, and reports
You can also use external tools such as Power Automate or a REST API to trigger the refresh sequentially.

Understanding dataflow best practices 347
Understanding the Common Data Model and Azure Data Lake Storage integration
If you've already had the chance to read the previous recipes in this chapter, you will have seen that we mentioned the underlying Power BI storage where the data of dataflows
is stored. You can access data stored in this underlying storage only with the Power BI dataflows connector and not from external tools.
This is something that happens by default if you do not define your storage resource to store data loaded in dataflows.
Power BI dataflows offer you the possibility to store data in Azure Data Lake Storage and access dataflow tables from external tools. You can create your data lake and link it to your Power BI environment in two ways:
•At the organization level, where all dataflows created will be stored inside one data lake. You can configure it from the Admin portal by clicking on Azure connections:
Figure 9.68 – Link an Azure data lake at an organization level

348Performance Tuning with Power BI Dataflows
•At the workspace level, where dataflows within one workspace will be stored inside the specific data lake linked to that workspace. You can set it up from the workspace
Settings and by clicking on Azure connections:
Figure 9.69 – Link an Azure data lake at the workspace level
Once you have linked your storage account, you can access this data from other tools within the Microsoft platform and also from third-party tools.
It is important to highlight that data is stored in a defined format, called the Common Data Model (CDM). The CDM is a shared data model, and it is a way of organizing data from different sources into a standard structure. The CDM includes over 340 standardized data schemas that Microsoft and its partners have published.
You can have a look at these schemas directly from the Power Query online UI. When you have a table open in edit mode, you can browse to the Home tab and click on Map to entity, which allows you to map your columns to a standard data structure:

Understanding dataflow best practices 349
Figure 9.70 – Map to entity button
You will open the Map to CDM entity window, where you can search entities, for example, Product, and then you can map the columns of your query output to attributes of a standard CDM entity. There are multiple entities, such as Account, Address, Product,
Social Activity, and many more.
Figure 9.71 – Map to CDM entity window
350 Performance Tuning with Power BI Dataflows
The CDM allows the data to be unified in a well-known form with semantic meaning, and it simplifies the integration of data between different apps that use CDM standard entities, enabling these applications to easily read and understand the data.
But how is data organized in Azure Data Lake Storage? It is organized in folders and data is stored in CSV files. In the following example, you can see the backend structure of
a dataflow saved in a workspace:
Figure 9.72 – CDM format in the Azure data lake
When you connect to Azure Data Lake Storage, when you load the first dataflow, a folder will be created underneath with the name of the workspace. Then a folder with the dataflow name is created and inside it, there are the following elements:
•model.json: In this file, you can find metadata, a set of data that describes and gives information about tables' column names, data types, mapping to standard entities, and more.
•model.json.snapshots: The same logic as the file before, storing historical metadata information from previous versions.
•entity name: In this case, InternetSales.
•Entity name folder with CSV snapshots: Historical CSV snapshots saved after each data refresh, in this case, InternetSales.csv.snapshots.
•CSV file(): The file where the current dataflow entity is stored, in this case, InternetSales.CSV.snapshots/InternetSales.csv@ snapshot=2020-10-27T14:40:43.6798252Z.

Understanding dataflow best practices 351
If you add transformation steps and refresh your data, the above elements will be refreshed accordingly, and a snapshot of the previous version will be stored and accessible from external tools.
It is important to understand how CDM is structured because when you create
a dataflow, you are offered other options on how to create dataflows, as shown in the following screenshot:
Figure 9.73 – CDM options to create dataflows
The other two options that you can use to leverage Power BI dataflows are the following:
•Import Model: If external systems generate the CDM format in the lake, you can attach that form here without connecting to source systems, but you can map in the Power BI workspace something that already exists in the lake.
•Attach a Common Data Model folder (preview): You can attach an existing folder to the Azure data lake and make it visible from the Power BI service as a Power BI dataflow.