


Adding custom columns 283
Moreover, you can use dynamic values both as input values and outputs by using column values or parameters.
Figure 8.25 – Different value options
It is important to correctly define the order of the conditions. Applying it to our recipe will work as follows:
1.All unit prices higher than 3000 will be flagged as High since these rows satisfy that first condition.
2.Then, all prices higher than 2000, except ones already flagged by the first condition, will be flagged as Medium-High.
3.Then, all prices higher than 1000, except ones already flagged by the first and second conditions, will be flagged as Medium.
4.All other prices will be flagged as Low.
By paying attention to the order and selecting the right value, you can use conditional columns to create and enrich your data by applying conditions to different data types and defining custom outputs.
Adding custom columns
Once you have become more confident with Power Query M code, you can also enrich data content by writing formulas and expressions directly thanks to the custom columns feature. In this recipe, you will see an example of how to browse this section and create columns with calculations that are not available in the form of built-in features in the Power Query UI.
Getting ready
For this recipe, you need to download the FactInternetSales CSV file. In this example, we will refer to the C:\Data folder.
284 Adding Value to Your Data
How to do it…
Once you open your Power BI Desktop application, you are ready to perform the following steps:
1.Click on Get data and select the Text/CSV connector.
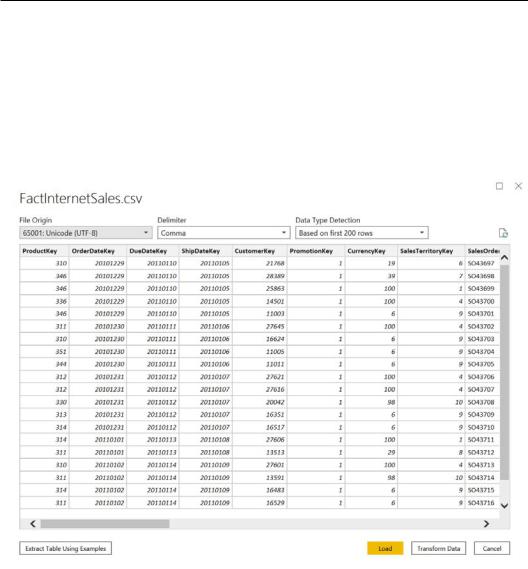
2.Browse to your local folder where you downloaded the FactInternetSales CSV file and open it. The following window with a preview of the data will pop up; click on Transform Data:
Figure 8.26 – CSV data preview
Adding custom columns 285
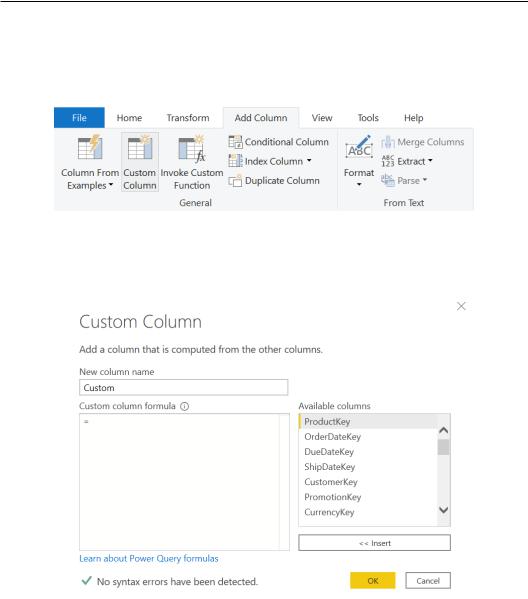
3.Imagine you want to calculate how many days have passed between two dates, in this case, between the ship and order dates. You can do that easily by leveraging the Duration.Days() M function, which can be applied in the Custom Column section. Browse to the Add Column tab and click on the Custom Column button.
Figure 8.27 – Custom Column button
4.The Custom Column window will pop up and you will have the chance to create an output column from an M expression by referencing other existing columns.
Figure 8.28 – Custom Column window
286Adding Value to Your Data
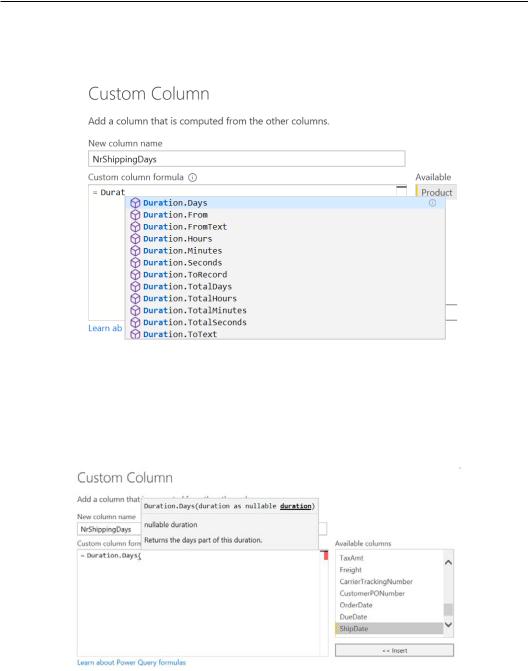
5.Assign a new column name, in this case, NrShippingDays, and start typing the Duration.Days function. You will see IntelliSense working live when presented with function options.
Figure 8.29 – IntelliSense formula engine
6.Once you have typed the function and opened the first bracket, you do not have to necessarily write down the names of the columns, but you can use the section on the right with the columns list to directly insert the query you need rather than writing it from scratch, as shown in the following screenshot:
Figure 8.30 – Formula definition

Adding custom columns 287
Once you have clicked on < < Insert, you will see the column appearing in the
Custom column formula section.
Figure 8.31 – Formula definition
Do not worry about the red squiggly line because it appears since the format is temporarily not right (there are missing brackets essentially).
7.Complete the function by adding a minus (-) and the date to be subtracted, OrderDate, and then close the brackets and click on OK.
Figure 8.32 – Adding existing columns
You can notice how the message in the bottom left confirms No syntax errors have been detected.

288Adding Value to Your Data
8.You can now see the new column created.
Figure 8.33 – New column added
You can also create more dynamic calculations. Imagine you want to calculate the difference between today's date and the order date or any other date value. You would have to replace [ShipDate] in the previous formula with the DateTime.LocalNow() function, as shown:
Figure 8.34 – Second formula definition