

278Adding Value to Your Data
5.See how the concatenation was performed by having a look at the M code applied, and then click on OK.
Figure 8.15 – M code generated by the step
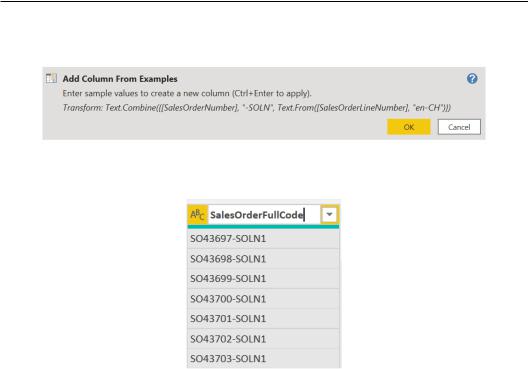
6. At the end, rename the column SalesOrderFullCode.
Figure 8.16 – Column renaming
Adding columns from examples offers different options when you do not want to code directly with M or when you know exactly what the desired output is but you are not sure which transformation options in Power Query to use.
Adding conditional columns
You can also enrich your queries by adding columns with if…then logic and applying some conditions based on existing columns. These are called conditional columns and this feature allows you to implement conditional expressions with an intuitive interface. In this recipe, you will see how it is easy to apply custom flags based on the values of existing columns.
Getting ready
For this recipe, you need to download the FactInternetSales CSV file. In this example, we will refer to the C:\Data folder.
Adding conditional columns 279
How to do it…
Once you open your Power BI Desktop application, you are ready to perform the following steps:
1.Click on Get data and select the Text/CSV connector.
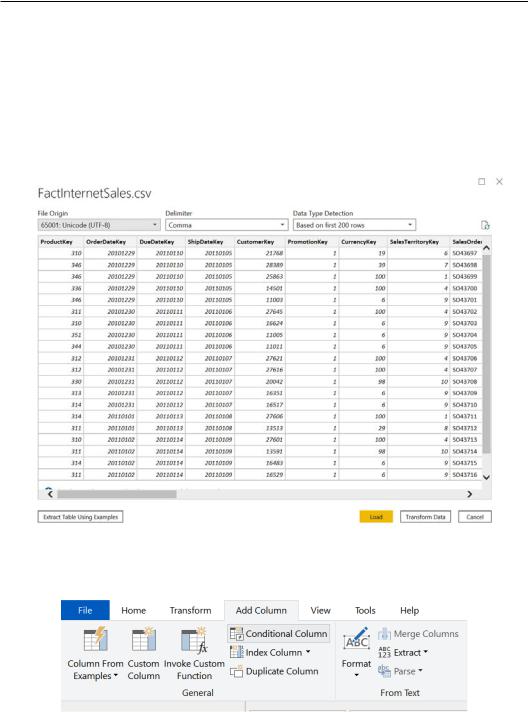
2.Browse to your local folder where you downloaded the FactInternetSales CSV file and open it. The following window with a preview of the data will pop up; click on Transform Data:
Figure 8.17 – CSV data preview
3. Browse to the Add Column tab and click on Conditional Column.
Figure 8.18 – Conditional Column button
280Adding Value to Your Data
4.The Add Conditional Column window will pop up, as in the following screenshot:
Figure 8.19 – Add Conditional Column window
5.Name the new column PriceLevel and start creating the first condition by selecting UnitPrice from the first dropdown after If.
Figure 8.20 – Defining the condition
Adding conditional columns 281
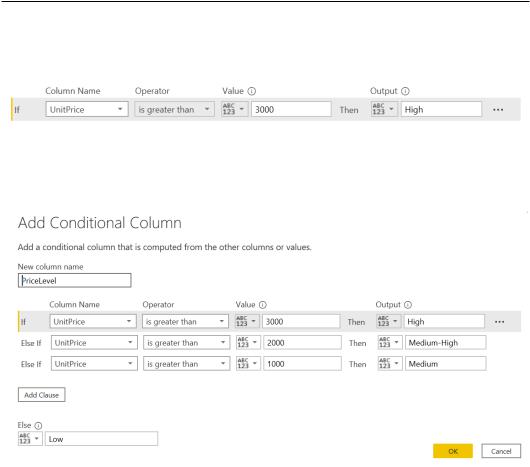
6.Then select is greater than from the Operator dropdown and enter 3000 for Value and High for Output, as in the following example, in order to label unit prices higher than 3000 with the High flag:
Figure 8.21 – Defining Value and Output
7.Then, click on Add Clause in order to add another two conditions and fill them in, as in the following screenshot. At the end, click on OK.
Figure 8.22 – Defining multiple conditions
282 Adding Value to Your Data
With this example, we are stating that products with UnitPrice higher than 3000 have to be labeled as High, between 2000 and 3000 as Medium-High, and between 1000 and 2000 as Medium, and if any of these conditions are not met, the label should be Low (defined by the input in the Else section on the bottom left in the preceding figure).
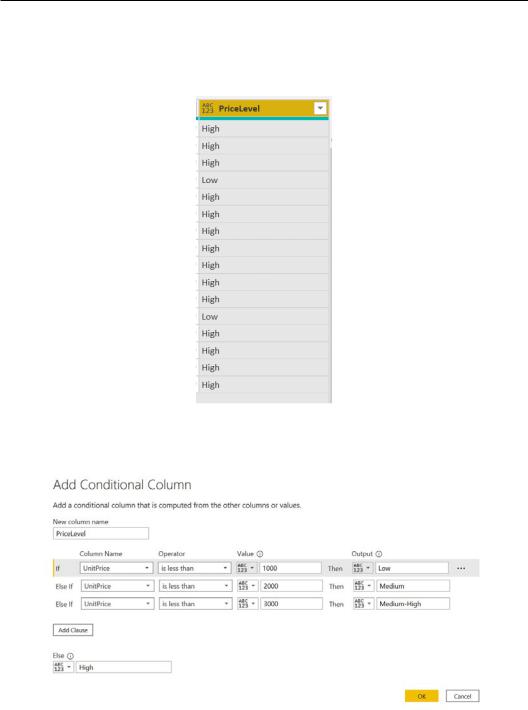
Figure 8.23 – New column created
The same PriceLevel column output could be achieved by setting up the conditions as follows:
Figure 8.24 – Defining a different order