

C H A P T E R 3
Working with Scalable Vector Graphics
In this chapter, we’ll explore what you can do with another graphics feature in HTML5: Scalable Vector Graphics. Scalable Vector Graphics, or SVG, is an expressive language for two dimensional graphics.
Overview of SVG
In this section we’ll look at the standard vector graphics support in HTML5 browsers, but first, let’s review a couple of graphics concepts: raster and vector graphics.
In raster graphics, an image is represented by a two dimensional grid of pixels. The HTML5 Canvas 2d API is an example of a raster graphics API. Drawing with the Canvas API updates the canvas’s pixels. PNG and JPEG are examples of raster image formats. The data in PNG and JPEG images also represents pixels.
Vector graphics are quite different. Vector graphics represent images with mathematical descriptions of geometry. A vector image contains all of the information needed to draw an image from high-level geometric objects such as lines and shapes. As you can tell by the name, SVG is an example of vector graphics. Like HTML, SVG is a file format that also has an API. SVG combined with the DOM APIs form a vector graphics API. It is possible to embed raster graphics such as PNG images inside of SVG, but SVG is primarily a vector format.
History
SVG has been around for a few years. SVG 1.0 was published as a W3C recommendation in 2001. SVG was originally available in browsers with the use of a plugin. Shortly afterward, browsers added native support for SVG images.
Inline SVG in HTML has a shorter history. A defining characteristic of SVG is that it is based on XML. HTML, of course, has a different syntax, and you cannot simply embed XML syntax inside of HTML documents. Instead, it has special rules for SVG. Prior to HTML5, it was possible to embed SVG as <img> elements inside an HTML page or link to self-contained .svg documents. HTML5 introduced inline SVG, in which SVG elements themselves can appear in HTML markup. Of course, in HTML, the syntax rules are more relaxed than in XML. You can have unquoted attributes, mixed capitalization, and so on. You will still need to use self-closing tags when appropriate. For example, you can embed a circle into your HTML document with just a little markup:
<svg height=100 width=100><circle cx=50 cy=50 r=50 /></svg>
63
CHAPTER 3 WORKING WITH SCALABLE VECTOR GRAPHICS
Understanding SVG
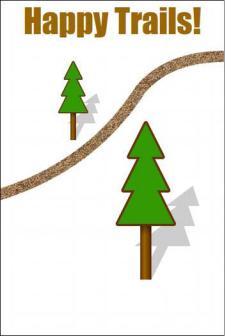
Figure 3-1 shows an HTML5 document with the Happy Trails! image we drew with the canvas API in Chapter 2. If you read the title of this chapter, you can probably guess that this version was drawn with SVG. SVG lets you do many of the same drawing operations as the canvas API. Much of the time, the results can be visually identical. There are some important invisible differences, however. For one thing, the text is selectable. You don’t get that with canvas! When you draw text onto a canvas element, the characters are frozen as pixels. They become part of the image and cannot change unless you redraw a region of the canvas. Because of that, text drawn onto a canvas is invisible to search engines. SVG, on the other hand, is searchable. Google, for instance, indexes the text in SVG content on the web.
Figure 3-1. SVG version of Happy Trails!
SVG is closely related to HTML. If you choose, you can define the content of an SVG document with markup. HTML is a declarative language for structuring pages. SVG is a complimentary language for creating visual structures. You can interact with both SVG and HTML using DOM APIs. SVG documents are live trees of elements that you can script and style, just like HTML. You can attach event handlers to SVG elements. For example, you can use click event handlers to make SVG buttons or shaped clickable regions. That is essential for building interactive applications that use mouse input.
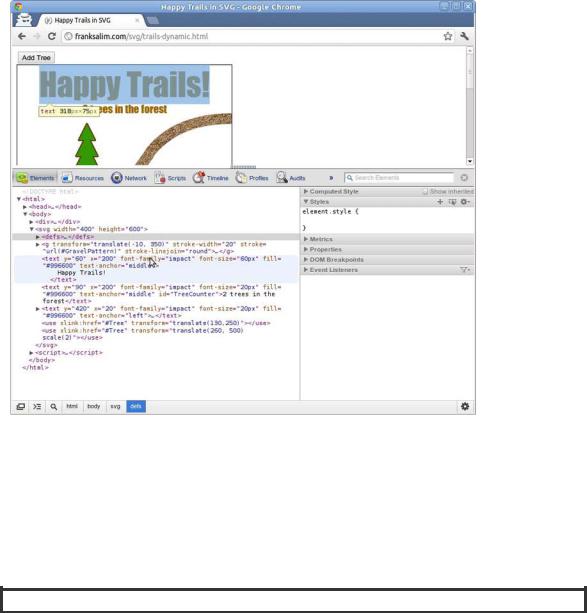
Additionally, you can view and edit the structure of the SVG in your browser’s development tool. As you can see in Figure 3-2, inline SVG embeds directly into the HTML DOM. It has a structure you can observe and change at runtime. You can dig into SVG and see its source, unlike an image that is just a grid of pixels.
64
CHAPTER 3 WORKING WITH SCALABLE VECTOR GRAPHICS
Figure 3-2.Looking at the SVG elements in ChromeWeb Inspector
In Figure 3-2, the highlighted text element contains the following code:
<text y="60" x="200" font-family="impact" font-size="60px" fill="#996600" text-anchor="middle">
Happy Trails </text>
In the development environment you can add, remove, and edit SVG elements. The changes take effect instantly in the active page. This is extremely convenient for debugging and experimenting.
RETAINED-MODE GRAPHICS
Frank says: “There are two schools of thought in graphics API design. Immediate-mode graphics like canvas provide a drawing interface. API calls cause a drawing action to occur immediately, hence the name. The counter style to immediate mode-graphics is called retained-mode. In retained-mode graphics, there is a model of the visual objects in the scene that is retained over time. There is an API to manipulate
65
CHAPTER 3 WORKING WITH SCALABLE VECTOR GRAPHICS
the scene graph, and the graphics engine redraws the scene when it changes. SVG is retained-mode graphics in which its scene graph is the document. The API to manipulate SVG is the W3C DOM API.
There are JavaScript libraries that build-retained mode APIs on top of canvas. Some also provide sprites, input handling, and layers. You may choose to use such a library, but remember that these features and more are native in SVG!”
Scalable Graphics
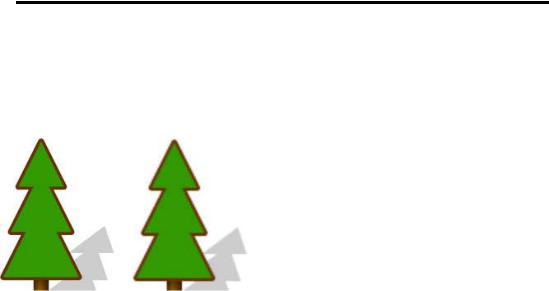
When you magnify, rotate, or otherwise transform SVG content, all of the lines making up the image are crisply redrawn. SVG scales without losing quality. The vector information that makes up an SVG document is preserved when it is rendered. Contrast that with pixel graphics. If you magnify a pixel graphic like a canvas or an image, it becomes blurry. That is because the image is composed of pixels that can only be resampled at a higher resolution. The underlying information—the paths and shapes that went into making the image—is lost after drawing (see Figure 3-3).
Figure 3-3. Closeups of SVG and canvas at 500% magnification
Creating 2D Graphics with SVG
Let’s look again at the Happy Trails! image from Figure 3-1.Every visible part of this SVG drawing has some corresponding markup. The complete SVG language is quite extensive, and all of its details and nuances will not fit in this chapter. However, to get a glimpse of the breadth of the SVG vocabulary, here are some of the features used to draw Happy Trails:
•Shapes
•Paths
•Transformations
•Patterns and Gradients
•Reusable Content
•Text
Let’s look at each of these in turn before we combine them into a complete scene. Before we can do that, though, we’ll need to see how to add SVG to a page.
66