- •Table of Contents
- •About the Author
- •Dedication
- •Foreword
- •Acknowledgments
- •Why Does Office 365 Have Better Features?
- •Which Version of Office 365 Has Power Pivot?
- •Why Do I Have to Sign in to Excel?
- •How Can I Use Excel on Dual Monitors?
- •How Can I Open The Same Workbook Twice?
- •Find Icons on the Ribbon
- •Where is File, Exit?
- •Where Are My Macros?
- •Customizing the Ribbon
- •Go Wide
- •Minimize the Ribbon to Free Up a Few More Rows
- •Use a Wheel Mouse to Scroll Through The Ribbon Tabs
- •Why Do The Charting Ribbon Tabs Keep Disappearing?
- •Use Dialog Launchers For More Choices
- •Icon, Dropdowns, and Hybrids
- •Zoom is at the Bottom
- •Make Your Most-Used Icons Always Visible
- •The Excel 2003 Alt Keystrokes Still Work (If You Type Them Slowly Enough)
- •Use Keyboard Shortcuts to Access the Ribbon
- •Why Do I Have Only 65,536 Rows?
- •Which File Format Should I Use?
- •Why Does The File Menu Cover The Entire Screen?
- •How Do I Close The File Menu?
- •Increase the Number of Workbooks in the Recent Files List
- •Change All Print Settings in Excel
- •I Just Want The Old Print Preview Back
- •Get Quick Access to Formatting Options Using the Mini Toolbar
- •What Is Protected Mode?
- •Use a Trusted Location to Prevent Excel’s Constant Warnings
- •My Manager Wants Me to Create a New Expense Report from Scratch
- •Open a Copy of a Workbook
- •Open Excel with Ctrl+Alt+X
- •Have Excel Always Open Certain Workbook(s)
- •Set up Excel Icons to Open a Specific File on Startup
- •Use a Macro to Customize Startup
- •Control Settings for Every New Workbook and Worksheet
- •Excel Says I Have Links, But I Can Not Find Them
- •Automatically Move the Cell Pointer After Enter
- •Return to the First Column After Typing the Last Column
- •Enter Data in a Circle (Or Any Pattern)
- •How to See Headings as You Scroll Around a Report
- •How to See Headings and Row Labels as You Scroll Around a Report
- •Why is the Scrollbar Slider Suddenly Tiny?
- •Why Won’t My Scrollbar Scroll to My Charts?
- •Jump to the Edge of the Data
- •Jump to Next Corner of Selection
- •Ctrl+Backspace brings the Active Cell into View
- •Zoom with the Wheel Mouse
- •Copy a Formula to All Data Rows
- •A Faster Way To Paste Values
- •Quickly Turn a Range on Its Side
- •Quickly Rearrange Rows Or Columns
- •Quickly Copy Worksheets
- •Use Group Mode to Change All Worksheets
- •Find Text Numbers
- •Why Can’t Excel Find a Number?
- •Mix Formatting In A Single Cell
- •Enter a Series of Months, Days, or More by Using the Fill Handle
- •Have the Fill Handle Fill Your List of Part Numbers
- •Teach Excel to Fill A, B, C
- •Add Total to the End of Jan, Feb, ... Dec
- •Put Date & Time in a Cell
- •Use Excel as a Word Processor
- •Add Excel to Word
- •Use Hyperlinks to Create an Opening Menu for a Workbook
- •Spell check a Region
- •Stop Excel from AutoCorrecting Certain Words
- •Use AutoCorrect to Enable a Shortcut
- •Why Won’t the Track Changes Feature Work in Excel?
- •Simultaneously Collaborate on a Workbook with Excel Web App
- •How to Print Titles at the Top of Each Page
- •Print a Letter at the Top of Page 1 and Repeat Headings at the Top of Each Subsequent Page
- •How to Print Page Numbers at the Bottom of Each Page
- •How to Make a Wide Report Fit to One Page Wide by Many Pages Tall
- •Add a Printable Watermark
- •Print Multiple Ranges
- •Add a Page Break at Each Change in Customer
- •Save My Worksheet as a PDF File
- •Send an Excel File as an Attachment
- •Save Excel Data as a Text File
- •Close All Open Workbooks
- •I Just Closed an Unsaved Workbook
- •Roll Back to an AutoSaved Version
- •Have Excel Talk to You
- •Enter Special Symbols
- •What Do All the Triangles Mean?
- •Why does Excel Insert Cell Addresses When I Edit In a RefEdit Box?
- •F4 Repeats Last Command
- •Print all Excel Keyboard Shortcuts
- •Create a Personal Macro Workbook
- •Macro to Toggle Positive to Negative
- •Assign a Macro to a Shortcut Key
- •Assign a Macro to a Toolbar Icon
- •Use a Macro to Change Case to Upper, Lower, or Proper
- •Get Free Excel Help
- •Start a Formula with = or +
- •Three Methods of Entering Formulas
- •Why Does Excel 2013 Look Like A Slot Machine?
- •Use Parentheses to Control the Order of Calculations
- •Long Formulas in the Formula Bar
- •Copy a Formula That Contains Relative References
- •Copy a Formula While Keeping One Reference Fixed
- •Create a Multiplication Table
- •Calculate a Sales Commission
- •Simplify the Entry of Dollar Signs in Formulas
- •Learn R1C1 Referencing to Understand Formula Copying
- •Create Easier-to-Understand Formulas with Named Ranges
- •See All Named Ranges at 39% Zoom
- •Use Named Constants to Store Numbers
- •Total Without Using a Formula
- •Add or Multiply Two Columns Without Using Formulas
- •Type 123 to Enter 1.23
- •Join Two Text Columns
- •Concatenate Several Cells
- •Join Text with a Date or Currency
- •Break Data Apart Using Flash Fill
- •Parse Data using Text to Columns
- •Excel Is Randomly Parsing Pasted Data
- •I Lose Leading Zeroes From CSV Files
- •Open CSV File With Dates in D/M/Y Format
- •Handle Dates in YYYYMMDD format
- •My G/L Software Uses a Trailing Minus for Negative Numbers
- •Parse Data With Leader Lines
- •Parse Multi-Line Cells
- •Change Smith, Jane to Jane Smith
- •Convert Numbers to Text
- •Fill a Cell with Repeating Characters
- •CLEAN Hasn’t Kept Up With The Times
- •Add the Worksheet Name as a Title
- •Use AutoSum to Quickly Enter a Total Formula
- •AutoSum Doesn’t Always Predict My Data Correctly
- •Use the AutoSum Button to Enter Averages, Min, Max, and Count
- •Ditto The Formula Above
- •The Count Option of the AutoSum Dropdown Doesn’t Appear to Work
- •Total the Red Cells
- •Automatically Number a List of Employees
- •Automatically Number the Visible Rows
- •Discover New Functions Using the fx Button
- •Get Help on Any Function While Entering a Formula
- •Use F9 in the Formula Bar to Test a Formula
- •Quick Calculator
- •When Entering a Formula, You Get the Formula Instead of the Result
- •Highlight All Formula Cells Using Conditional Formatting
- •You Change a Cell in Excel but the Formulas Do Not Calculate
- •Calculate One Range
- •Why Use the Intersection Operator?
- •Understand Implicit Intersection
- •Find the Longest Win Streak
- •Add B5 On All Worksheets
- •Consider Formula Speed
- •Exact Formula Copy
- •Calculate a Loan Payment
- •Calculate Many Scenarios for Loan Payments
- •Back into an Answer Using Goal Seek
- •Create an Amortization Table
- •Do 40 What-if Analyses Quickly
- •Random Walk Down Wall Street
- •What-If For 3 Or More Variables
- •Rank Scores
- •Round Numbers
- •Round to the Nearest $0.05 with MROUND
- •Round Prices to the Next Highest $5
- •Round 0.5 towards Even Per ASTM-E29
- •Separate the Integer From the Decimals
- •Why Is This Price Showing $27.85000001 Cents?
- •Calculate a Percentage of Total
- •Calculate a Running Percentage of Total
- •Use the ^ Sign for Exponents
- •Raise a Number to a Fraction to Find the Square or Third Root
- •Calculate a Growth Rate
- •Find the Area of a Circle
- •Figure Out Lottery Probability
- •Help Your Kids with Their Math
- •Convert Units
- •XOR Only Works Correctly for Two Values
- •Find the Second Largest Value
- •Format Every Other Row in Green
- •\Use IF to Calculate a Bonus
- •IF with Two Conditions
- •Tiered Commission Plan with IF
- •Display Up/Down Arrows
- •Stop Showing Zeroes in Cell Links
- •Count Records That Match a Criterion
- •Build a Table That Will Count by Criteria
- •Sum Records That Match a Criterion
- •Can the Results of a Formula Be Used in SUMIF?
- •Calculate Based on Multiple Conditions
- •Avoid Errors Using IFERROR
- •Use VLOOKUP to Join Two Tables
- •Every VLOOKUP Ends in False
- •Lookup Table Does Not Have to Be Sorted
- •Beware of #N/A from VLOOKUP
- •Add New Items to the Middle Of Your Lookup Table
- •Consider Naming the Lookup Table
- •Remove Leading and Trailing Spaces
- •Your Lookup Table Can Go Across
- •Copy a VLOOKUP Across Many Columns
- •INDEX Sounds Like an Inane Function
- •You Already Know MATCH, Really!
- •INDEX Sounds Like an Inane Function - II
- •VLOOKUP Left
- •Fast Multi-Column VLOOKUP
- •Speed Up Your VLOOKUP
- •Return the Next Larger Value in a Lookup
- •Two-Way Lookup
- •Combine Formulas into a Mega-Formula
- •Combine Two Lists Using VLOOKUP
- •Watch for Duplicates When Using VLOOKUP
- •Return the Last Entry
- •Return the Last Matching Value
- •Sum All of the Lookups
- •Embed a Small Lookup Table In Formula
- •I Don’t Want to Use a Lookup Table to Choose One of Five Choices
- •Is there Something More Flexible than CHOOSE?
- •Lookup Two Values
- •Add Comments to a Formula
- •Create Random Numbers
- •Randomly Sequence a List
- •Play Dice Games with Excel
- •Generate Random Without Repeats
- •Calculate a Trendline Forecast
- •Forecast Data with Seasonality
- •Build a Model to Predict Sales Based on Multiple Regression
- •Switching Columns into Rows Using a Formula
- •SUM a Range that is C5 Rows Tall Using OFFSET
- •Replace Volatile OFFSET with INDEX
- •How Can You Test for Volatility?
- •Whatever Happened to the @@ Function?
- •Tables Are Like a Database in Excel
- •Dealing with Table Formulas
- •Rename Your Tables
- •Charts , VLOOKUP & Pivots Expand With The Table
- •Before Deleting a Cell, Find out if Other Cells Rely on It
- •Calculate a Formula in Slow Motion
- •Which Cells Flow into This Cell?
- •Color all Precedents or Dependents
- •Monitor Distant Cells
- •Auditing Worksheets with Inquire
- •Use Real Dates
- •How Can I Tell If Have Real Dates?
- •Convert Text Dates to Real Dates
- •Format Dates
- •Format Dates As Quarters or Weeks
- •Display Monthly Dates
- •Add a Column to Show Month or Weekday
- •Calculate First of Month
- •Calculate the Last Day of the Month
- •Calculate Invoice Due Dates
- •Calculate Receivable Aging
- •NOW, or TODAY?
- •Find the Last Sunday Of the Month
- •Calculate Work Days
- •Calculate Work Days for a Farmers Market
- •Calculate Age in Years, Months, Days
- •Coerce an Array of Dates from 2 Dates
- •Use Real Times
- •Strangeness of Time Formatting
- •Convert Time to Decimal Hours
- •Calculate with Time
- •Enter Minutes and Seconds
- •Convert Text to Time
- •Can Excel Track Negative Time?
- •Fill Blanks With Value Above
- •See Formulas in Excel 2013
- •Create a Bell Curve in Excel
- •Change from Lower to Upper Case in Excel
- •Spell Out Numbers in Excel
- •Copy Macro Code from the Internet Into an Add-In
- •Return Data from a Webservice in Excel 2013
- •Add New Functions to Excel with Fast Excel SpeedTools Extras
- •=SUM(B1:B5) is Better Than =B1+B2+B3+B4+B5
- •How to Set up Your Data for Easy Sorting and Subtotals
- •How to Fit a Multiline Heading into One Cell
- •No Tiny Blank Columns Between Columns
- •How to Sort Data
- •Sort Days of the Week
- •Sort a Report into a Custom Sequence
- •Sort All Red Cells to the Top of a Report
- •Sort Pictures With Data
- •Quickly Filter a List to Certain Records
- •Use Search While Filtering
- •Filter by Selection
- •Use AutoSum After Filtering
- •Filter Only Some Columns
- •Find the Unique Values in a Column
- •Use Advanced Filter
- •Replace Multiple Filter Criteria with a Single Row of Formulas
- •Add Subtotals to a Data set
- •Use Group & Outline Buttons to Collapse Subtotaled Data
- •Manually Apply Groups
- •Group Report Sections
- •Copy Just Totals from Subtotaled Data
- •Sort Largest Customers to the Top
- •Select 100 Columns in Subtotals
- •Enter a Grand Total of Data Manually Subtotaled
- •Add Other Text to the Subtotal Lines
- •Subtotals by Product Within Region
- •Format the Subtotal Rows
- •My Manager Wants a Blank Line After Each Subtotal
- •Subtotal One Column and Count Another Column
- •Can You Get Medians?
- •Horizontal Subtotals
- •Be Wary
- •Send Error Reports
- •Help Make Excel Better
- •Remove Blank Rows from a Range
- •Remove Blanks from a Range While Keeping the Original Sequence
- •Double Space Your Data Set
- •Use Find to Find an Asterisk
- •Use an Ampersand in a Header
- •Hide Zeros & Other Custom Number Formatting Tricks
- •Use Consolidation to Combine Two Lists
- •Combine Four Quarterly Reports
- •Find Total Sales by Customer by Combining Duplicates
- •Remove Duplicates
- •Preview Remove Duplicates Without Removing Them
- •Protect Cells That Contain Formulas
- •Find Differences In Two Lists
- •Number Each Record, Starting at 1 for a New Customer
- •Deal with Data in Which Each Record Takes Five Physical Rows
- •Add a Customer Number to Each Detail Record
- •Use a Built-in Data Entry Form
- •Cell AutoComplete Stopped Working
- •Data Cleansing with Flash Fill in Excel 2013
- •Flash Fill was there and is now Gone
- •Flash Fill Was Not Perfect
- •Flash Fill Won’t Fill Numbers
- •Flash Fill and Dates
- •Flash Fill and Ambiguous Data
- •Use a Pivot Table to Summarize Detailed Data
- •Your Manager Wants Your Report Changed
- •Add or Remove Fields from an Existing Pivot Table
- •Summarize Pivot Table Data by Three Measures
- •Why Does the Pivot Table Field List Keep Disappearing?
- •Move or Change Part of a Pivot Table
- •See Detail Behind One Number in a Pivot Table
- •Use Multiple Value Fields as a Column or Row Field
- •Update Data Behind a Pivot Table
- •Why do I Get a Count Instead of a Sum?
- •Convert Your Data to a Table Before Adding Records
- •Create a Flattened Pivot Table for Reuse
- •Replace Blanks in a Pivot Table with Zeros
- •Collapse and Expand Pivot Fields
- •Specify a Number Format for a Pivot Table Field
- •Preserve Column Widths
- •Show Yes/No in a Pivot Table
- •Pivot Table Format Defaults
- •Format Pivot Tables with the Gallery
- •None of the 46,273 Built-In Styles Do What My Manager Asks For
- •Select Pivot Table Parts For Formatting
- •Apply Conditional Formatting to a Pivot Table
- •Can I Save Formatting in a Template?
- •Manually Re-sequence the Order of Data in a Pivot Table
- •Present a Pivot Table in High-to-Low Order by Revenue
- •Excel 2016 Sometimes Auto-Groups Daily Dates to Month
- •Group Daily Dates by Month in a Pivot Table
- •Create a Year-Over-Year Report
- •Group by Week in a Pivot Table
- •Limit a Pivot Report to Show Just the Top 5 Customers
- •Build a Better Top Five Using Groups
- •Build a Better Top Five with A Filter Hack
- •Build a Better Top 5 Using the Data Model
- •Limit a Report to Just One Region
- •Create an Ad-Hoc Reporting Tool
- •Create a Report for Every Customer
- •Create Pivot Charts
- •Add Visual Filters to a Pivot Table or Regular Table
- •Run Many Pivot Tables From one Slicer
- •Filter Dates Using a Timeline in Excel 2013 & Newer
- •Group Employees Into Age Bands
- •Create a Frequency Distribution
- •Grouping 1 Pivot Table Groups Them All
- •Reduce Size 50% Before Sending
- •Drag Fields to the Pivot Table
- •Create a Report That Shows Count, Min, Max, Average, Etc.
- •Better Calculations with Show Values As
- •Pivot Ranks Don’t Match RANK()
- •Calculated Fields in a Pivot Table
- •Add a Calculated Item to Group Items in a Pivot Table
- •Group Text Fields to Build Territories
- •Calculations Outside of Pivot Tables
- •Show Customer Account & Name
- •Show Months with Zero Sales
- •Create a Unique List of Customers with a Pivot Table
- •Use a Pivot Table to Compare Two Lists
- •Use a Pivot Table When There Is No Numeric Data
- •Fix Misspelled Customer Names
- •Create a Pivot Table from Access Data
- •What Happened to Multiple Consolidation Ranges in Pivot Tables?
- •What are the Products in Power BI And How Can I Get Them?
- •Know if You Have 32-Bit or 64-Bit Excel
- •Load and Clean Data with Power Query
- •Power Query is Easier to Learn than VBA Macros
- •I Have More than 1,048,576 Rows of Data
- •Load a List of File Names into Excel
- •Load a Folder of CSV Files into a Single Excel Worksheet
- •My Headings Repeat Every 60 Rows
- •Fill in Blanks with Values from Above
- •Use Power Query to Clean Data Already in Excel
- •Pivot from Multiple Tables in Excel 2013 Data Model
- •Reporting from the Smaller Side of the Relationship
- •Use Joiner Tables Between Tables
- •Five Reasons to Use Power Pivot
- •Why Isn’t Power Pivot Tab in the Ribbon?
- •Get Excel Data Into Power Pivot
- •Open the Power Pivot Window
- •Define Relationships Between Tables
- •Sort Month Name by Month Number
- •Create a Calendar Table
- •The Formulas are called DAX
- •Adding Calculations In the Power Pivot Grid
- •Refer to a Related Table in a Formula
- •Creating the Power Pivot Table
- •Building the Pivot Table
- •Feature X Won’t Work in Power Pivot
- •Replace Calculated Fields with DAX
- •Calculate() is Like SUMIFS()
- •Unapply a Filter Using DAX
- •Unfilter Using Time Intelligence
- •Convert Power Pivot to Formulas
- •January Actuals and February Plan
- •Power View Is Replaced with Power BI
- •Power BI Transforms Excel Data into Interactive Dashboards
- •First POwer BI Step: Get a Free Account for Power BI
- •Optional Step 1: Take the Sample Dashboards for a Spin
- •Use Q&A to Investigate Your Data
- •Click a Dashboard Element to Open the Underlying Report
- •Click in one Chart to Filter Other Charts
- •Enable Drill-Down Mode
- •Sorting is Hidden Behind More Options
- •Optional Step 2: Connect to an Existing Service
- •Download Power BI Desktop to Your Computer
- •Prepare Your Excel Data for Power BI
- •Add a Calendar Table
- •Three Icons in Power BI Desktop
- •In Power BI Desktop, the Power Query Tools Are Called Get Data
- •Load Your Excel Data to Power BI Desktop
- •In Power BI Desktop, the Power Pivot tools are called Modeling
- •Define Relationships in Power BI Desktop
- •Classify Your Geography Fields in Power BI Desktop
- •Prevent Power BI from Adding Up Year Fields
- •Sort This by That
- •Define Synonyms in Power BI Desktop
- •Hide Columns So They Can't Be Chosen
- •Three Ways to BUild Visualizations in a Report
- •FOrmatting a Chart
- •Add Lines using Analytics
- •Adding More Visualizations to a Page
- •It is Insanely Easy to Build a Hierarchy
- •Open Source Visualizations
- •Every Chart is a Slicer For Other Charts
- •A Report Can Have Multiple Pages
- •Using Maps in Power BI Desktop
- •Three Types of Filters
- •Where is the Top 10 Filter?
- •Add Titles, Logos, & Embelishments
- •Don't Forget to Save Your File!
- •Share Your Dashboard to Power BI in the Cloud
- •Use Quick Insights
- •View Your Report in a Browser
- •Q&A Works on Dashboards, Not Reports
- •Share a Dashboard With Your Manager
- •Wait a Second - a Sharing Link? Isn't this Dangerous?
- •Consume Your Dashboard Using Power BI Mobile
- •What Does All Of This Cost?
- •How Do I Update My Dashboard Every Day?
- •That's All For Power BI In This Book
- •Put a Pivot Table on a Map In Excel 2013 Power Map
- •Tricks for Navigating the Map in Power Map
- •Fine-Tuning Power Map
- •Creating a Video from Power Map
- •Use an Alternate Map for Power Map
- •Filtering in Power Map
- •Excel Data to Mailing Labels in Word
- •Excel 2013 Allows Slicers on Regular Tables
- •Use Power Query to Load Many Web Pages
- •Create a Chart with One Click
- •Teach Excel Your Favorite Chart
- •Move a Chart
- •Copy a Chart Detached from the Data
- •Add New Data to a Chart
- •Excel 2013 Offers Easy Chart Formatting
- •Begin Excel 2010 Formatting on Design
- •The Chart Layout Tab Is Missing in Excel 2013
- •Formatting Charts in Excel 2010 with Layout
- •Legend At the Top
- •The 2010 Format Dialog Box is a Task Pane in 2013
- •Display an Axis in Millions
- •Select Anything on a Chart to Format
- •The Format Dialog Box Offers a New Trick
- •Use Meaningful Chart Titles
- •Avoid 3-D Chart Types
- •Prevent the Drop to Zero
- •Explode One Slice of the Pie
- •Move Small Pie Slices To Second Chart
- •Add a Trendline to a Chart
- •See Detail on Large & Small Data Points
- •Chart Two Series with Differing Orders of Magnitude
- •Hide Subtotals From Chart in Excel 2013
- •Create Pivot Charts from Detail Data in Excel 2013
- •Use Formulas for Chart Labels in Excel 2013
- •Interactive Chart to Show One Customer
- •Tie the Chart Title to a Cell
- •Excel 2016 Adds a Waterfall Chart
- •Use an Invisible Series to Float Columns
- •Use Rogue Series for Shading
- •Two Stacked, One Clustered Column
- •Conditional Format a Chart
- •Scatter Charts are Versatile But Require a Different Workflow
- •When do I Use Which Chart Type?
- •Track Sales Leads with a Funnel Chart
- •Create Tiny Charts with Sparklines
- •Sparklines Are Not Scaled Together
- •What is the Win Loss Sparkline For?
- •Labeling Sparklines
- •Shade the Normal Range in a Sparkline
- •Convert a Table of Numbers to a Visualization
- •Control Values for Each Icon
- •Add Icons to Only the Good Cells
- •Use the SIGN Function for Up/Flat/Down Icon Set
- •Data Bars Options
- •Comparative Histogram
- •Select Every Kid in Lake Wobegon
- •There is a Font Optimized for Excel
- •Show Checkmarks in Excel
- •Add Bullets to Excel
- •Use the Border Tab in Format Cells
- •Remove Borders from Filled Cells
- •Double Underline a Grand Total
- •Why Did the Colors Change in Excel 2013?
- •Where Are My Excel 2003 Colors?
- •Transform Black-and-White Spreadsheets to Color by Using a Table
- •Fit a Slightly Too-Large Value in a Cell
- •Turn Off Wrap Text in Pasted Data
- •Delete All Pictures in Pasted Data
- •Prevent Long Text from Spilling
- •Show Two Values in a Split Cell
- •For Each Cell in Column A, Have Three Rows in Column B
- •Show Results as Fractions
- •Better Scientific Notation
- •Fill a Cell with Asterisks
- •I type 152 and get 1.52
- •Use Cell Styles to Change Formats
- •Move Columns by Sorting Left to Right
- •Move Columns Using Insert Cut Cells
- •Move Rows or Columns with Shift Drag
- •Select All Cells Using the Keyboard
- •Change the Width of All Columns with One Command
- •Copy Column Widths to a New Range
- •Copy Row Heights
- •Use White Text to Hide Data
- •Hide Values Using a Number Format
- •Hide and Unhide Data
- •Group Columns Instead of Hiding Them
- •Hide Error Cells When Printing
- •Unhide All Sheets
- •Very Hide a Worksheet
- •Organize Your Worksheet Tabs with Color
- •Copy Formatting to a New Range
- •Copy Without Changing Borders
- •Power Up Format Painter
- •Fill Formatting
- •Change All Red Font Cells to Blue Font
- •Replace Partially Bold Cells
- •Change the Look of Your Workbook with Document Themes
- •Create Your Own Theme
- •Bring Back the Office 2010 Colors And Shiny Objects
- •Change the Background of a Worksheet
- •Add a Printable Background to a Worksheet
- •Remove Hyperlinks Automatically Inserted by Excel
- •Select a Hyperlink Cell Without Following the Hyperlink
- •Pasted URLs Don’t Become Hyperlinks
- •Debug Using a Printed Spreadsheet
- •Change the Appearance of Cell Comments
- •Control How Your Name Appears in Comments
- •Force Some Comments to ALWAYS Be Visible to Provide a Help System
- •Change the Comment Shape to a Star
- •Add a Pop-up Picture of an Item in a Cell
- •Add a Pop-up Picture to Multiple Cells
- •Build Reports Where Columns in Each Section 1 Don’t Line Up
- •Paste a Live Picture of a Cell
- •Add Formatting to Pictures in Excel
- •Remove Picture Background
- •Inserting a Screen Clipping
- •Draw an Arrow to Visually Illustrate That Two Cells Are Connected
- •Add Connectors to Join Shapes
- •Circle a Cell on Your Worksheet
- •Draw Perfect Circles
- •Add Text to Any Closed Shape
- •Place Cell Contents in a Shape
- •Rotate a Shape
- •Create Dozens of Lightning Bolts
- •Make a Logo into a Shape
- •Draw Business Diagrams with Excel
- •Choose the Right Type of SmartArt
- •Use the Text Pane to Build SmartArt
- •Change a SmartArt Layout
- •Format SmartArt
- •Switch to the Format Tab to Format Individual Shapes
- •Use Cell Values as the Source for SmartArt Content
- •Add WordArt to a Worksheet
- •Chart and SmartArt Text Is Automatically WordArt
- •Excel 2013 Offers an Excel App Store
- •Add a Dropdown to a Cell
- •Configure Validation to “Ease up”
- •Use Validation to Prevent Duplicate Data Entry
- •Use Validation to Create Dependent Lists
- •Add a ToolTip to a Cell to Guide the Person Using the Workbook
- •Combine Validation with AutoComplete
- •Afterword
- •Index
ABOUT THE AUTHOR |
xv |
|
|
ABOUT THE AUTHOR
In 1989, Bill Jelen took a job in a finance department to maintain a very expensive reporting tool.
When he discovered on day one that this new tool did not work, he began to learn how to use a $299 spreadsheet program in ways no sane person would ever think to use it. To the manager who hired him, he now wants to admit that all the reports that allegedly came out of the $50K 4th GL reporting tool
from 1989 through 1994 really were actually produced with Lotus 1-2-3 and, later, Excel.
Thinking he was the smartest spreadsheet guy he knew, Jelen launched MrExcel.com in 1998 and quickly learned that while he knew everything about taking 50,000 rows of mainframe data and turning them into a summary report, there were many people using Excel in many different ways. To all of the people who mailed in questions back in 1998 and 1999, Jelen thanks them for honing his spreadsheet skills. He now admits that he initially knew the answers to none of their questions, but secretly researched the answer before replying to their e-mails.
Today, MrExcel Consulting provides custom VBA solutions to hundreds of clients around the English speaking world. The MrExcel.com Web site continues to provide answers to 30,000 questions a year. In fact, with over 900,000 answers archived, it is likely that the answer to nearly any Excel question has already been posted on the Web site’s message board.
Jelen is a regular IMA/IIA speaker circuit. He holds a regular Excel Q&A via his daily Learn Excel from MrExcel podcast. He writes the monthly Excel column for Strategic Finance magazine. There are so many features in Excel, that Jelen has never taught a seminar without learning something new from someone in the audience who reveals some new technique or shortcut. Mostly, though, Jelen learns what Excel annoyances are driving people crazy. The questions in this book are the types of questions Jelen hears over and over.
Jelen is the author of 50 books on Excel. He has produced over 2,000 episodes of the Learn Excel from MrExcel video podcast. He was a regular guest on Call for Help and That Lab with Leo Laporte on TechTV. He is a 10-year Microsoft MVP in Excel. When he isn’t writing, you will find him on a kayaking from his back yard in Merritt Island, Florida.
Jelen lives in Merritt Island, Florida with his wife Mary Ellen and two dogs.
DEDICATION
Dedicated to everyone in one of my Power Excel seminars.
ACKNOWLEDGMENTS
This book and its predecessor have been honed by hundreds of people. Through e-mail, podcasts, and seminars, people have added comments, suggestions, and new tips to make the book better.
Shannon Mattiza at 6’4 Media provided a great cover.
New ideas for this book came from: Vincent Adin, James Afflitto, Paul Allen, Andres Alvear, Patrick Amos, Loren Anderson, Rod Apbelbeck, Neil Appleton, Ilia Asafiev, Ed Ascoli, Chris Ayotte, Doug Bailey, David
Baker, Brad Barker, Cliff Barnett, Denis Barry, Wolfgang Bartel, Marc Barth, Khader Basha, Tim Bene,
Bill Bentley, Joel Berg, Paul van den Berg, A. Besis, Apostolos H. Besis, Matthew Bigelow, Ron Binder, Ram Bista, Ron Black, Jan Boord, Graham Booth, Marilou Borries, Sarah Bourne, Lindsay Boyce, David
Braddy, Eddie Bradley, Alan Brady, Tom Bricheri-Colombi, Tom Brichieri-Colombi, Craig Brody, Thor
Bronsvig, Lisa Brooks, Alan Brown, Derek Brown, James Brown, Patrick Bruer, Michael Bryson, Shawn
Bumgarner, Daniel Burke, Andres Cabello, Travis Carney, Jason Carroll, Price Chadwick, Phil Chamberlain, Mark Chambers, Elden Chandler, Natalie Chapman, Jim Cheap, Ronnie Chio, Jack Chopper, Gopal
Chouhan, Richard Clapp, Mike Clark, Todd Cleveland, Nancy Cody, Morne Combrinck, Steve Comer,
Dave Connors, Adrien Cooper, Melania Covey, Jordan Crawford, Laura Criste, and David Cuenta.
Also from Dion Daniel, Mark A. Davis, Patrick Delange, Rod Dempsey, Daniel Dion, Tim Dolan, Rob
Donaldson, Shannon Duffy, Dawn Duhon, Roy A. Dunn, Diane Durham, Richard E Todd, Adrian Early,
Jack Elgin, Micah Emmerson, Bryan Enos, Pablo Esperon, Roger Evangelista, Nora Fazio, Michael Fleet,
xvi |
POWER EXCEL WITH MR EXCEL |
|
|
Mike Fliss, Michael Fockler, Linda Foster, Michael Franchino, Florian Frankl, Bill Fuhrmann, Robert Gabriel, Terry Gamble, Kerry Gao, Mario Garcia, Margarita George, Marc Gershberg, Eric Gibson, Dietmar
Gieringer, Mike Gel Girvin, Devin Goldberg, Alex Gordon, Cheri Grady, Mark Grint, Ausdell Hadaway, Markus Hahner, Jeff Hale, Odd Inge Halvorsen, Riham Hammoda, Lorin Hanson, Sue Hartman, Peter Harvest, G. Russell Hauf, Karen Havens, Dermot Hayes, Don Heckerman, Bill Hemlick, Graeme Hemp- hrey, Rich Herbert, Med venlig Hilsen, Rob Hincks, Andrew Hinton, Steve Hocking, Andy Hoffmann, Mike Howlett, John Hulls, Paul Humphris, Chuck Irby, Bill Jackman, Jerry Jacobson, Neil Jimack, Kasper de Jonge, Rick Johnson, Stefan Johnsson, Al Johnston, Andrew Jones, Jackilyn Jones, Terry Jones in Spring- field, Szilvia Juhasz in Southern California, Howard Kaplan, Brad Kennedy, Kambiz Keshvari, Kathe
Killian, Paul Kimmel, and Jerry Kohl of Brighton.
More ideas from David Komisar, Ari Kornhauser, Howard Krams, Tanja Kuhn, Ann LaSasso, Jeffrey Latsko, Stacey Lawrence, Rob Leblanc, Johann Manjarrez Ledesma, Paul Leonard, Mark Leskowitz, Lau- ra Lewis, Rene Lie, Bei Lin, Crystal Long, Sérgio Nuno Pedro Lopes, Rick Lubinski, Stuart Luxmore, Patrick C Lynch, Carl MacKinder, Sarker Ashek Mahmud, Roseanne Maish, Romas Malevicius, Micahel Maramzin, Dan Marks, Al Marsella, Joe Marten, Giles Martin, Real Mayer, Dan Mayoh, Sally McBride,
Wendy McCann, Bethany McCrea, Bill McDiarmid, Thomas McGough, James McKay, Wyatt McNabb,
Sergio Melendez, Isabel Mendoza, David Merkel, Dakshesh Mewada, John Meyer, L. Michael, Henning Mikkelsen, Dan Miller, Mark Miller, Richard Miller, Susan Miller-Wells, Greg Montgomery, Mikal Moore, Terry Moorehouse, Ali Mozaffari, Isabel Mrndoza, Kyle Munson, Lucy Myers, Shawn Nelson, Matthew Netzley, Susan Nicholls, John Nichols, Susan Nichols, Dara Nolan, Bill Northrup, Dolores Oddo, Richard
Oldcorn, Jeremy Oosthuizen, and Brent Oswald.
Also from Milind Padhye, Andre Pearson, Michael Pennington, Mario Perez, Dominik Petri, Matthew
Pfluger, E. Phillips, Pete Pierron, Stephen Pike, David Plante, Bill Polen, Dave Poling, Sergiy Polovy,
Nadar Ponnuturai, Brenton Prior, John Pyskaty, Blaine Raddon, Bob Ragland, Jerry Ransom, Fabien
Raynaud, Sandra Renker, Greg Richmond, Russell Richter, Gary Ritter, Bill Robertson, Jamie Rogers, Chris Rohde, Julie Rohmann, Margaret De La Rosa, Vlad De Rosa, Jim S. Rose, Dave Rosenberger, David Rosenthal, Chuck Ross, Hamilton Rozario, Fabian Ruales, Peter Rutter, Marty Ryerson, Tom Saladin , Abdul Salam, Dion Sanchez, Ricardo Santiago, Jack Santos, Lorna A. Saunders, Steve Scaysbrook, Julie Scheels, Lori Schleuter, Randal L. Schwartz, Diane Seals, Robert D Seals, Mark Secord, Ashokan Selliah, Denison Seminar, Bryony Seume, Ewan Shannon, Uma Sharma, Wayne Shelton, Ute Simon, Brett Simp- son, Manfred Simrodt, Loh Seok Siong, Don Smith, Chris Sours, Mark Spratt, Daan Sprunken, Harold Starr, Shlomo Stern, Clay Sullivan, Kevin Sullivan, Keith Sumrall, Seiichi Suzuki, Bill Swearer, Mike Syracuse at the Globetrotters, Brian Taylor, James Tays, David Teague, Martin Thelfer, Sarah Thomas,
Denise Thomson, Bob Tiller, Mark Tittley, Richard Todd, Michael Tucker, Mr. Andrew Tucker, Breck
Tuttle, Bob Umlas, Vaibhav Vaidya, Claude Van Horn, Geoff Vautier, Dinesh Vijaywargiay, Thomas Vo- gel, J. B. Voss, Wiebe van der Waals, Grant Wang, Tim Wang, Kim Wasmundt, Pam Waymack, Rebecca
Weing, Susan Wells, John Wendell, Douglas A. Wesney, Justin White, Neville White, Gary Whiteford, Scott Whyte, Mack Wilk, Shaun Wilkinson, Bill Wood, Chris Wright, Yvonne at the AEAP meeting, Dick Yalmokas, Pat Yong, Kathy Zdarstek, and Deb Zurawski. Many others made a suggestion during a semi- nar, but all I can remember is something like “Derek in Row 6 in Springfield”, “Dan in Philly”, “that nice lady on the right side in Kent, Ohio”, and others. If you own an Excel Master pin and I didn’t list your name, please e-mail me so I can correct the omission.
At Microsoft, the Excel, Power Pivot, Power Map, Power Query, Power BI and Excel Web App teams keeps adding new features to Excel. At the IMA, Kathy Williams and Christopher Dowsett keep my Strategic
Finance articles in shape
My sister Barb Jelen likely packed and shipped the book if you ordered it directly from MrExcel.com.
My family were incredibly accommodating. Thanks to Mary Ellen, Josh & Zeke.
FOREWORD |
|
xvii |
|
|
|
|
FOREWORD |
Iam a comic book superhero.
At least, I play one at work. As the mighty man of macro, I have the coolest job in town: playing MrExcel, the smartest guy in the world of spreadsheets.
Well, yes, that is a lot of hype. I am not really MrExcel. In fact, there are so many different ways to do the same thing in Excel that I am frequently shown up by one of my own students. Of course, I then appropriate that tip and use it as my own!
I have incorporated some of these discoveries in a pretty cool 3.5-hour seminar titled Power Excel Tips.
This is amazing stuff—like pivot tables, filters, and automatic subtotals. I love to be in front of a room full of accountants who use Excel 40+ hours a week and get oohs and ahhhs within the first few minutes.
I have to tell you, if you can make a room full of CPAs ooh and ahh, you know that you’ve got some good karma going. At that point, I know it will be a laugh-filled session and a great morning.
One of these classes, which I was presenting at the Greater Akron Chamber, provided the Genesis moment for this book. One of the questions from the audience was about something fairly basic. As I went through the explanation, the room was silent as everyone sat in rapt attention. People were interested in this basic tip because it was something that affected their lives every day. It didn’t involve anything cool. It was just basic Excel stuff. But it was basic Excel stuff that a room full of pretty bright people had never figured out.
Think about how most of us learned Excel. We started a new job where they wanted us to use Excel. They showed us the basics of moving around a spreadsheet and sent us on our way. We were lucky to get 5 minutes of training on the world’s most complex piece of software!
Here is the surprising part of this deal. With only 5 minutes of training, you can use Excel 40 hours a week and be productive. Isn’t that cool? A tiny bit of training, and you can do 80% of what you need to do in Excel.
The problem, though, is that there are lots of cool things you never learned about. Microsoft and Lotus were locked in a bitter battle for market share in the mid-1990s. In an effort to slay one another, each succeeding version of Excel or Lotus 1-2-3 offered incredibly powerful new features. This stuff is still lurking in there, but you would never know to even look for it. My experience tells me that the average Exceller is still doing things the slow way. If you learn a just couple of these new tips, you could save 2 hours per week.
This book talks about 617 of the most common and irritating problems in Excel. You will find each of these 617 items (which you have been stumbling over ever since your “5 minutes of training”) followed by the solution or solutions you need to solve that problem. A lot of these topics stem from questions sent my way in seminars I’ve taught. They may not be the coolest tips in the whole world, but if you master even half of these concepts, you will be smarter than 95% of the other Excellers in the world and will certainly save yourself several hours per week.
Most of the 617 topics in this book presents a problem and its solution. There are plenty of books that go through all of Excel’s menus in a serial fashion. (I’ve written a few). The trouble with those books is that you have no clue what to look up when you are having a problem. No one at my dinner table has ever used the word concatenation, so why would anyone ever think of looking up that word when they want to join a first name in column A with the last name in column B? (see"Join Two Text Columns" on page 86)
Despite its size, this book is a quick read. You can probably skim all 617 topics in a couple of hours to get a basic idea of what is in here. When you face a similar situation, you can find the appropriate topic, apply it to your own problem, and you should be all set.
This book takes a different approach than others I have tried to use. I am MrExcel, but I am hopelessly clueless with Photoshop. Wow! This is an intimidating program. I own a ton of books on Photoshop. There must be a bazillion toolbars in there. Most books I pick up tell me to press the XYZ button on the ABC toolbar. I can’t even begin to figure out where that toolbar is. I hate those books. So, my philosophy here is to explain the heck out of things. If you find a topic in this book in which I tell you to do something without explaining how to do it, please send me an e-mail to yell at me for not being clear.
xviii |
POWER EXCEL WITH MR EXCEL |
|
|
How to Use This Book
Each topic starts with a problem and then provides a strategy for solving the problem. Some topics may offer additional details, alternate strategies, results, gotchas, and other elements, as appropriate to the topic. Each chapter wraps up with a summary and a list of any Excel commands or functions used in the chapter. The screenshots are a mix of 2010, 2013, and 2016, depending on the age of the tip.
Starting with Excel 2007, Microsoft has organized the ribbon into a series of tabs: the Home tab, the Insert tab, the Page Layout tab, and so on. Within each tab, Microsoft has organized icons into various groups.
On the Home tab, for example, there are groups for Clipboard, Font, Alignment, Number, Styles, Cells, and Editing. In this book, if I want you to choose the Delete icon from the Cells group on the Home tab of the ribbon, I say, “Choose Home, Delete.” The other option is to say “Choose Home, Cells, Delete,” but you never actually choose Cells; it is merely a label, so I generally do not mention the group when I write about a command.
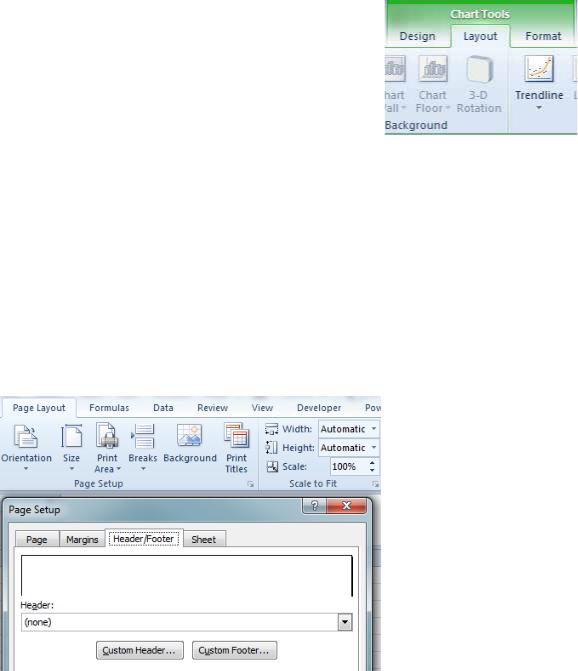
Gotcha: When you are working on a chart, Excel adds three new tabs under the Chart Tools heading, as shown in Figure
1. (These tabs do not appear when you are not working with charts.) You might see Excel Help referring to the “Chart Tools | Design tab”. I won’t don’t do this. There can only be only one Design, Layout, or Format tab available at any given time. If the topic is talking about charts, I am going to assume that you are actually working on a chart, and I will refer to the Layout tab instead of the Chart Tools | Layout tab.
Figure 1 This book refers to the Design, Layout, and Format tabs.
Gotcha: Some of the icons on the ribbon tabs have two parts: the main icon and a dropdown. You can see the dividing line between the two parts only when you hover the mouse over the icon. When you need to click the icon itself, this book uses the name of the icon. For example, when you need to select the Paste icon from the Home tab, the text says to choose Home, Paste. When you need to select something from a dropdown under an icon, the text specifies dropdown; for example, when you need to select Paste Values from the Paste dropdown, this book tells you to choose Home, Paste dropdown, Paste Values.
In addition to the tabs across the ribbon, many dialog boxes contain a number of tabs. For example, if you click the Print Titles icon on the Page Layout tab, Excel displays the Page Setup dialog, which has four tabs as shown in Figure 2. If I want you to choose the Header/Footer tab of the dialog, I might write, “Select Page Layout, Print Titles, Header/Footer, Custom Header.” Or, I might say, “From the Page Layout tab of the ribbon, select Print Titles. In the Page Setup dialog, choose the Header/Footer tab and then click Custom Header.”
Figure 2 Select Page Layout, Print Titles, Header/Footer, Custom Header.
ACKNOWLEDGMENTS |
xix |
|
|
Gotcha: In newer dialog boxes, Excel has abandoned tabs across the top and used a left navigation instead. This is particularly true in the Formatting dialog, in the Excel Options dialog, and in the Trust Center dialog. For such dialogs, I sometimes write to “choose Fill from the left navigation of the Format Data Series dialog,” but I also sometimes write “Choose Layout, Format Selection, Fill, No Fill.” In this case, Layout is the ribbon tab, Format Selection is the icon, Fill is the name of the cat- egory along the left navigation panel, and No Fill is the option to choose.
This book uses the term press to refer to keyboard keys (for example, “press Enter,” “press F2”). It uses the term click to refer to buttons and other items you click onscreen (for example, “click OK,” “click the Paste icon”). It uses the term select or choose to refer to selections from the ribbon and option buttons and check boxes within dialogs (for example, “select the Home tab,” “select the No Fill option”).
Figure 3 In this dialog, the tabs move from the top to the left.
Additional Resources
The files used in the production of this book are available for download at www.mrexcel.com/powerex- celfiles17.html. Most topics in the book are covered on the free MrExcel podcast. Visit www.mrexcel.com for details on how to get the podcasts for free.
Quick Start - If You are New to Excel
If you consider yourself new to Excel and don’t know where to start, here are some great topics for you. ●● Keep favorites in the Recent Documents List - page 18
●● Get finished worksheets from Office.com - page 22 ●● See Headings as You Scroll - page 28
●● Zoom with the mouse - page 33
●● Mix formatting within a cell - page 40
●● Use the Fill Handle to enter months - page 40 ●● Fit a report to one page wide - page 52
●● Add a watermark - page 53
●● Excel can read to you - page 60 ●● Entering Formulas - page 71
●● Why dollar signs in formulas - page 76 ●● Total without formulas - page 84
●● Join Two Text Columns - page 86 ●● Clean data with Flash Fill - page 89 ●● Discover new functions - page 108 ●● Excel as a calculator - page 111
●● Loan payments - page 124
●● Calculate a Percentage of Total - page 136 ●● Making decisions with IF - page 148
●● Match records with VLOOKUP - page 159 ●● Dice in Excel - page 185
●● How to avoid blank columns - page 234
●● Add hundreds of subtotals at once - page 249
●● Summarize a data set in 6 clicks - page 294
●● Help your manager visualize numbers - page 466 ●● Show Checkmarks in Excel - page 473
xx |
|
POWER EXCEL WITH MR EXCEL |
|
|
|
●● |
Tame your hyperlinks - page 505 |
|
●● Circle a cell - page 520 |
||
●● |
Plot your Excel data on a map - page 412 |
|
●● |
Use Document Themes - page 501 |
|
●● |
Draw Business Diagrams - page 527 |
|
●● |
Add a dropdown to a cell - page 537 |
Quick Start - For Power Excellers
If you think you know Excel really well, I bet you will find some gems in these topics: ●● Open Excel with Ctrl+Alt+X - page 23
●● Never change your margins again - page 25
●● Ctrl+Backspace brings current cell in to view - page 32 ●● Amazing way to paste values - page 34
●● Quickly rearrange columns - page 36 ●● Fill 1 to 100000 - page 42
●● F4 Repeats last command - page 63 ●● See all named ranges - page 83
●● Concatenate several cells - page 88
●● Formula to put worksheet name in a cell - page 98 ●● Intersection for 2-way lookup - page 115
●● Back into an answer - page 125
●● Replace IF with Boolean logic - page 149
●● Find the second largest value - page 186 ●● The real benefit of tables - page 198
●● Trace formulas - page 199
●● See key cells from many worksheets in one place - page 201 ●● Analyze every date between 2 cells - page 218
●● Track negative time - page 223 ●● Filter by selection - page 243
●● Total just the filtered rows - page 245 ●● Copy just the subtotals - page 253
●● Sort the subtotals - page 254 ●● Remove duplicates - page 277
●● Show Yes/No in a pivot table - page 310 ●● AutoFilter a pivot table - page 329
●● Generate reports for every customer without a macro - page 333 ●● Pivot table template - page 317
●● Compare two lists faster - page 362
●● Clean data with Power Query - page 368
●● No more VLOOKUPs with Power Pivot - page 376
●● Asymmetric pivot tables for past actuals and future plan - page 384 ●● 100 million rows with Power Pivot - page 375
●● Add new data to a chart - page 426 ●● Easy combo charts - page 440
●● Hundreds of tiny charts in seconds - page 462 ●● Sorting Left to Right - page 488
●● Pop-up Picture - page 513
●● Paste a live picture of cells - page 514
●● Get SmartArt content from cells - page 534
Quick Start - What’s New
Here are a few amazing newer features in Excel: ●● Forecast Sheets in Excel - page 188
●● Pivot Table auto date rollups - page 322
●● Power Query - page 368 ●● Power BI - page 386
●● Waterfall & Funnel charts - page 446
P A R T 1
THE EXCEL
ENVIRONMENT
1