

Книги по МРТ КТ на английском языке / MR Imaging in White Matter Diseases of the Brain and Spinal Cord - K Sartor Massimo Filippi Nicola De Stefano Vincent Dou
.pdfQuantitative Diffusion Imaging |
|
|
|
|
|
73 |
||
Table 6.2. Diffusion parameters in some normal brain white matter regions |
|
|
||||||
|
|
|
|
|
|
|
|
|
|
Age |
ADCav |
FA |
Afiber=A |
Nominal voxel |
Reference |
||
|
|
|
|
|
|
|
volume (µl) |
|
|
|
|
|
= RA / √2 |
|
|||
|
|
|
|
|
|
|
|
|
|
27–36 years |
0.69e |
0.87e |
|
|
|
8.7 |
Pierpaoli et al. |
|
|
|
|
|
|
|
|
(1996) |
|
~25–40 |
0.75–0.88 |
0.78–0.81 |
0.55–0.63 |
18.1 |
Ulug and van Zijl |
||
|
|
|
|
|
|
|
|
(1999) |
|
23–47 years |
0.72e |
0.71e |
0.50 |
|
|
11–18 |
Shimony et al. (1999) |
cc |
23–76 years |
|
0.57–0.70f |
|
|
|
6.9 |
Pfefferbaum et al. |
|
|
|
|
|
|
|
|
(2000) |
|
Mean age 28±11 |
0.74–0.80§ |
0.65–0.71 |
|
|
|
17 |
Arfanakis et al. |
|
years |
|
|
|
|
|
|
(2002) |
|
Mean age 26±8 years |
|
0.70–0.72 |
|
|
|
4.4 |
Sun et al. (2003) |
|
19–34 years |
0.79–0.81 |
|
0.64–0.66 |
9.3 |
Westerhausen et al. |
||
|
|
|
|
|
|
|
|
(2003) |
|
|
|
|
|
|
|
|
|
|
Preterma; |
1.0–1.3 (plic) |
|
0.07–0.16 |
28 |
Huppi et al. (1998, |
||
|
full terma |
1.1 (plic) |
|
0.23 |
|
|
|
2001) |
|
Full termb |
1.0–1.2 |
|
0.13–0.21 |
11–28 |
Neil et al. (1998, |
||
|
|
|
|
|
|
|
|
2002) |
|
0 yearsc |
0.9–1.4 |
|
0.14–0.30 |
N/A |
Neil et al. (2002); |
||
|
2–10 yearsc |
0.6–0.8 |
|
0.47–0.55 |
|
Mukherjee et al. |
||
|
|
|
|
|
|
|
|
(2002) |
|
27–36 years |
0.64e |
0.76e |
|
|
|
8.7 |
Pierpaoli et al. |
|
|
|
|
|
|
|
|
(1996) |
ic |
~25–40 |
0.69–0.70 |
0.71–0.74 |
0.50–0.52 |
18 |
Ulug and van Zijl |
||
|
|
|
|
|
|
|
|
(1999) |
|
23–47 years |
0.70–0.72e |
0.59–0.65e |
0.39–0.45 |
10-18 |
Shimony et al. (1999) |
||
|
Mean age 28±11 |
0.65–0.67§ |
0.54–0.64 |
|
|
|
17 |
Arfanakis et al. |
|
years |
|
|
|
|
|
|
(2002) |
|
Mean age 26±8 years |
|
0.46–0.57 |
|
|
|
4.4 |
Sun et al. (2003) |
|
|
|
|
|
|
|
|
|
|
Preterma; |
1.5–2.0 |
|
0.04–0.13 |
28 |
Huppi et al. (1998, |
||
|
full terma |
1.2 |
|
0.17 |
|
|
|
2001) |
|
Pretermd; |
1.4–1.9 |
|
0.07–0.12 |
11–28 |
Neil et al. (1998) |
||
|
full termb |
1.0–1.5 |
|
|
|
|
|
|
|
7–30 years |
0.84 |
0.46 |
|
|
|
18 |
Eichler et al. (2002) |
|
27–36 years |
0.65–0.72e |
0.46–0.87e |
|
|
|
8.7 |
Pierpaoli et al. |
|
|
|
|
|
|
|
|
(1996) |
wm |
~25–40 |
0.75 |
0.70 |
0.48 |
|
|
18 |
Ulug and van Zijl |
|
|
|
|
|
|
|
|
(1999) |
|
23–47 years |
0.78–0.80e |
0.33–0.42e |
0.21–0.26 |
10–18 |
Shimony et al. (1999) |
||
|
23–37 years |
0.81 |
0.24 |
|
|
|
31 |
O’Sullivan et al. |
|
56–85 years |
0.91 |
0.22 |
|
|
|
|
(2001) |
|
23–76 years |
|
0.35–0.44e |
|
|
|
6.9 |
Pfefferbaum et al. |
|
|
|
|
|
|
|
|
(2000) |
|
35±7 years |
|
0.42–0.45 |
|
|
|
63 |
Steel et al. (2001) |
|
Mean age 26±8 years |
|
0.42–0.64 |
|
|
|
4.4 |
Sun et al. (2003) |
|
|
|
|
|
|
|
|
|
cc, Corpus callosum; ic, internal capsule; plic, posterior limb; wm, white matter.
a Preterm <38 weeks; full term ≥38 weeks; taken from Figs. 3 and 4 and Table 6.2 in Huppi et al. (1998); Huppi et al.
|
(1998, 2001) gave RA as a percentage. We have recalculated this to Afiber by dividing by 100* √2 |
b Table 6.2, Neil et al. (1998). |
|
c |
From Fig. 6.1 in Neil et al. (2002). |
d Figs. 4 and 5, Neil et al. (1998). |
|
e |
Calculated from the eigenvalues given in the chapter. |
f |
Deduced from graph; these values are after spatial warping, a procedure that increases the measured FA by about 10%. |

74 |
|
|
|
|
|
|
|
P. C. M. van Zijl et al. |
Table 6.3. Diffusion parameters in some normal brain gray matter regions |
|
|
||||||
|
|
|
|
|
|
|
|
|
|
Age |
ADCav |
FA |
Afiber=A |
Nominal |
Reference |
||
|
|
|
|
|
|
|
voxel volume (µl) |
|
|
|
|
|
= RA / √2 |
|
|
||
|
|
|
|
|
|
|
|
|
|
Full terma |
1.16-1.18 |
|
0.06 |
|
|
11–28 |
Neil et al. (1998) |
GM |
27–36 years |
0.83b |
0.20b |
|
|
|
8.7 |
Pierpaoli et al. |
(cortex) |
|
|
|
|
|
|
|
(1996) |
|
~25-40 |
0.93 |
0.39 |
0.22 |
|
|
18 |
Ulug and van Zijl |
|
|
|
|
|
|
|
|
(1999) |
|
23–47 years |
0.93b |
0.09-0.15b |
0.05-0.09 |
|
10–18 |
Shimony et al. |
|
|
|
|
|
|
|
|
|
(1999) |
|
|
|
|
|
|
|
|
|
|
Full terma |
1.08 |
|
0.08 |
|
|
11–28 |
Neil et al. (1998) |
tha |
~25–40 |
0.73 |
0.43 |
0.25 |
|
|
18 |
Ulug and van Zijl |
|
|
|
|
|
|
|
|
(1999) |
|
23–47 years |
0.72b |
0.30b |
0.19 |
|
|
10–18 |
Shimony et al. |
|
|
|
|
|
|
|
|
(1999) |
|
|
|
|
|
|
|
|
|
|
Full terma |
1.24 |
|
0.07 |
|
|
11–28 |
Neil et al. (1998) |
hcn |
27–36 years |
0.67b |
0.17b |
|
|
|
8.7 |
Pierpaoli et al. |
|
|
|
|
|
|
|
|
(1996) |
|
~25–40 |
0.68 |
0.41 |
0.22 |
|
|
1.9×1.9×5 |
Ulug and van Zijl |
|
|
|
|
|
|
|
|
(1999) |
|
23–47 years |
0.80b |
0.17b |
0.10 |
|
|
10–18 |
Shimony et al. |
|
|
|
|
|
|
|
|
(1999) |
|
|
|
|
|
|
|
|
|
|
Full terma |
1.18 |
|
0.07 |
|
|
11–28 |
Neil et al. (1998) |
put |
~25-40 |
0.72 |
0.42 |
0.23 |
|
|
18 |
Ulug and van Zijl |
|
|
|
|
|
|
|
|
(1999) |
|
23-47 years |
0.73b |
0.14b |
0.08 |
|
|
10-18 |
Shimony et al. |
|
|
|
|
|
|
|
|
(1999) |
hf |
24-49 years |
0.28b |
0.01 |
|
|
|
8.7 |
Assaf et al. (2003) |
gm, Gray matter; tha, thalamus; hcn, head of caudate nucleus; put, putamen; hf, hippocampal formation. a Tables 6.1 and 6.2, Neil et al. (1998).
b Calculated from the eigenvalues given in the chapter.
volume effects, which may appear in more or less fashion depending on the voxel size, b-value, size of region of interest, and encoding and slice directions. An excellent overview of the effect of these factors on DTI calculations has been given by Alexander et al. (2001). At commonly used b-values, anisotropy values for large WM structures will be less affected by partial volume errors and thus more reliable and probably higher than those in smaller structures, where resolution limitations prohibit good definition of the structure in a DTI map. This could for instance explain why the FA values by Pierpaoli et al. (1996) and Ulug et al. (1999) are consistently higher than by other groups. On the other hand, the data by these two groups are older (acquired around 1995–1997) and may have had lower SNR, thereby increasing the anisotropy. For smaller structures than the corpus callosum, partial volume effects with crossing fibers, some gray matter, and/or CSF will reduce anisotropy.
To get an impression of the accuracy of the anisotropy values for a certain ROI, some authors evaluate the agreement in value between the anisotropies in the comprising voxels. A large variation would indicate involvement of many different structures, while a high coherence would support the anisotropy value for a single structure (Pfefferbaum et al. 2000). Thus, the present tables should only be used as a general guideline for trends, while better numbers at smaller voxel size (more homogeneous voxel composition per voxel) are to be expected in the near future due to the availability of much higher signal- to-noise ratio (SNR) through the advent of stronger gradients (already up to 8 G/cm for whole-body gradients) and higher magnetic field strengths (3 Tesla) in the clinic. Further improvement in accuracy will occur when individual structures in white matter are selected though fiber tracking, such as performed by Stieltjes et al. (2001) for the brainstem. However,
Quantitative Diffusion Imaging |
75 |
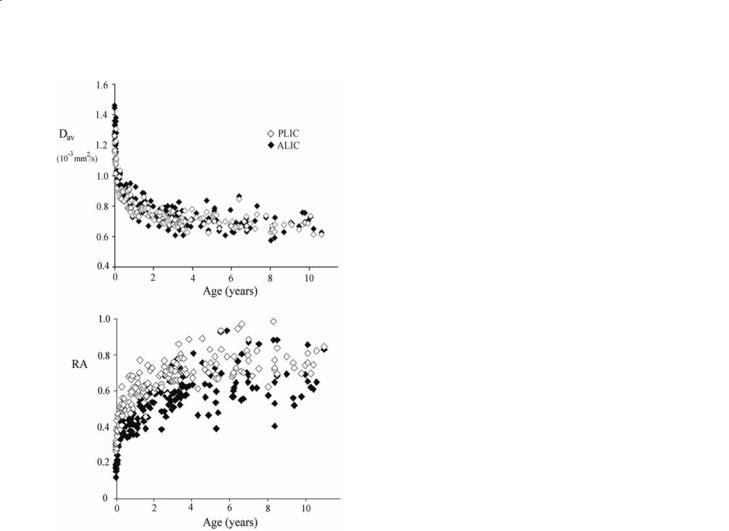
Fig. 6.5. Plots of ADCav and RA of the posterior (PLIC) and anterior lobes (ALIC) of internal capsule as a function of age for the first 10 years of life. The data start at 26 weeks of gestational age (very high ADCav and very low RA) (see also Table 6.2) and the values quickly normalize a few months after birth and are almost completely settled after two years. [Data reproduced with permission from Neil et al. (2002)]
even in that situation, the final anisotropy will depend on the thresholds chosen for tracking.
In pre-term and full-term newborn brain, ADCav values are considerably higher and anisotropy values considerably lower than in adults (Huppi et al. 1998, 2001; Neil et al. 1998, 2002). During development (preterm-full-term-adult), the ADCav of white matter (Table 6.2) decreases with age whereas anisotropy increases reflecting regional differences (Huppi et al. 1998; Neil et al. 1998, 2002). An example is shown for the internal capsule in Fig. 6.5 (Neil et al. 2002). The anisotropy increase in white matter has been described to happen in two distinct phases. The first, called “pre-myelinating state”, has thus far only been detected by DTI, as T1 and T2-weighted sequences are not sensitive to these changes. The second phase
of increase in RA corresponds with myelin production and maturation. The pre-myelination phase was attributed to changes in the cytoarchitecture of the axons.In this respect it is important to consider recent work by Beaulieu (2002) and Beaulieu and Allen (1994) showing that the magnitude of the diffusion anisotropy correspond to restrictions imposed by the axonal membrane and not by the smaller structures within the axon. The rate of anisotropy change differs between different white matter structures (Neil et al. 2002). This was for instance found for the internal capsule, where the posterior lobe (PLIC) myelinates before the anterior lobe (ALIC), leading to differences in anisotropy and average diffusion constants between these structures during early development. Another interesting insight into the physiology of the developing brain provided by DTI is the observation of transient high anisotropy in the cortical gray matter during the period from 26–32 weeks of gestation, similar to what is observed in the developing mouse brain (Mori et al. 2001). A good correlation with the period of intense neuronal migration, in which the cytoarchitecture of the cortex includes radial glial fi- bers and radially oriented dendrites of the pyramidal cells was noticed.
A decrease in FA and increase in ADCav are seen with normal aging (Pfefferbaum et al. 2000;
Moseley 2002; Nusbaum et al. 2001; O’Sullivan et al. 1999). Especially important in such aging studies is the analysis of preservation of the white matter volume. Atrophy may lead to an artificial reduction in anisotropy and increase in the average diffusion constant. To assess this, Pfefferbaum et al. (2000) measured so-called intervoxel coherence, which reflects the agreement between anisotropy values of the voxels included in the ROIs chosen for the different structures. Such coherence could be shown to be preserved along normal aging, indicating that the DTI changes are related to microstructural deterioration.
6.6.2
Di usion Imaging of Acute Ischemia
The possibility of early (Moseley et al. 1990a; Baird and Warach 1998; Warach et al. 1995; Lutsep et al. 1997; Sorenson et al. 1996; Ricci et al. 1999) and accurate (Gonzalez et al. 1999) detection of stroke, along with the distinction of potentially salvageable ischemic tissue (penumbra) (Baird and Warach 1998; Donnan and Davis 2002) has aroused intense research and patient management change in the area, leading to the concept that “time is brain”.

76 |
P. C. M. van Zijl et al. |
DWI shows conspicuous hypersignal intensity within minutes after the onset of ischemia (Moseley et al. 1990a; Minematsu et al. 1992; Davis et al. 1994; Provenzale and Sorensen 1999), believed to be caused by cytotoxic edema due to failure of Na+/K+ membrane pump, which occurs after disruption of oxidative energy metabolism. As explained earlier, the ADC maps have to be analyzed in conjunction with DWI, as the hypersignal on the latter can be due to residual T2 contrast, described as “T2 shinethrough” phenomena (Ulug et al. 1997; Provenzale and Sorensen 1999; Huisman 2003). A true re- stricted-diffusion image displays hypersignal on DWI and hyposignal on ADC maps. Employing these images, early detection of stroke is usually straightforward, despite the description of some pitfalls such as reversibility of DWI changes as well as variation on the signal behavior of DWI and ADC along the time course of stroke (Provenzale and Sorensen 1999; Schlaug et al. 1997). The mismatch between perfusion weighted image (PWI) and DWI indicates the presence of a penumbra of reduced flow around the ischemic core identified by the diffusion deficit (Sorenson et al. 1996; Schlaug et al. 1999). Such a region contains potentially salvageable tissue, allowing prompt intervention with thrombolytic therapy if diagnosed within the first few hours of onset.The role of DTI in the acute stroke scenario has gained importance through the realization that the acquisition of a diffusion constant in a single direction may lead to erroneous and confusing interpretation of stroke pathology and lesion evolution. This issue came about in the human literature when confusion arose about the length of the diffusion-constant normalization period after ischemia (Sorenson et al. 1996; Welch et al. 1995; Warach et al. 1996a,b), a problem that was due to choice of different directions of the dif- fusion-weighting gradients by different groups. This confusion could be addressed by using the trace of the tensor (Warach et al. 1997), as first suggested in animal studies (van Gelderen et al. 1994; Mori and van Zijl 1995; Ulug et al. 1997).
One point that is a topic of much discussion is whether the magnitude of the diffusion drop is an indicator of the salvageability of the tissue in the penumbra. Based on animal studies, we do not believe that this is the case. For instance, cat studies at high time resolution (Decanniere et al. 1995; Davis et al. 1994) show that the average diffusion constant drops about 30% during cardiac arrest. A small initial drop of a few percent was noticed in the diffusion constant upon occlusion in an ischemia model (Davis et al. 1994), but this was followed by an almost instanta-
neous steep large drop after 2 min, presumably upon depolarization. No correlation between the severity of penumbral involvement and the absolute value of the diffusion constant has been found in humans,and it is probably the case that variation in ADCav values reflects partial voluming between fully depolarized and polarized cells with normal ADCs.
The role of anisotropy measurements is not defined yet, although some evidence points to DTI as a more refined prognostic tool potentially yielding better clinical correlation (Sotak 2002; Sorensen et al. 1999; Yang et al. 1999; Gillard et al. 2001; Kunimatsu et al. 2003). Similar to ADCav values, anisotropy values also appear to vary depending on the time course of stroke (Yang et al. 1999) with some patients presenting with increased values in the acute and subacute phase (relative to contralateral), others with increased values acutely and reduced values subacutely, and a third group with reduced values both acutely and subacutely. All patients had reduced anisotropy in the chronic phase. Increased values in the acute phase have been explained on the basis of reduction of the extracellular space after intracellular accumulation of water with increased tortuosity of membranes leading to greater restriction of water, whereas, decreased values may reflect extracellular edema and cell lysis. Anisotropy values within 12 h of stroke correlated well with clinical and outcome scales. Evaluation with the full-tensor approach theoretically improves lesion detection and gives better discrimination on white and gray matter lesions (Sorensen et al. 1999; Mukherjee et al. 2000).Assessment of chronic infarcts and correlation with prognosis and follow-up is another potential field for DTI (Kunimatsu et al. 2003; Pierpaoli et al. 2001). DWI (Liu et al. 1999) and DTI (Arfanakis et al. 2002) have also been employed as a very sensible method for early detection and evaluation of diffuse axonal injury, such as experienced after trauma. The use of DTI for identification of salvageable tissue and subsequent intervention in cases of trauma has also approached (Jones et al. 2000). Recently, a fast clini- cian-friendly approach (C-FAST) to score six bilateral white matter regions (in the centrum semiovale, genu and splenium of the corpus callosum, anterior and posterior limbs of the internal capsules) on anisotropy maps was proposed as a prognostic tool (Ptak et al. 2003).
DWI and DTI have also been shown to detect hypoxic-ischemic lesions early in the neonatal period (Huppi et al. 2001; Inder et al. 1999), although a pseudonormalization of diffusion parameters at about 1 week after injury has to be taken into ac-

Quantitative Diffusion Imaging |
77 |
count (McKinstry et al. 2002). DTI acquired on the first day may therefore lead to misleading results. In the chronic phase, DTI with color-coded maps and fi- ber-tracking has shown that there may be variability in the involvement of pathways in patients with the same diagnosis, as in periventricular leukomalacia (PVL) (Hoon et al. 2002). This information could be helpful to provide a more specific localization of lesions in the white matter, better understanding of the pathophysiology of the disease what would lead to better clinical correlation and better oriented therapeutic intervention. DTI parameters and fiber-track- ing were also tested in patients with congenital hemiplegia (Glenn et al. 2003) and stands as a promising technique for the assessment of motor dysfunction in the pediatric population.
6.6.3
Initial Applications in Other Diseases
As DTI reflects both axonal and myelin restrictions, DTI and DWI are expected to be very useful in the assessment of disorders in which these microstructures are changed. This is especially so for white matter diseases (Horsfield and Jones 2002), which are expected to show an increase in average apparent diffusion constant and/or a decrease in diffusion anisotropy. The availability of fiber tracking technologies (Mori and van Zijl 2002) may make it possible to relate such diseases to specific fiber bundles. For instance, the cingulum (Sun et al. 2003) and frontotemporal and frontoparietal tracts (Burns et al. 2003) have been sought for in schizophrenic patients, the cortical-spinal tracts in multiple sclerosis (MS) (Wilson et al. 2003) and amyotrophic lateral sclerosis (ALS) (Sach et al. 2004), and the temporalparietal white matter in dyslexia (Klingberg et al. 2000).
Leukodystrophies, as primary white matter diseases, comprise a very appealing group to be evaluated by DTI. Although one study suggested that DWI could differentiate dysmyelinating (primary problem with myelin production) from demyelinating (secondary destruction of myelin) diseases (Ono et al. 1997), which would potentially contribute to the diagnosis of this challenging group of diseases, this still has to be confirmed by other studies. Decreases in FA and increases in ADCav were able to reproduce the histopathological classification that is currently used in adrenoleukodystrophy (ALD), suggesting that DTI can be helpful to follow progression of the disease (Ito et al. 2001; Eichler et al. 2002). Abnormal fiber-
tracking of the genu of the corpus callosum has been demonstrated in a patient with X-ALD, in agreement with lesions shown by conventional MRI and neuropsychological evaluation (Mori et al. 2002).
The use of DWI to differentiate tumor from abscesses and arachnoid cysts from epidermoid cysts are well recognized in clinical practice, despite some pitfalls (Bergui et al. 2001). Abscesses, with their high content of macromolecules, cause restriction of diffusion, while tumors usually do not. Exceptions to this rule would be tumors with high cellularity that would also lead to decrease in diffusivity. Epidermoid cysts present with restricted diffusion signs, whereas arachnoid cysts display signal that follows CSF. For tumors, besides the attempts on quantification for differentiation of tumor infiltration versus edema and even for tumor grading and histologic typing (Dong et al. 2004; Sinha et al. 2002; Bastin et al. 2002), DTI and fiber-tracking can be used to better localize eloquent tracts and help the planning of maximum function-preserving surgeries (Tummala et al. 2003). Along with tumors, epilepsy presents with the option of surgical management and DTI has contributed to evaluate the lesion itself as well as the extension of abnormal tissue (Arfanakis et al. 2002; Eriksson et al. 2001).
A final application of DTI that looks promising is the assessment of the spine. This work is just starting and still has to resolve many issues, especially related to motion artifacts and the low SNR in the small spinal structures that need to be acquired at high spatial resolution (Ries et al. 2000; Demir et al. 2003; Clark and Werring 2002).
6.7 Conclusions
In the mid 1990s, DWI developed from a technically difficult and novel approach to a routine acquisition technique on clinical scanners. It now takes under 1 min to be acquired and can bring valuable information and pathophysiologic insight in many diseases. The same transition is currently happening in DTI, which is expected to contribute much novel clinical and neuroscientific information presently not accessible by other technologies. For instance, DTI is the only approach for tracking brain white matter fibers non-invasively in the human brain. In combination with functional MRI, which can outline activated cortical networks, DTI may thus provide clues on functional connectivity. DTI is also increasingly been

78
used to demonstrate subtle connectivity anomalies in a variety of dysfunctions, such as cerebral palsy, cancer, stroke, dyslexia, or diseases including multiple sclerosis and schizophrenia. Before DTI can become true clinical routine, some progress is still needed. This relates to factors such as scan time and therefore, patient tolerance, and the complexity of post-processing (now mostly off-line) required for the method.These issues are already being addressed. For instance, clinical equipment with whole-body gradients of up to 8 G/cm is becoming available, which,together with the clinical availability of 3-Tesla magnets will allow the use of multi-directional DTI at high spatial resolution (around 2×2×2 mm3) in a few minutes. Another issue that is often discussed is which quantitative parameter to choose, FA, RA, etc. Actually, these anisotropies are all related and the only advantage of using one versus the other will be based on contrast to noise, which depends on anisotropy of the particular structure being studied. It would be most helpful if all researchers would report the eigenvalues so that others can calculate any parameter they want. A further essential consideration for data analysis and reporting is the influence of partial volume effects between different structures. This is especially problematic for group studies or development studies.
However, it is safe to say that DTI and tractography provide us with a new opportunity for quantitative diagnosis of white matter structures in living humans and to assess changes due to brain disease.
References
Alexander AL, Hasan KM, Lazar M, Tsuruda JS, Parker DL (2001) Analysis of partial volume effects in diffusiontensor MRI. Magn Reson Med 45:770-780
Andrasko J (1976b) Water diffusion permeability of human erythrocytes studied by a pulsed gradient NMR technique. Biochim Biophys Acta 428:304-311
Arfanakis K et al (2002) Diffusion tensor MR imaging in diffuse axonal injury. AJNR Am J Neuroradiol 23:794-802 Arfanakis K et al (2002) Diffusion tensor MRI in temporal lobe
epilepsy. Magn Reson Imaging 20:511-519
Assaf BA et al (2003) Diffusion tensor imaging of the hippocampal formation in temporal lobe epilepsy. AJNR Am J Neuroradiol 24:1857-1862
Assaf Y, Cohen Y (2000) Assignment of the water slow-diffus- ing component in the central nervous system using q-space diffusion MRS: implications for fiber tract imaging. Magn Reson Med 43:191-199
Baird AE, Warach S (1998) Magnetic resonance imaging of acute stroke. J Cereb Blood Flow Metab 18:583-609
P. C. M. van Zijl et al.
Bammer R et al (2002)Diffusion tensor imaging using singleshot SENSE-EPI. Magn Reson Med 48:128-136
Basser PJ, Jones DK (2002) Diffusion-tensor MRI: theory, experimental design and data analysis - a technical review. NMR Biomed 15:456-467
Basser PJ, Pierpaoli C (1996) Microstructural and physiological features of tissues elucidated by quantitative-diffusion- tensor MRI. J Magn Reson B 111:209-219
Basser PJ, Mattiello J, LeBihan D (1994a) MR diffusion tensor spectroscopy and imaging. Biophys J 66:259-267
Basser PJ, Mattiello J, LeBihan D (1994b) Estimation of the effective self-diffusion tensor from the NMR spin echo. J Magn Reson B 103:247-254
Basser PJ, Pajevic S, Pierpaoli C, Duda J, Aldroubi A (2000) In vitro fiber tractography using DT-MRI data. Magn Reson Med 44:625-632
Bastin ME, Sinha S, Whittle IR, Wardlaw JM (2002) Measurements of water diffusion and T1 values in peritumoural oedematous brain. Neuroreport 13:1335-1340
Beaulieu C (2002) The basis of anisotropic water diffusion in the nervous system – a technical review. NMR Biomed 15:435-455
Beaulieu C, Allen PS (1994) Determinants of anisotropic water diffusion in nerves. Magn Reson Med 31:394-400
Bergui M, Zhong J, Bradac GB, Sales S (2001) Diffusionweighted images of intracranial cyst-like lesions. Neuroradiology 43:824-829
Burns J et al (2003) Structural disconnectivity in schizophrenia: a diffusion tensor magnetic resonance imaging study. Br J Psychiatry 182:439-443
Callaghan PT, Coy A, MacGowan D, Packer KJ, Zelaya FO (1991) Diffraction-like effects in NMR diffusion studies of fluids in porous solids. Nature 351:467-469
Callaghan PT, Codd SL, Seymour JD (1999) Spatial coherence phenomena arising from translational spin motion in gradient spin echo experiments. Concepts Magn Reson 11:181-202
Chun T, Ulug AM, van Zijl PC (1998) Single-shot diffusionweighted trace imaging on a clinical scanner. Magn Reson Med 40:622-628
Clark CA, Werring DJ (2002) Diffusion tensor imaging in spinal cord: methods and applications - a review. NMR Biomed 15:578-586
Cohen Y, Assaf Y (2002) High b-value q-space analyzed diffu- sion-weighted MRS and MRI in neuronal tissues - a technical review. NMR Biomed 15:516-542
Conturo TE, McKinstry RC, Akbudak E, Robinson BH (1996) Encoding of anisotropic diffusion with tetrahedral gradients: a general mathematical diffusion formalism and experimental results. Magn Reson Med 35:399-412
Conturo TE et al (1999) Tracking neuronal fiber pathways in the living human brain. Proc Natl Acad Sci USA 96:10422-10427 Cory DG, Garroway AN (1990) Measurement of translational displacement probabilities by NMR – an indicator of com-
partmentation. Magn Reson Med 14:435-444
Davis D et al (1994) Rapid monitoring of changes in water diffusion coefficients during reversible ischemia in cat and rat brain. Magn Reson Med 31:454-460
Decanniere C, Eleff S, Davis D, van Zijl PCM (1995) Correlation of rapid changes in the average water diffusion constant and the concentrations of lactate and ATP breakdown products during global ischemia in cat brain. Magn Reson Med 34:343-352

Quantitative Diffusion Imaging
Demir A et al (2003) Diffusion-weighted MR imaging with apparent diffusion coefficient and apparent diffusion tensor maps in cervical spondylotic myelopathy. Radiology 229:37-43
Dong Q et al (2004) Clinical applications of diffusion tensor imaging. J Magn Reson Imaging 19:6-18
Donnan GA, Davis SM (2002) Neuroimaging, the ischaemic penumbra, and selection of patients for acute stroke therapy. Lancet Neurol 1:417-425
Eichler FS et al (2002) Proton MR spectroscopic and diffusion tensor brain MR imaging in X-linked adrenoleukodystrophy: initial experience. Radiology 225:245-252
Eriksson SH, Rugg-Gunn FJ, Symms MR, Barker GJ, Duncan JS (2001) Diffusion tensor imaging in patients with epilepsy and malformations of cortical development. Brain 124:617-626
Frank LR (2001) Anisotropy in high angular resolution diffu- sion-weighted MRI. Magn Reson Med 45:935-939
Gillard JH et al (2001) MR diffusion tensor imaging of white matter tract disruption in stroke at 3 T. Br J Radiol 74:642647
Glenn OA et al (2003) DTI-based three-dimensional tractography detects differences in the pyramidal tracts of infants and children with congenital hemiparesis. J Magn Reson Imaging 18:641-648
Gonzalez RG et al (1999) Diffusion-weighted MR imaging: diagnostic accuracy in patients imaged within 6 hours of stroke symptom onset. Radiology 210:155-162
Hoon AH Jr et al (2002) Diffusion tensor imaging of periventricular leukomalacia shows affected sensory cortex white matter pathways. Neurology 59:752-756
Horsfield MA, Jones DK (2002) Applications of diffusionweighed and diffusion tensor MRI to white matter diseases. NMR Biomed 15:570-577
Huisman TA (2003)Diffusion-weighted imaging: basic concepts and application in cerebral stroke and head trauma. Eur Radiol 13:2283-2297
Huppi PS et al (1998) Microstructural development of human newborn cerebral white matter assessed in vivo by diffusion tensor magnetic resonance imaging. Pediatr Res 44:584-590
Huppi PS et al (2001) Microstructural brain development after perinatal cerebral white matter injury assessed by diffusion tensor magnetic resonance imaging. Pediatrics 107:455-460
Inder T et al (1999) Early detection of periventricular leukomalacia by diffusion-weighted magnetic resonance imaging techniques. J Pediatr 134:631-634
Ito R et al (2001) Diffusion tensor brain MR imaging in X- linked cerebral adrenoleukodystrophy. Neurology 56:544547
Jones DK, Simmons A, Williams SC, Horsfield MA (1999a) Non-invasive assessment of axonal fiber connectivity in the human brain via diffusion tensor MRI. Magn Reson Med 42:37-41
Jones DK, Horsfield MA, Simmons A (1999b) Optimal strategies for measuring diffusion in anisotropic systems by magnetic resonance imaging. Magn Reson Med 42:515525
Jones DK et al (2000) Cluster analysis of diffusion tensor magnetic resonance images in human head injury. Neurosurgery 47:306-313; discussion 313-314
Karger J, Pfeifer H, Heink W (1988) Principles and applica-
79
tion of self-diffusion measurements by nuclear magnetic resonance. Adv Magn Reson 12:1-89
Klingberg T et al (2000) Microstructure of temporo-parietal white matter as a basis for reading ability: evidence from diffusion tensor magnetic resonance imaging. Neuron 25:493-500
Kunimatsu A et al (2003) Three-dimensional white matter tractography by diffusion tensor imaging in ischaemic stroke involving the corticospinal tract. Neuroradiology 45:532-535
Lazar M,Alexander AL (2001) Proceeding of International Society of Magnetic Resonance in Medicine 506, Glasgow, UK
Le Bihan D (2003)Looking into the functional architecture of the brain with diffusion MRI. Nat Rev Neurosci 4:469-480 Le Bihan D, van Zijl P (2002) From the diffusion coefficient to
the diffusion tensor. NMR Biomed 15:431-434
Le Bihan D et al (1986) MR imaging of intravoxel incoherent motions: application to diffusion and perfusion in neurologic disorders. Radiology 161:401-407
Lim KO, Helpern JA (2002) Neuropsychiatric applications of DTI - a review. NMR Biomed 15:587-593
Liu AY, Maldjian JA, Bagley LJ, Sinson GP, Grossman RI (1999) Traumatic brain injury: diffusion-weighted MR imaging findings. AJNR Am J Neuroradiol 20:1636-1641
Lori NF, Akbuda E, Snyder AZ, Shimony JS, Conturo TE (1999) International Society of Magnetic Resonance in Medicine 775, Denver, CO
Lori NF, Akbudak JS, Shimony TS, Snyder RK, Conturo TE (2002) Diffusion tensor fiber tracking of brani connectivity: reliability analysis and biological results. NMR Biomed 15:494-515
Lutsep HL et al (1997) Clinical utility of diffusion-weighted magnetic resonance imaging in the assessment of ischemic stroke. Ann Neurol 41:574-580
Makris N et al (1997) Morphometry of in vivo human white matter association pathways with diffusion weighted magnetic resonance imaging. Ann Neurol 42:951-962
Mangin JF, Poupon C, Clark C, Le Bihan D, Bloch I (2002) Distortion correction and robust tensor estimation for MR diffusion imaging. Med Image Anal 6:191-198
McKinstry RC et al (2002) A prospective, longitudinal diffusion tensor imaging study of brain injury in newborns. Neurology 59:824-833
Minematsu K et al (1992) Diffusion-weighted magnetic resonance imaging: rapid and quantitative detection of focal brain ischemia. Neurology 42:235-240
Moonen CT, van Zijl PC, Le Bihan D, DesPres D (1990) In vivo NMR diffusion spectroscopy: 31P application to phosphorus metabolites in muscle. Magn Reson Med 13:467-477
Mori S, van Zijl PC (2002) Fiber tracking: principles and strategies - a technical review. NMR Biomed 15:468-480
Mori S, van Zijl PCM (1995) Diffusion weighting by the trace of the diffusion tensor within a single scan. Magn Reson Med 33:41-52
Mori S, Crain BJ, Chacko VP, van Zijl PCM (1999) Three dimensional tracking of axonal projections in the brain by magnetic resonance imaging. Ann Neurol 45:265-269
Mori S et al (2001) Diffusion tensor imaging of the developing mouse brain. Magn Reson Med 46:18-23
Mori S et al (2002) Imaging cortical association tracts in human brain. Magn Reson Med 47:215-223
Moseley M (2002) Diffusion tensor imaging and aging - a review. NMR Biomed 15:553-560

80
Moseley ME et al (1990a) Early detection of regional cerebral ischemia in cats: comparison of diffusionand T2-weighted MRI and spectroscopy. Magn Reson Med 14:330-346
Moseley ME et al (1990b) Diffusion-weighted MR imaging of anisotropic water diffusion in the cat central nervous system. Radiology 176:439-445
Mukherjee P et al (2000) Differences between gray matter and white matter water diffusion in stroke: diffusion-tensor MR imaging in 12 patients. Radiology 215:211-220
Mukherjee P et al (2002) Diffusion-tensor MR imaging of gray and white matter development during normal human brain maturation. AJNR Am J Neuroradiol 23:1445-1456
Neil J et al (1998) Normal brain in human newborns: apparent diffusion coefficient and diffusion anisotropy measured by using diffusion tensor MR imaging. Radiology 209:57-66
Neil J, Miller J, Mukherjee P, Huppi PS (2002) Diffusion tensor imaging of normal and injured developing human brain - a technical review. NMR Biomed 15:543-552
Nusbaum AO, Tang CY, Buchsbaum MS, Wei TC, Atlas SW (2001) Regional and global changes in cerebral diffusion with normal aging. AJNR Am J Neuroradiol 22:136-142
Ono J, Harada K, Mano T, Sakurai K, Okada S (1997) Differentiation of dysand demyelination using diffusional anisotropy. Pediatr Neurol 16:63-66
O’Sullivan M et al (2001) Evidence for cortical “disconnection” as a mechanism of age-related cognitive decline. Neurology 57:632-638
Pajevic S, Pierpaoli C (1999) Color schemes to represent the orientation of anisotropic tissues from diffusion tensor data: application to white matter fiber tract mapping in the human brain. Magn Reson Med 42:526-540
Pfefferbaum A et al (2000) Age-related decline in brain white matter anisotropy measured with spatially corrected echoplanar diffusion tensor imaging. Magn Reson Med 44:259268
Pfefferbaum A, Adalsteinsson E, Sullivan EV (2003) Replicability of diffusion tensor imaging measurements of fractional anisotropy and trace in brain. J Magn Reson Imaging 18:427-433
Pierpaoli C, Basser PJ (1996) Toward a quantitative assesment of diffusion anisotropy. Magn Reson Med 36:893-906 Pierpaoli C, Jezzard P, Basser PJ, Barnett A, DiChiro G (1996)
Diffusion tensor MR imaging of the human brain. Radiology 201:637-648
Pierpaoli C et al (2001) Water diffusion changes in Wallerian degeneration and their dependence on white matter architecture. Neuroimage 13:1174-1185
Poupon C et al (2000) Regularization of diffusion-based direction maps for the tracking of brain white matter fascicules. NeuroImage 12:184-195
Provenzale JM, Sorensen AG (1999) Diffusion-weighted MR imaging in acute stroke: theoretic considerations and clinical applications. AJR Am J Roentgenol 173:14591467
Pruessmann KP, Weiger M, Scheidegger MB, Boesiger P (1999) SENSE: sensitivity encoding for fast MRI. Magn Reson Med 42:952-962
Ptak T et al (2003) Cerebral fractional anisotropy score in trauma patients: a new indicator of white matter injury after trauma. AJR Am J Roentgenol 181:1401-1407
Ricci PE, Burdette JH, Elster AD, Reboussin DM (1999) A
P. C. M. van Zijl et al.
comparison of fast spin-echo, fluid-attenuated inversionrecovery, and diffusion-weighted MR imaging in the first 10 days after cerebral infarction. AJNR Am J Neuroradiol 20:1535-1542
Ries M, Jones RA, Dousset V, Moonen CT (2000) Diffusion tensor MRI of the spinal cord. Magn Reson Med 44:884892
Sach M et al (2004) Diffusion tensor MRI of early upper motor neuron involvement in amyotrophic lateral sclerosis. Brain 127:340-350
Schlaug G et al (1999) The ischemic penumbra: operationally defined by diffusion and perfusion MRI. Neurology 53:1528-1537
Schlaug G, Siewert B, Benfield A, Edelman RR,Warach S (1997) Time course of the apparent diffusion coefficient (ADC) abnormality in human stroke. Neurology 49:113-119
Shimony JS et al (1999) Quantitative diffusion-tensor anisotropy brain MR imaging: normative human data and anatomic analysis. Radiology 212:770-784
Sinha S, Bastin ME, Whittle IR, Wardlaw JM (2002) Diffusion tensor MR imaging of high-grade cerebral gliomas. AJNR Am J Neuroradiol 23:520-527
Skare S, Hedehus M, Moseley ME, Li TQ (2000) Condition number as a measure of noise performance of diffusion tensor data acquisition schemes with MRI. J Magn Reson 147:340-352
Sodickson DK, Manning WJ (1997) Simultaneous acquisition of spatial harmonics (SMASH): fast imaging with radiofrequency coil arrays. Magn Reson Med 38:591-603
Sorenson AG et al (1996) Hyperacute stroke: evaluation with combined multisection diffusion-weighted and hemodynamically weighted echo-planer MR imaging. Radiology 199:391-401
Sorensen AG et al (1999) Human acute cerebral ischemia: detection of changes in water diffusion anisotropy by using MR imaging. Radiology 212:785-792
Sotak CH (2002) The role of diffusion tensor imaging in the evaluation of ischemic brain injury. NMR Biomed 15:561-569 Steel RM et al (2001) Diffusion tensor imaging (DTI) and
proton magnetic resonance spectroscopy (1H MRS) in schizophrenic subjects and normal controls. Psychiatry Res 106:161-170
Stejskal EO, Tanner JE (1965) Spin diffusion measurements: spin echoes in the presence of a time-dependent field gradient. J Chem Phys 42:288-292
Stieltjes B et al (2001) Diffusion tensor imaging and axonal tracking in the human brainstem. Neuroimage 14:723-735 Sun Z et al (2003) Abnormal anterior cingulum in patients with schizophrenia: a diffusion tensor imaging study. Neu-
roreport 14:1833-1836
Tuch DS,Wiegell MR, Reese TG, Belliveau JW,Wedeen V (2001) Proceeding of International Society of Magnetic Resonance in Medicine 502, Glasgow, UK
Tummala RP, Chu RM, Liu HTT, Hall WA (2003) Application of diffusion tensor imaging to magnetic-resonance-guided brain tumor resection. Pediatr Neurosurg 39:39-43
Ulug A, van Zijl PCM (1999) Orientation-independent diffusion imaging without tensor diagonalization: anisotropy definitions based on physical attributes of the diffusion ellipsoid. J Magn Reson Imaging 9:804-813
Ulug AM, Beauchamp N, Bryan RN, van Zijl PCM (1997) Absolute quantitation of diffusion constants in human stroke. Stroke 28:483-490

Quantitative Diffusion Imaging
Van Gelderen P et al (1994) Water diffusion and acute stroke. Magn Reson Med 31:154-163
Van Zijl PC et al (1991)Complete separation of intracellular and extracellular information in NMR spectra of perfused cells by diffusion-weighted spectroscopy. Proc Natl Acad Sci USA 88:3228-3232
Van Zijl PCM,Davis D,Moonen CTW (1994) Diffusion spectroscopy in living systems. In: Gillies RJ (ed) NMR in physiology and biomedicine. Academic Press, San Diego, pp 185-198
Wakana S, Jiang H, Nagae-Poetscher LM, van Zijl PC, Mori S (2004) Fiber tract-based atlas of human white matter anatomy. Radiology 230:77-87
Warach S, Chien D, Li W, Ronthal MM, Edelman RR (1992) Fast magnetic resonance diffusion-weighted imaging of acute human stroke. Neurology 42:1717-1723
Warach S, Gaa D, Siewert B, Wielopolski P, Edelman RR (1995) Acute human stroke studied by whole brain echo planar diffusion-weighted magnetic resonance imaging. Ann Neurol 37:231-241
Warach S, Mosley M, Sorensen AG, Koroshetz W (1996a) Time course of diffusion imaging abnormalities in human stroke. Stroke 27:1254-1256
Warach S, Dashe JF, Edelman RR (1996b) Clinical outcome in ischemic stroke predicted by early diffusion-weighted
81
and perfusion magnetic resonance imaging: a preliminary analysis. J Cereb Blood Flow Metab 16:53-59
Warach S, Boska M, Welch KM (1997) Pitfalls and potential of clinical diffusion-weighted MR imaging in acute stroke. Stroke 28:481-482
Welch KM et al (1995) A model to predict the histopathology of human stroke using diffusion and T2-weighted magnetic resonance imaging. Stroke 26:1983-1989
Westerhausen R et al (2003) The influence of handedness and gender on the microstructure of the human corpus callosum: a diffusion-tensor magnetic resonance imaging study. Neurosci Lett 351:99-102
Wiegell M, Larsson H, Wedeen V (2000) Fiber crossing in human brain depicted with diffusion tensor MR imaging. Radiology 217:897-903
Wilson M,Tench CR,Morgan PS,Blumhardt LD (2003) Pyramidal tract mapping by diffusion tensor magnetic resonance imaging in multiple sclerosis: improving correlations with disability. J Neurol Neurosurg Psychiatry 74:203-207
Wong EC, Cox RW, Song AW (1995) Optimized isotropic diffusion weighting. Magn Reson Med 34:139-143
Yang Q et al (1999) Serial study of apparent diffusion coefficient and anisotropy in patients with acute stroke. Stroke 30:2382-2390

MR Methods to Measure Cerebral Perfusion |
83 |
7MR Methods to Measure Cerebral Perfusion
Scott D. Swanson
CONTENTS
7.1Introduction 83
7.2Background 83
7.3 |
Dynamic Susceptibility Contrast 84 |
7.3.1What Causes the Signal to Change? 84
7.3.2How Does the Signal Change Correspond to Tracer Concentration? 84
7.3.3How Is the Time–Concentration Tracer Curve
Turned into a Measure of Perfusion? 85
7.3.3.1Numerical Integration 85
7.3.3.2Deconvolution 85
7.4 |
Arterial Spin Labeling |
86 |
|
7.4.1 |
What Causes the Signal to Change? |
87 |
|
7.4.1.1 |
Spin-Lattice Relaxation |
88 |
|
7.4.1.2 |
Coupled Reservoirs of Magnetization |
88 |
|
7.4.2 |
Measurement of Flow with ASL 89 |
|
|
7.5 |
Laser Polarized Xenon |
90 |
|
|
References 91 |
|
|
noninvasive. Lost, however, is the direct and emphatic visualization of perfusion experienced by Roy and Sherrington (1890). The recording of quantitative blood flow by MRI is hidden behind complicated mathematical formulas and arcane pulse sequences.
The purpose of this chapter is to present a general description of the two methods that have come to dominate the measurement of cerebral perfusion with MRI: dynamic susceptibility contrast (DSC) and arterial spin labeling (ASL). In doing so, I hope to unravel some of the complicated mathematics so that the reader has a more general understanding of the procedures needed to obtain either a qualitative or a quantitative map of cerebral blood flow (CBF). In addition, I will present the possibility of measuring CBF with laser polarized xenon.
7.1 |
7.2 |
Introduction |
Background |
More than 100 years ago, Roy and Sherrington (1890) showed that stimulation of peripheral nerves creates a change in local cerebral perfusion. Their setup was simple; the exposed cerebral surface of a dog brain and the means to provide sensory stimulation. Though not complicated, this experiment allowed them to directly visualize changes in blood flow with stimulation. Kety and Schmidt (1945) and Meier and Zierler (1954) developed methods and analysis for perfusion imaging of diffusible and non-diffusible tracers, respectively. These ideas revolutionized perfusion imaging and form the scientific foundation for MR imaging of perfusion. Today, MR has the ability to monitor blood flow with sophisticated methods that are either effectively or entirely
S. D. Swanson
Research Assistant Professor, Department of Radiology, University of Michigan, 200 Zina Pitcher Place, Ann Arbor, MI 48109-0553, USA
Cerebral perfusion is a measure of the rate of blood flow through the capillary bed in a given mass of tissue and is a primary indicator of tissue health. The means to non-invasively image tissue perfusion has long been a goal in neuroscience. Perfusion imaging maps parameters related to the delivery of blood to the brain. These parameters include the mean transit time (MTT): the average time it takes a tracer to travel through the tissue, cerebral blood volume (CBV): the volume percent of blood in a voxel, and cerebral blood flow (CBF): the rate of blood flow per unit tissue. The cerebral blood volume in gray matter is 4%–7% and 2%–3% in white matter (Thomas et al. 2000). The units of CBF are commonly expressed in ml/min/100 g of tissue. Typical values of cerebral perfusion are 20–25 ml/min/100 g in white matter and 45–70 ml/min/100 g in gray matter (Calamante et al. 1999).
A variety of imaging modalities are able to measure cerebral perfusion. PET studies of 15O labeled