

Книги по МРТ КТ на английском языке / MR Imaging in White Matter Diseases of the Brain and Spinal Cord - K Sartor Massimo Filippi Nicola De Stefano Vincent Dou
.pdfMR Spectroscopy |
115 |
9MR Spectroscopy
Robert E. Lenkinski
CONTENTS
9.1Introduction 115
9.2Spatial Localization 116
9.3Compounds Detected by MRS in the Human Brain 118
9.3.1Lipid/lactate 118
9.3.2N-Acetylaspartate 118
9.3.3Glutamine, Glutamate and γ-Aminobutyric Acid
Labeled as Amino Acids or AA in the Spectra 119
9.3.4Creatine 119
9.3.5Choline(s) 119
9.3.6Myo-Inositol 120
9.4Quantitation 120
9.5 |
Applications to White Matter Disease 120 |
9.5.1HIV 120
9.3.2 |
Progressive Multifocal Leukoencephalopathy 122 |
9.5.3Multiple Sclerosis 122
9.5.4Alzheimer’s Dementia 123
9.5.5 |
Other White Matter diseases 123 |
9.6 |
Summary and Future Directions 123 |
|
References 123 |
9.1 Introduction
Magnetic resonance imaging (MRI) has emerged as the preeminent imaging modality for visualizing neurological diseases in the central nervous system. MRI is a modality that can be used to produce both high resolution anatomically based images, as well as images that reflect a variety of physiological parameters including blood flow, tissue perfusion and water mobility as reflected by diffusion indices. MR spectroscopy (MRS) is a complementary technique that can provide metabolic information that can easily be integrated with MRI. MRS is the more modern
R.E. Lenkinski, PhD
Director of Experimental Radiology and 3T Magnetic
Resonance Imaging/Spectroscopy Program, Department of
Radiology, Beth Israel Deaconess Medical Center; Professor
of Radiology, Harvard Medical School, Boston, Massachusetts,
USA
version of NMR which over the past five decades has evolved from a technique used in chemistry to determine the structure of molecules to a method with which to probe the metabolism of cells, tissues, intact animals and humans (Allen 1990; Avison et al. 1986; Bernard et al. 1983; Bottomley 1989;
Burt and Wyrwicz 1979; Burt et al. 1979; Cerdan and Seelig 1990; Gadian and Radda 1981; Iles et al. 1982; Kuchel 1981; Radda and Taylor 1985;
Roberts and Jardetzky 1981; Ruiz-Cabello and
Cohen 1993).
The early generations of NMR spectrometers employed room temperature ferromagnetism, and operated at fields between approximately 1 and 2 T, and could accommodate samples that contained less than 1 ml of solution. In the 1970s the development of vertical bore superconducting magnets provided a newer generation of NMR spectrometers that operated at higher fields and could obtain spectra from slightly larger volumes of sample (1–10 ml). As more of these instruments became available, several research groups began to use multinuclear NMR spectroscopy to investigate the bioenergetics and metabolism of cellular suspensions (see for example Evans and Kaplan 1977; Navon et al. 1977a, 1977b) and perfused tissue (see for example Ackerman et al. 1980; Jelicks and Gupta 1989).
Phosphorus-31 NMR spectroscopy was used to study cellular bioenergetics because several important compounds which are involved in cellular energetics, such as adenosine triphosphate (ATP), phosphocreatine (PCR) and inorganic phosphate (Pi), are readily detectable. Carbon-13 NMR spectroscopy could probe metabolism by following isotopically labeled substrates through various metabolic pathways (see for example London 1988). Although proton MRS was used extensively in chemical applications, its use in biological systems where the concentration of the compounds of interest are about 1–10 mM was hampered by the presence of a large background signal arising from water in the sample which could have a concentration approaching 90 M in protons. This large difference in signal intensities led to the

116 |
R. E. Lenkinski |
development of a variety of techniques that either did not excite the background water signal or suppressed it substantially (see for example Bottomley et al. 1985; Frahm 1989; Frahm et al. 1989. One of the major motivations for employing proton NMR methods is the greater sensitivity of this nucleus as compared to both P-31 and C-13. All other factors being equal, the MR sensitivity scales as the cube of magnetogyric ratio for each nucleus.
The availability of horizontal bore magnets led to the extension of these studies to intact animals (see Chatham and Blackband 2001 for reviews). Since the early 1980s, there has also been an increasing availability of whole-body MR scanners for use in diagnostic imaging. A large number of these MR scanners operate at 1.5 T, a magnetic field that is similar to the magnetic fields employed in the early days of NMR spectroscopy.
The development of spatially localized MRS (Aue
1986; Bolinger and Lenkinski 1992; Narayana and DeLayre 1986) has provided a bridge between metabolism and the anatomic and physiological studies available from MRI. These can now be combined into a single MR examination. In cases where distinct lesions (or lesions) are seen on MR, the MRS can provide metabolic profiles that might aid in the characterization of the lesion(s) and response to treatment. In cases where no distinct lesions are visible on MRI, MRS can provide a non-invasive assessment of the underlying metabolic status of the tissue being studied. This is particularly important in pathologies such as multiple sclerosis (MS) where metabolic alterations in so-called“normal-appearing white matter” may give some insights into the patterns of disease evolution and progression. Because there are several different approaches to acquiring spatially localized MRS, it is more convenient to think of MRS as a family of methods rather than a single technique. The utility and applicability of each technique to a particular kind of neurological disease state depend on a variety of technical and practical factors that are discussed.
In this chapter we review the localization methods currently used in studying white matter disease. In this part of the chapter we discuss the technical and practical factors that determine the applicability of the methods to particular kinds of studies. We also describe the various resonances detected by localized solvent-sup- pressed proton MRS of the brain in terms of the metabolic and biochemical information that can be derived from an analysis of their concentrations. Finally, we review some of the potential developments that may improve the performance of MRS in the future.
9.2
Spatial Localization
Localization can be achieved in MRS by employing RF gradients, static B0 gradients, or pulsed spatial gradients (or combinations of these). The technical details of all of these approaches have been described in detail (Aue 1986; Bolinger and Lenkinski 1992; Narayana and DeLayre 1986). The latter methods are similar to those currently employed in MRI. As pointed out above, proton spectroscopy of metabolites presents a problem in that metabolites at millimolar concentrations must be detected in the presence of a background water signal that is present at about 100 molar. For this reason solvent-suppression techniques have been combined with localization schemes to produce spatially localized solvent-sup- pressed spectra.The T1s of the various proton metabolites are quite long, and the T2s are also quite long permitting the use of methods such as the spin-echo or stimulated-echo sequences. For proton MRS of the brain, localization methods that either preserve the magnetization of only those protons being sampled and destroy the coherence of all of the unwanted spins or pulse sequences where only the spins from the desirable spins are excited, or combinations of these two approaches have found common use.
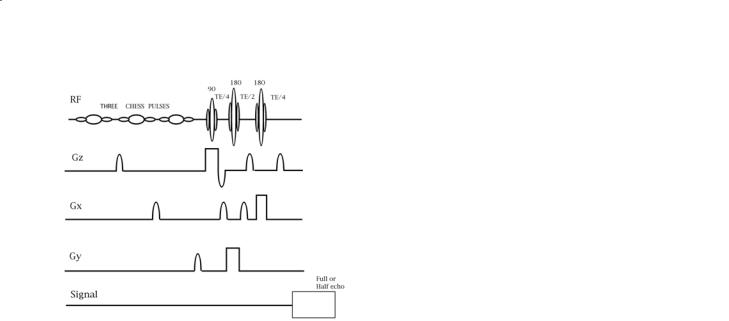
The unwanted magnetization arises from several sources: the background water signal, and the strong lipid signal arising from fat in the scalp. Regions with high magnetic susceptibility boundaries should be avoided in the excitation schemes. Suppression of the water signal is usually accomplished by 90° fre- quency-selective excitation of the water followed by dephasing gradients. This process destroys both the Z-magnetization of the water and its XY magnetization. The efficiency of suppression depends on a number of factors including the B1 homogeneity of the 90° frequency-selective excitation of the water (i.e. is this pulse a 90° pulse everywhere within the brain?) and the magnetic field homogeneity across the volume being sampled. The two most commonly used localization methods, STEAM and PRESS, select an orthorhombic volume in space by applying three sequential selective RF pulses in the presence of orthogonal slice-selective gradients. The pulse sequence for PRESS is shown in Fig. 9.1. The stimulated echo (STEAM) sequence (Frahm 1989; Frahm et al. 1989) and PRESS (Bottomley et al. 1985) method can be implemented as single-voxel (i.e. sampling only one region of tissue) or multivoxel methods (by selecting a larger ortho-rhombic volume combined with Fourier phase-encoding methods to produce
MR Spectroscopy |
117 |
Fig. 9.1. The PRESS pulse sequence shown for a single voxel acquisition. Note the three chemically shift selective (CHESS) pulses each followed by a dephasing gradient that precede the three slice-selective RF pulses.
CSI sequences (Aue 1986; Bolinger and Lenkinski 1992; Narayana and DeLayre 1986)).
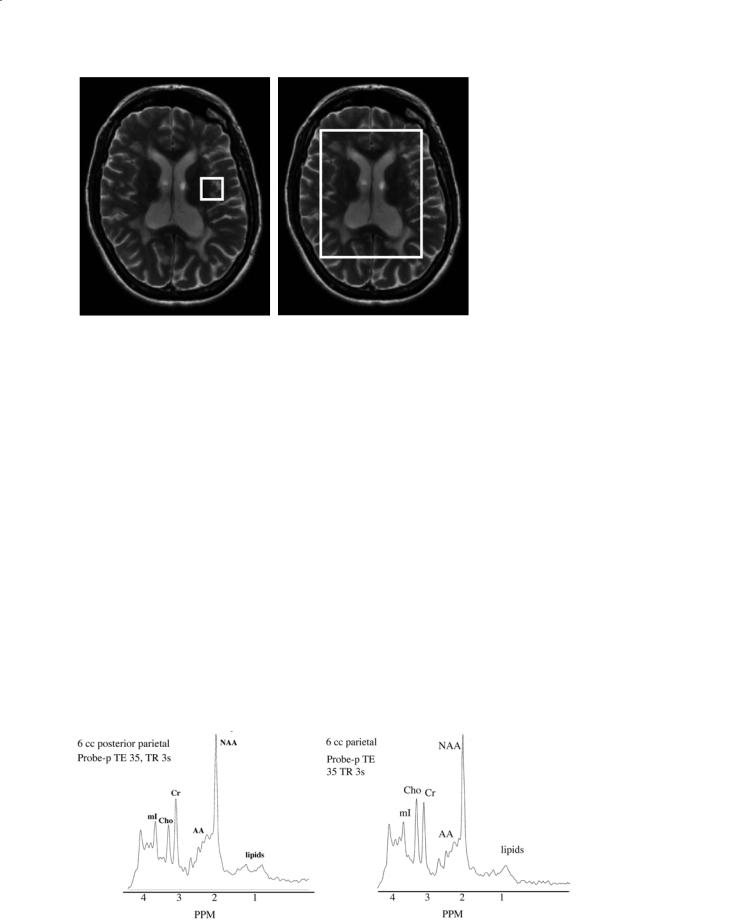
Examples of the graphic prescriptions of both single-voxel and multivoxel selections are illustrated in Fig. 9.2. Since only both STEAM and PRESS excite only the spins within the orthorhombic volume, these are examples of methods in which only those protons being sampled are excited, and the other spins are either not excited or destroyed. The advantages of using either of these two spatial preselection methods are that the signal from lipids arising from the scalp is minimized, and the volume over which the B0 field is adjusted can be restricted to avoid air–tis- sue boundaries where there may be large variations in the magnetic susceptibility. For reasons associated with instrument performance, such as residual eddy current effects, many of the early reports of proton MRS employed echo delays of 135 or 270 ms. The choice of 135 or 270 ms is made in order to refocus the doublet resonance of the methyl resonance of lactate, which has a value of about 7 Hz for the spin-spin coupling constant to its methenyl proton. As instrumental performance has improved, there has been a larger emphasis placed on acquiring proton spectra at shorter echo delays (20–60 ms). One advantage of these shorter delays is the ability to detect resonances from coupled spin systems (e.g.glutamate,glutamine, inositol) whose apparent T2s are too short to permit detection at longer echo delays.
The STEAM sequence originally provided more precise localization because the slice profiles of the 90° pulses were sharper than those achieved by con-
ventional 180° refocusing pulses (see for example Moonen et al. 1989; Yongbi et al. 1995). The precision of spatial localization was improved in PRESS in two ways. First, the development of so-called digi- tally-crafted or designer RF pulses has improved the quality of the slice profiles of the 180° pulses (see for example Chan et al. 1992; Conolly et al. 1992; Pauly et al. 1991; Shinnar 1994; Shinnar and Leigh 1989; Shinnar et al. 1989a, 1989b, 1989c; Spielman et al. 1991). Second, slice profiles have been improved through the use of a very selective spatial saturation pulse which can be applied at the six edges of the orthorhombus defined by either STEAM or PRESS spatial preselection (Tran et al. 2000).
In spite of these improvements,STEAM and PRESS may not be ideal methods for performing multivoxel studies of the brain. The requirement of selecting an orthorhombic volume means that major regions of the brain will not fit within this volume on an axial slice (see Fig. 9.2). These deficiencies have led investigators employing spatial presaturation methods to destroy the magnetization from tissues close to air–tissue boundaries where there may be large variations in the magnetic susceptibility. This method of spatial presaturation is often referred to as outer volume suppression (OVS). A popular method with OVS currently being used in the brain by a number of centers is based on the reports of Duyn and Moonen 1993 and Duyn et al. (1993) described at http://www. cc.nih.gov / ldrr / staff / janwvdv / index.html. Both a 1.5 T and 3 T version is available for use on gradi- ent-echo scanners. This method employs octagonal spatial presaturation pulses to remove the lipid signal arising from the scalp. It is a multislice sequence, which supports the acquisition of four slices (oblique if desired) in 29 min at a TE of 135 ms. This method acquires 24×24 phase encodes per slice. Processing software is available from Dr. Peter Barker at Johns Hopkins University through an NIH-funded RR facility. An alternate, multislice method without spatial presaturation has been described by Schuff et al. at 1.5 T (Schuff et al. 2001; Wiedermann et al. 2001). In this method the lipid resonance is suppressed with a selective inversion pulse. This method acquires two slices (oblique if desired) in 30 min at a TE of 135 ms. Processing software is also available from this group. The in-plane resolution is determined by 36×36 circularly bounded phase encoding steps across the slice. In both methods, water suppression is achieved through the use of CHESS pulses.
118 |
R. E. Lenkinski |
a
9.3
Compounds Detected by MRS in the Human Brain
Examples of proton MR spectra obtained from grey matter and white matter acquired using the PRESS sequence at a TE of 35 ms are shown in Fig. 9.3. The most prominent resonances are labeled on these spectra. We discuss each of these resonances (moving from low to high ppm values in turn). The biochemical basis for interpreting these spectra has been discussed in detail by Ross and Bluml (2001). We briefly review these here.
9.3.1
Lipid/lactate
Lactate is a doublet at 1.3 ppm.It is the end product of glycolysis. In general, lactate can become elevated in the brain in two ways. First, lactate will be produced
Fig. 9.2a,b. Examples of the graphic prescriptions for a single-voxel and multivoxel sequence. For the single-voxel sequence the volume selected is a cube. For the multivoxel sequence the volume selected is an orthorhombus. Note that the peripheral parts of the brain are not included in this orthorhombus.
b
if the tissue becomes ischemic. Second, it has been shown that lactate can become elevated if there are activated inflammatory cells present. Activated macrophages have been shown to produce high levels of lactate (see Lopez-Villegas et al. 1995).
Lipids can become elevated in some pathologies. In general, most studies have avoided making any interpretations based on these resonances because it is often unclear whether these peaks arise from out-of- voxel contamination, i.e. poor spatial localization.
9.3.2 N-Acetylaspartate
The isolation and identification of N-acetylaspartate (NAA) in the brain of cats was reported by Tallan et al. (1956). Soon after the detection of NAA in proton MRS, Birken and Oldendorf (1989) reviewed the literature regarding NAA’ s role in brain biochemistry. In spite of more than 40 years of investigation,
Fig. 9.3a,b. Representative MR spectra acquired at 1.5 T at an echo delay of 35 ms using the PRESS sequence from (a) grey matter and (b) white matter.
a |
b |
MR Spectroscopy |
119 |
the role of NAA in the brain is still somewhat unclear. Simmons et al. (1991) reported that NAA was found exclusively in neurons. This and many other observations have led many to conclude that NAA is a neuronal marker. This conclusion was questioned by Martin et al. (2001a) who reported MR spectra with little or no NAA in a 3-year-old with developmental deficits. This report was followed by several letters to the editor discussing the role of NAA as a neuronal marker (Barker 2001; Martin et al. 2001b; Sullivan et al. 2001).
It is also interesting that there are approximately equal concentrations of NAA in white and grey matter, which raises the issue of whether NAA is a marker of axonal integrity as well. The utility of NAA as an axonal marker is supported by the loss of NAA in many white matter diseases, including leukodystrophies, MS and hypoxic encephalopathy. Since MS is thought to be a disease that affects axons, the level of NAA has been used to monitor axonal viability in white matter lesions of MS and in surrounding nor- mal-appearing white matter.
Several groups have suggested that NAA is a cerebral osmolyte (Baslow 2002; Baslow 2003a, 2003b; Bluml et al. 1997). This role proposed for NAA implies that NAA changes might be reversible, an observation that has been made in several human studies, including MS.
9.3.3
Glutamine, Glutamate and γ-Aminobutyric Acid
Labeled as Amino Acids or AA in the Spectra
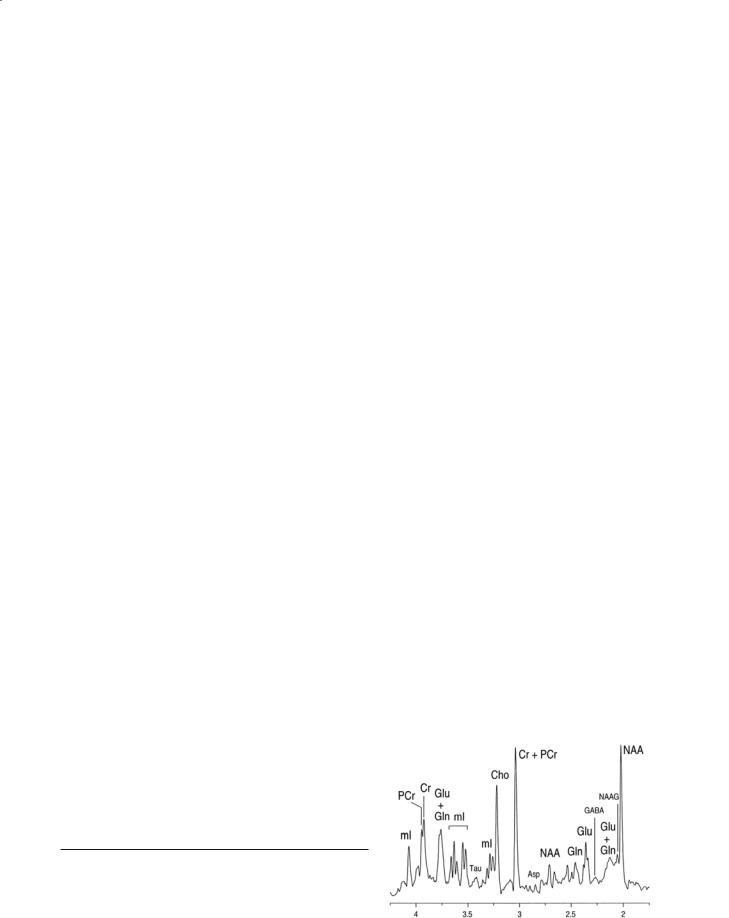
The determination of the concentrations of these compounds using 1H MRS is complicated by the complex spectral appearance of glutamate/glutamine due to J-coupling. There are also other metabolites contributing to the signal at the chemical shift of glutamate/glutamine that makes the accurate and precise determination of their concentrations difficult at 1.5 T. However, there are indications that the use of higher field strengths will improve the quantitation of these compounds (Tkac et al. 2003; Ugurbil et al. 2003). An example of a spectrum obtained at 7 T is shown in Fig. 9.4.
9.3.4 Creatine
The neurobiochemistry of creatine (Cr) has been discussed by Ross and Bluml (1996, 2001). This resonance is made up of at least two compounds, Cr and PCR, that are in rapid chemical, and enzymatic exchange. The concentration of this compound is estimated to be 8.6 mM in human brain. Many studies employ the level of the Cr peak as an internal standard since the levels of Cr are thought to relatively constant across the brain and do not change in most pathologies.However,caution should be used in cases where there is tissue destruction, since the level of Cr might fall. Also, there has been at least one report where a new human inborn error of Cr biosynthesis was manifested as an absence of cerebral Cr from the proton spectrum, and this deficiency was corrected by dietary administration of Cr (Hanefeld et al. 1993).
9.3.5.
Choline(s)
The biochemistry of compounds containing choline (Cho) has been reviewed by Miller et al. (1991). The Cho resonance arises from the tetramethylamine head group in soluble compounds such as Cho, phosphocholine, glycerophosphocholine, and betaine. In Fig. 9.3, it is clear that there may be different levels of Cho in grey and white matter. Ross and Bluml (2001) have reported that the concentration of Cho is about 1.6 mM in white matter. During active myelin breakdown, there is thought to be a release of phospholipids leading to an increase of the Cho peak (see for example Matthews et al. 1991).
Fig. 9.4. A proton MR spectrum acquired from a dog brain at 9.4 T from a 1 ml volume. Note the separation of all of the peaks allowing the identification of the compounds indicated. Reproduced from Ross and Bluml (1996). The spectrum was collected by Drs. R. Gruetter and I. Tkac at the University of Minnesota.

120 |
R. E. Lenkinski |
9.3.6 Myo-Inositol
Myo-inositol (mI) is a simple sugar that has a deceptively simple spectrum at 1.5 T. It has been previously shown that, in the brain, mI is synthesized primarily in glial cells and cannot cross the blood–brain barrier (Brand et al. 1993; Font et al. 1982). For these reasons, mI is considered to be a glial marker, and an increase in its content is believed to represent glial proliferation or an increase in glial cell size. Since both processes may occur in brain inflammation, an increase in mI may be a surrogate marker for inflammation in the brain. Myo-inositol has been suggested as a cerebral osmolyte since 1990. Like Cho, mI has also been labeled as a breakdown product of myelin.
9.4 Quantitation
acquired spectra in order to determine the area under each resonance.
There have been a number of approaches suggested for carrying out this step in the brain. These various approaches, applied to processing and fitting spectral data, were recently reviewed in a special issue of NMR in Biomedicine (vol. 14(4), 2001) devoted to spectral quantitation (for reviews see
Mierisova and Ala-Korpela 2001; Provencher
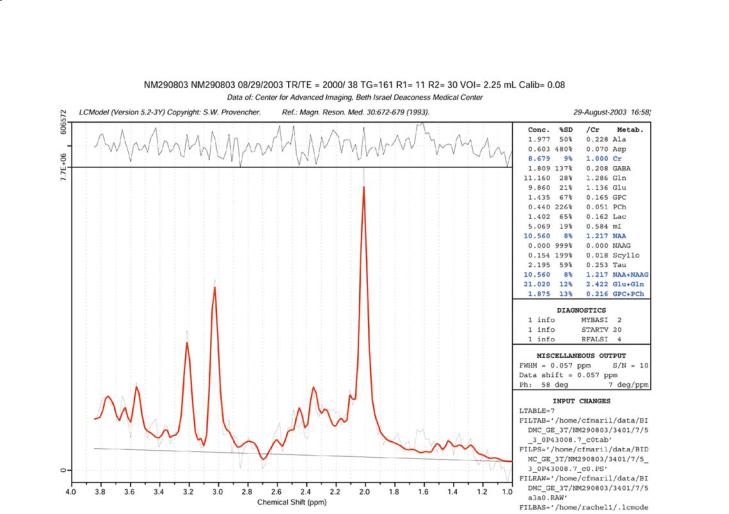
2001; Vanhamme et al. 2001; Zandt et al. 2001). A method that appears to be gaining wide acceptance is LC-Model that we employ routinely to automatically fit CSI data sets obtained from the brain. The version of LC-Model that we employ is similar to that described by McLean et al. (2000, 2001). An example of the results of a fit of LC-Model to a spectrum obtained at 3 T from a normal volunteer is shown in Fig. 9.5. Note that the output of LC-Model includes both relative and absolute concentrations of the various compounds detected.
There is still an ongoing debate on the merits concerning the relative versus absolute quantitation of the compound detected by proton MRS in the brain. One view is that only the determination of absolute concentrations is acceptable. This is based on the observation that the levels of all of the metabolites, including Cr, can change in brain pathologies. The calculation of absolute concentrations requires the correction for many factors including compartmentalization of compounds, correction for T1 and T2 relaxation effects; correction for excitation and reception profiles; determination of the actual, rather than the prescribed, volume sampled both in singlevoxel and multivoxel studies; and referencing the results to a known internal or external standard. Several different approaches have been suggested for absolute quantitation (Ernst et al. 1993; Helms 2000; Helms 2001; Hennig et al. 1992; Horska et al. 2002; Knight-Scott et al. 2003; Kreis et al. 1993a, 1993b).
Critics of absolute quantification suggest that it may be impossible to correct for all of these factors, particularly in the presence of pathologies, without making potentially flawed assumptions. For this reason they prefer to report relative concentrations, usually expressed as metabolite to Cr ratios. The potential flaw in this approach is that if the level of Cr is affected by the disease process, the use of ratios themselves might be misleading. There is a common step in both of these approaches, which is fitting the
9.5
Applications to White Matter Disease
The applications of MRS to study white matter disease has been reviewed by Filippi (2001) and Rudkin and Arnold (2002).
9.5.1 HIV
MRS of HIV has recently been reviewed by Boska et al. (2004) and Rudkin and Arnold (2002). We also reviewed this area in 1998 (Cecil and Lenkinski 1998). A common finding in all of the MR spectroscopy studies on HIV infection of the brain is the reduced level of NAA in the intermediate to later stages of disease. This finding is consistent with the pathological evidence of neuronal loss reported in HIV-1-infected patients at intermediate or late stages of disease.
Another common finding, although not present in all of the MRS studies, is the increase in Cho/Cr ratio (Chang et al.1999; Chong et al.1993; English et al. 1997; Jarvik et al. 1993; Laubenberger et al. 1996; Meyerhoff et al. 1993, 1994, 1999; Paley et al. 1995; Salvan et al. 1997; Tracey et al. 1996). The significance of the elevation in Cho/Cr ratio remains uncertain. A possible interpretation for this increase in HIV-1-infected patients is that the
MR Spectroscopy |
121 |
Fig. 9.5. An example of the output of LC-Model fitting of a spectrum obtained at 3 T from a normal volunteer using PRESS at TE 35 ms. Note that LC-Model provides both the relative and absolute concentrations of the compounds listed on the right.
increased Cho may not directly arise from changes in neurons but may result from metabolic alterations in glial cells. An alternate interpretation is that the increase in Cho/Cr ratio is a result of more cellular material being present in the volume of interest, perhaps as a result of increases in microglial cells and the presence of macrophages. Both of these explanations for the increase in Cho/Cr ratio are consistent with the neuropathological finding of inflammatory infiltrates in the brains of HIV-infected patients. An additional source of an increased Cho/Cr ratio may be as a result of breakdown in myelin. Choline phosphoglycerides contribute 11.2% of myelin lipids, with phosphatidylcholine being the most abundant. Therefore, as myelin damage occurs, free Cho may be released, increasing the Cho resonance detected by MR spectroscopy. This explanation for the increase in the Cho/Cr ratio is consistent with the neuropathological finding of white matter abnormalities in the brain of HIV-1-infected patients.
There is an emerging consensus that there is an increase in the mI resonance in HIV (Chang et al. 1999; Laubenberger et al. 1996; Lopez-Villegas et al. 1997; von Giesen et al. 2001). Brand et al. (1993) have shown that mI is produced exclusively in glial cell and not in neurons. This observation has led to the view that mI is a marker for gliosis. The possibility that the elevation of mI may precede the loss of NAA has previously been suggested for patients with Down syndrome, although the interpretation of the increased mI in this pathology might be different. Increased mI has been reported in Alzheimer’s disease, in which there is evidence for gliosis.Additional support for the use of mI as a marker for gliosis comes from studies of MS. Bitsch et al. (1999) showed that increases in both Cho and mI corresponded to glial proliferation on histology in MS plaques. Helms et al. (2000) found elevated mI in chronic but not acute MS lesions. This finding was interpreted in terms of gliosis in the chronic lesions. These results, taken together with our own observation that the mI in-

122 |
R. E. Lenkinski |
creases in white matter before any NAA loss, indicate that this metabolite may be a valuable early indicator for gliosis in the pathogenesis of HIV.
There also been several reports that have correlated spectral abnormalities with other indicators of disease progression (Chang et al. 1999; Chong et al. 1993; Jarvik et al. 1993; Lopez-Villegas et al. 1997; Meyerhoff et al. 1993, 1994, 1999). Some of these spectral alterations have been shown to reverse in response to therapy (Chang et al. 1999; Stankoff et al. 2001; Vion-Dury et al. 1995).
Several groups have suggested that there are distinct patterns of spectral abnormalities that occur as the disease progresses (Cecil and Lenkinski 1998; Salvan et al. 1997). We have proposed a model for the time-course of spectral alterations during disease progression (Cecil and Lenkinski 1998).This model fits with both literature observations of mI changes during the progression of disease and the model for immunopathogenesis of HIV-associated dementia (HAD). The ability of MRS to provide separate indices of inflammation (mI) and neuronal damage (NAA) may provide the capability to identify patients who have HAD which may reverse on treatment and which patients will not improve. This important step can potentially lead to individual optimized treatment effectiveness. There have been several papers in the literature (see for example McGuire and Marder 2000; Pulliam et al. 2001) which have suggested that there are new opportunities for developing therapies based on targets identified through an improved understanding of the immunopathogenesis and pathogenesis of HAD. Since proton MRS can monitor the course of disease progression it can provide a sensitive method for the early detection of HIV migration for the monitoring of the response to novel therapies in individual patients.
9.3.2
Progressive Multifocal Leukoencephalopathy
Progressive multifocal leukoencephalopathy (PML) is a demyelinating disease of the CNS caused by the polyomavirus JC (JCV) which occurs in the context of severe immunosuppression, such as in patients with AIDS, hematological malignancies, and in organ transplant recipients. There is no specific treatment for PML and the outcome is fatal in about 50% of HIV-positive (HIV+) patients with PML, despite the availability of highly active antiretroviral therapy (HAART) (Clifford et al. 1999). Indeed, contrast enhancement of PML lesions on MRI is
not a very sensitive method to evaluate intraparenchymal inflammation, and it can only be detected in approximately 20% of PML cases (Chang et al. 1997). In addition, distinction between active and chronic lesions is impossible by MRI. On the other hand, 1H-MRS has shown promise in the study of the metabolic alterations associated with PML. Crosssectional studies have shown a typical 1H-MRS pattern in PML lesions, including a decreases NAA/Cr ratio consistent with axonal compromise, increased Cho/Cr ratio, indicating cell membrane breakdown and turnover, and occasional elevation of lipid/lactate and mI (Chang et al. 1995, 1997; Iranzo et al. 1999; Simone et al. 1998). In one study, the two patients who had the longest survival showed the highest mI, consistent with increased glial activity and inflammation in PML lesions (Chang et al. 1997). These data suggest that 1H-MRS may be an ideal tool to measure the inflammatory component of PML lesions over time.
9.5.3
Multiple Sclerosis
MS is a demyelinating disease with the preservation of axonal integrity. For convenience we will discuss the findings of MRS in acute and chronic lesions and normal-appearing white and grey matter, respectively.
Acute lesions: One of the complicating technical factors is that unless the lesion is quite large the voxel chosen for MRS might contain a substantial amount of normal-appearing white matter.Hyperacutely,lesions display increased mI (Davie et al. 1994; Narayana et al. 1998), lipid, lactate and Cho (Davie et al. 1994; De Stefano et al. 1995). These lesions show decreases in Cr (De Stefano et al. 1995) followed by subsequent reductions in NAA (Davie et al.1994; Ferguson et al. 1997; Husted et al. 1994; Miller et al. 1991; Trapp et al. 1998). The decrease in the level of Cr calls into question the utility of using metabolite ratios in this situation. One of the interesting findings is the observation that these reductions in NAA may reverse (Arnold et al. 1992) as the plaque evolves. The MR spectrum of an acute, highly inflammatory, plaque such as seen in tumefactive MS, can be very similar to that seen for some tumors (Butteriss et al. 2003; Law et al. 2002; Saindane et al. 2002). Thus, caution should be employed in attempting to use MRS for making differential diagnoses between these two kinds of brain lesions.

MR Spectroscopy |
123 |
Chronic Plaques: For chronic lesions, i.e. those visible as hyperintense lesions on T2-weighted scans, most reports have focused on decreases in NAA. This is based on the observations that the levels of the other compounds detected by MRS return back to normal values over time. Several groups have made important interpretations based on the levels of NAA in chronic lesions. For example, Falini et al. (1998) reported that chronic lesions from patients with benign MS have much higher NAA levels than the chronic lesions from patients with secondary progressive MS, suggesting a greater recovery of NAA in acute lesions from less-disabled MS patients.
Normal-Appearing White Matter: There has been a consistent pattern observed in MS patients where the levels of NAA are decreased in so-called NAWM (Filippi et al. 1999). Decreased NAA levels are found in patients with established MS from the early phases of the disease (Arnold et al. 1992). This decrease is interpreted in terms of axonal loss in NAWM. Recently, Gonen et al. (2000) reported a method to determine whole-brain NAA in an effort to find a global index of NAA loss which might provide a better correlation with disability than more conventional indices, such as lesion volume or lesional NAA levels (Filippi et al. 2003; Gonen et al. 2002).
Grey Matter in MS: Although MS is thought to be a disease that affects white matter, there have been a number of recent reports that have indicated reduced NAA in regions that are in primarily grey matter (Adalsteinsson et al. 2003; Chard et al. 2002; Cifelli et al. 2002; Sarchielli et al. 2002). Adalsteinsson et al. (2003) have suggested that the NAA levels in grey matter may help explain the more severe clinical symptoms in patients with the more aggressive forms of MS.
9.5.4
Alzheimer’s Dementia
Decreased NAA and increased mI have been reported in the occipital, temporal, parietal, and frontal regions of patients with AD, even at the early stages of the disease (for a recent review see Valenzuela and Sachdev 2001). Similar metabolite changes are being reported in the mild cognitive impairment prodrome and in the medial temporal lobe.
9.5.5
Other White Matter diseases
The MRS of leukoencephalopathies, leukodystrophies, Canavan’s disease and vascular dementias has been reviewed by Filippi (2001).
9.6
Summary and Future Directions
MRS of white matter disease can detect a number of compounds that provide biochemical insight about the underlying metabolic basis for each of the pathologies discussed above. In spite of the great interest in proton MRS, there are still gaps in the understanding of the biochemistry of each of the compounds detected in the spectra. For example, the precise function of NAA is not completely understood. This is evidenced by the debates about its role as a neuronal marker. Also, over the past decade the techniques for acquiring localized spectra have improved substantially. However, most of the methods are mainly slice-selective 2D methods. Generalizing these methods to 3D, whole-brain methods are either too timeconsuming or too prone to artifacts. For example, using a low number of phase encoding steps in the slice direction can lead to a poor point spread function. An approach to solving this problem has been reported by Gonen et al. (1997, 1998) in which sliceencoding is achieved using the Hadamard method. This method gives much sharper slice profiles than the Fourier encoding for a small number of encoding steps.
There are high-speed MRSI methods based on either echo-planar methods (see for example Posse et al. 1994 and Posse et al. 1995) or spiral acquisitions (see for example Adalsteinsson et al. 1998). These methods are capable of acquiring spectral data in relatively short scan times but are usually acquired at relatively high bandwidths that may limit their sig- nal-to-noise. The combination of these methods with higher field strength such as 3 or 4 T may overcome these deficiencies.
References
Ackerman JJ, Bore PJ, Gadian DG, Grove TH, Radda GK (1980) NMR studies of metabolism in perfused organs. Philos Trans R Soc Lond B Biol Sci 289:425–436

124
Adalsteinsson E, Irarrazabal P, Topp S, Meyer C, Macovski A, Spielman DM (1998) Volumetric spectroscopic imaging with spiral-based k-space trajectories. Magn Reson Med 39:889–898
Adalsteinsson E, Langer-Gould A, Homer RJ, et al (2003) Grey matter-N-acetyl aspartate deficits in secondary progressive but not relapsing–remitting multiple sclerosis. Am J Neuroradiol 24:1941–1945
Allen PS (1990) In vivo nuclear-magnetic-resonance spectroscopy applied to medicine. J Can Assoc Radiol 41:39–44 Arnold DL, Matthews PM, Francis GS, Oconnor J, Antel JP
(1992) Proton magnetic-resonance spectroscopic imaging for metabolic characterization of demyelinating plaques. Ann Neurol 31:235–241
Aue WP (1986) Localization methods for in vivo nuclear magnetic resonance spectroscopy. Rev Magn Reson Med 1:21–72
Avison MJ, Hetherington HP, Shulman RG (1986) Applications of NMR to studies of tissue metabolism. Annu Rev Biophys Biophysical Chem 15:377–402
Barker PB (2001) N-acetyl aspartate – a neuronal marker? Ann Neurol 49:423–424
Baslow MH (2002) Evidence supporting a role for N-acetyl-L- aspartate as a molecular water pump in myelinated neurons in the central nervous system – an analytical review. Neurochem Int 40:295–300
Baslow MH (2003a) Brain N-acetylaspartate as a molecular water pump and its role in the etiology of Canavan disease
– a mechanistic explanation. J Mol Neurosci 21:185–189 Baslow MH (2003b) N-acetylaspartate in the vertebrate brain: metabolism and function. Neurochem Res 28:941–953 Bernard M, Canioni P, Cozzone PJ (1983) P-31 nuclear mag-
netic-resonance study of cellular metabolism in vivo. Biochimie 65:449–470
Birken DL, Oldendorf WH (1989) N-acetyl-L-aspartic acid – a literature-review of a compound prominent in H-1-NMR spectroscopic studies of brain. Neurosci Biobehav Rev 13:23–31
Bitsch A, Bruhn H, Vougioukas V, et al (1999) Inflammatory CNS demyelination: histopathologic correlation with in vivo quantitative proton MR spectroscopy. Am J Neuroradiol 20:1619–1627
Bolinger L, Lenkinski RE (1992) Localization in clinical NMR spectroscopy. In: Berliner LJ, Reuben J (eds) Biological magnetic resonance. Plenum Press, New York, pp 1–53
Boska MD, Mosley RL, Nawab M, et al (2004) Advances in neuroimaging for HIV-1 associated neurological dysfunction: clues to the diagnosis, pathogenesis and therapeutic monitoring. Curr HIV Res 2:61–78
Bottomley PA (1989) Human in vivo NMR spectroscopy in diagnostic medicine: clinical tool or research probe? Radiology 170:1–15
Bottomley PA, Edelstein WA, Foster TH, Adams WA (1985) In vivo solvent-suppressed localized hydrogen nuclear magnetic resonance spectroscopy: a window to metabolism? Proc Natl Acad Sci U S A 82:2148–2152
Bluml S, McComb JG, Ross BD (1997) Differentiation between cortical atrophy and hydrocephalus using 1H MRS. Magn Reson Med 37:395–403
Brand A, Richterlandsberg C, Leibfritz D (1993) Multinuclear NMR-studies on the energy-metabolism of glial and neuronal cells. Dev Neurosci 15:289–298
Burt CT, Wyrwicz AM (1979) P-31 nuclear magnetic resonance
R. E. Lenkinski
observations in biological systems .1. Intact tissue. Trends Biochem Sci 4:244–246
Burt CT, Cohen SM, Barany M (1979) Analysis of intact tissue with P-31 NMR. Annu Rev Biophys Bioeng 8:1–25
Butteriss DJA, Ismail A, Ellison DW, Birchall D (2003) Use of serial proton magnetic resonance spectroscopy to differentiate low grade glioma from tumefactive plaque in a patient with multiple sclerosis. Br J Radiol 76:662–665
Cecil KM, Lenkinski RE (1998) Proton MR spectroscopy in inflammatory and infectious brain disorders. Neuroimaging Clin N Am 8:863–880
Cerdan S, Seelig J (1990) NMR studies of metabolism. Annu Rev Biophys Biophysical Chem 19:43–67
Chan F, Pauly J, Macovski A (1992) Effects of RF amplifier distortion on selective excitation and their correction by prewarping. Magn Reson Med 23:224–238
Chang L, Ernst T, Aronow H, et al (1995) Proton spectroscopy in progressive multifocal leukoencephalopathy. Neurology 45:A444
Chang L, Ernst T, Tornatore C, et al (1997) Metabolite abnormalities in progressive multifocal leukoencephalopathy by proton magnetic resonance spectroscopy. Neurology 48:836–845
Chang L, Ernst T, Leonido-Yee M, et al (1999) Highly active antiretroviral therapy reverses brain metabolite abnormalities in mild HIV dementia. Neurology 53:782–789
Chang L, Ernst T, Leonido-Yee M, Walot I, Singer E (1999) Cerebral metabolite abnormalities correlate with clinical severity of HIV-1 cognitive motor complex. Neurology 52:100–108
Chard DT, Griffin CM, McLean MA, et al (2002) Brain metabolite changes in cortical grey and normal-appearing white matter in clinically early relapsing–remitting multiple sclerosis. Brain 125:2342–2352
Chatham JC, Blackband SJ (2001) Nuclear magnetic resonance spectroscopy and imaging in animal research. ILAR J 42:189–208
Chong WK, Sweeney B, Wilkinson ID, et al (1993) Proton spectroscopy of the brain in HIV infection: correlation with clinical, immunologic, and MR imaging findings. Radiology 188:119–124
Cifelli A, Arridge M, Jezzard P, Esiri MM, Palace J, Matthews PM (2002) Thalamic neurodegeneration in multiple sclerosis. Ann Neurol 52:650–653
Clifford DB, Yiannoutsos C, Glicksman M, et al (1999) HAART improves prognosis in HIV-associated progressive multifocal leukoencephalopathy. Neurology 52:623–625
Conolly S, Pauly J, Nishimura D, Macovski A (1992) Two-dimen- sional selective adiabatic pulses. Magn Reson Med 24:302–313 Davie CA, Hawkins CP, Barker GJ, et al (1994) Serial proton magnetic resonance spectroscopy in acute multiple sclero-
sis lesions. Brain 117 (Pt 1):49–58
De Stefano N, Matthews PM, Antel JP, Preul M, Francis G, Arnold DL (1995) Chemical pathology of acute demyelinating lesions and its correlation with disability. Ann Neurol 38:901–909
Duyn JH, Moonen CTW (1993) Fast proton spectroscopic imaging of human brain using multiple spin-echoes. Magn Reson Med 30:409–414
Duyn JH, Gillen J, Sobering G, Vanzijl PCM, Moonen CTW (1993) Multisection proton MR spectroscopic imaging of the brain. Radiology 188:277–282
English CD, Kaufman MJ, Worth JL, et al (1997) Elevated fron-