

Книги по МРТ КТ на английском языке / MR Imaging in White Matter Diseases of the Brain and Spinal Cord - K Sartor Massimo Filippi Nicola De Stefano Vincent Dou
.pdf188 |
M. Castillo |
liver is damaged and the brain may show findings related to chronic hepatic encephalopathy. African iron overload (Bantu siderosis) is due to increased ingestion of iron and also may lead to liver failure. Juvenile hemochromatosis is nearly identical to the hereditary type but manifests earlier in life and most patients die young due to heart failure (Sparacia et al. 1999). Transfusional siderosis occurs only after chronic and repeated whole blood transfusions and is more commonly seen in cancer patients and individuals with sickle cell anemia. Aceruloplasminemia is different from Wilson disease (see above) in that ceruloplasmin is completely absent, not just low (Sparacia et al. 2000). Ceruloplasmin has ferroxidase action that is partly responsible for the release of iron from many cells. In the absence of ceruloplasmin, iron accumulates in the basal ganglia and dentate nuclei of the cerebellum, and gives rise to progressive extrapyramidal signs, cerebellar ataxia, and eventually dementia.
Hallervorden-Spatz disease (HS) and Friedreich’s ataxia are also related to iron overload and degenerative brain disease. Little is known about the biochemical abnormalities of HS but it has been linked to an abnormality in chromosome 20p12.3-p13.Large amounts of iron are deposited in the globus pallidus and pars reticulata of the substantia nigra (Sparacia et al. 2000). Iron deposition leads to axonal swelling and decreased myelin thickness. Microscopy demonstrates the presence of abnormal, spherical bodies that contain superoxide dismutase and are believed to be typical for HS. Eventually, these regions of the brain are destroyed. Patients with HS demonstrate dystonia, muscle rigidity, hyperreflexia, and choreoathetosis.Mental retardation is variable and death occurs 1–2 years after the diagnosis. Because laboratory findings are non-specific, the combination of clinical symptoms and imaging findings are used to establish a diagnosis. The findings on CT scanning are nonspecific and MR is the imaging method of choice. Initially, only hypointensity (more pronounced on T2 than on T1 weighted sequences) is seen in the globus pallidus.When gliosis ensues, the globus pallidus becomes hyperintense on T2 weighted images but remains surrounded by hypointensity. This represents the so-called eye of the tiger sign and is said to be characteristic for HS.
Friedreich’s ataxia (FA) is a rare autosomal recessive disorder. It is part of the hereditary ataxic syndromes and will be discussed here because of its possible relation to abnormal iron metabolism. In 97% of patients it is caused by an abnormality located in chromosome 9, which encodes a protein
called frataxin which has been localized in the mitochondria, although its function is unknown (Berg et al. 2000). Increased iron deposition is found in the heart, liver and spleen in a pattern consistent with a mitochondrial location. There is iron accumulation, mitochondrial respiratory chain dysfunction and mitochondrial DNA depletion. The spinal cord is pathologically atrophic with damaged white matter tracts. The lumbar and sacral nerves are also atrophic. The cerebellar cortex and the brainstem may also show atrophy. Atrophy of the gray matter in the central sulcus is occasionally evident on gross and imaging examinations.
12.5.5
Hypoglycemia and Hyperglycemia
Most cerebral insults due to hypoglycemia occur in young children. Oxygen and glucose are the major substrates needed for normal brain metabolism and absence of either of both leads to significant injury. Hypoglycemia uncommonly affects the neonatal brain, which is normally fairly resistant to it. Acute symptoms of hypoglycemia include jitteriness, seizures, and vomiting (Hermann et al. 2000). Hypoglycemia is diagnosed when the whole blood glucose concentration falls below 20 mg/dl in preterm babies, 30 mg/dl in term babies, and 45 mg/dl in adults. Sequelae of hypoglycemia are mental retardation, spasticity, visual abnormalities, and microcephaly. In neonates, hypoglycemia leads to diffuse edema and infarctions. Typically, the occipital regions are affected more severely but the basal ganglia may also be involved (Bradley et al. 2000) (Fig. 12.10). The reason for this is not clear, but it may be related to the fact that in neonates the visual cortex is relatively more mature and metabolically more active than other regions, as during the neonatal period it experiences intense axonal migration and synaptogenesis (Spar et al. 1994). Other reasons include diffuse hypoxia secondary to heart failure, loss of cerebral vascular autoregulation, and excitatory toxicity (Aslan and Dinc 1997). Although the gray matter is especially affected, the occipital white matter and posterior thalamus may also be injured. Chronically, the cortex of the occipital lobes becomes thin, malacia develops, and these findings correlate with visual abnormalities. In adults, hypoglycemia may also induce occipital infarctions in addition to infarctions elsewhere (which are generally multiple), laminar necrosis, and transient imaging abnormalities.

Imaging of Inherited and Acquired Metabolic Brain Disorders |
189 |
Fig. 12.10. Hypoglycemia. Axial T2-weighted image shows infarctions in the territories of both middle and the left posterior cerebral arteries
Hyperglycemia also has adverse affects on the CNS. Hyperglycemia may lead to increases in cerebral lactic acid, which may damage the brain primarily or worsen the outcome of patients with underlying infarctions. A typical manifestation, and at times the initial one, of hyperglycemia is hemichorea-hemi- ballism (HH). The clinical manifestation of HH are random and fast jerking motion in the distal extremities (chorea) and violent flinging and kicking, mainly involving the proximal joints (ballismus) (Kinnala
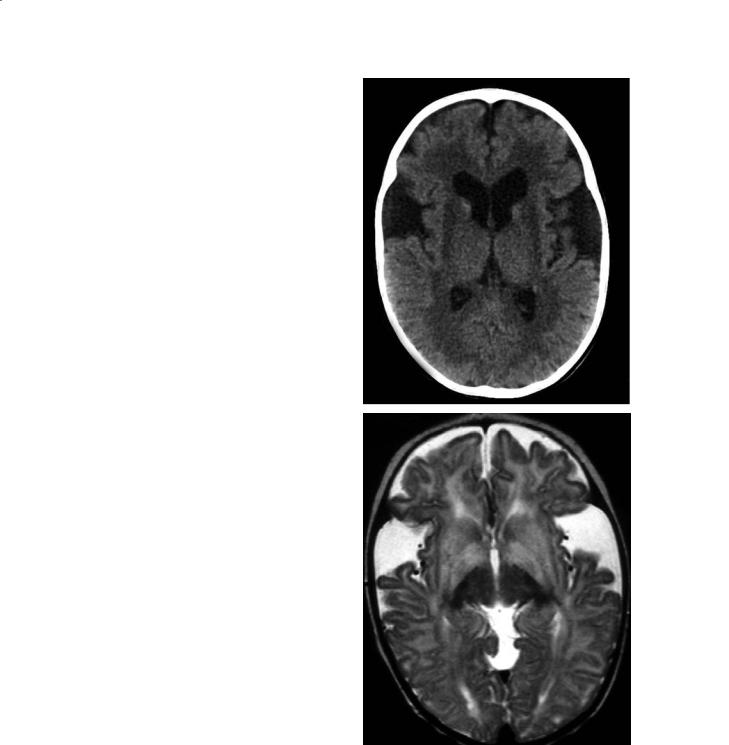
et al. 1999). In these patients, CT shows high density conforming to one lentiform nucleus and the head of the ipsilateral caudate nucleus (Fig. 12.11a). These regions are of increased signal intensity on MR T1 weighted images, and T2 weighted images are normal or show only slightly high T2 signal intensity (Fig. 12.11b,c). Occasionally, the ipsilateral cerebral peduncle may also show T1 hyperintensity in its anteromedial region (Kinnala et al.1999).Hemorrhage and/or calcifications have not been reported in HH and the findings are thought to be due to the presence of gemistocytes. MR spectroscopy obtained from the region of T1 signal intensity abnormality demonstrates elevated lactic acid and decreased creatine. These features have been interpreted as being due to depletion of energy leading to neuronal malfunction. Although the above described MR abnormalities are fairly typical for HH, they have also been noted in a patient with lupus erythematosus and chorea (Barkovich et al. 1998).
12.6
Disorders A ecting Gray and White Matter
12.6.1
Mitochondrial Disorders
Mitochondrial encephalopathies are relatively rare disorders involving a defect in the oxidative respira-
a |
b |
c |
Fig. 12.11a–c. Hemiballismus, hemichorea in hyperglycemia. a Axial CT image shows increased density in the left basal ganglia. b In a different patient, axial T1-weighted image shows increased signal intensity in the left putamen. c Corresponding T2weighted image shows subtle high signal intensity in the same location
190 |
M. Castillo |
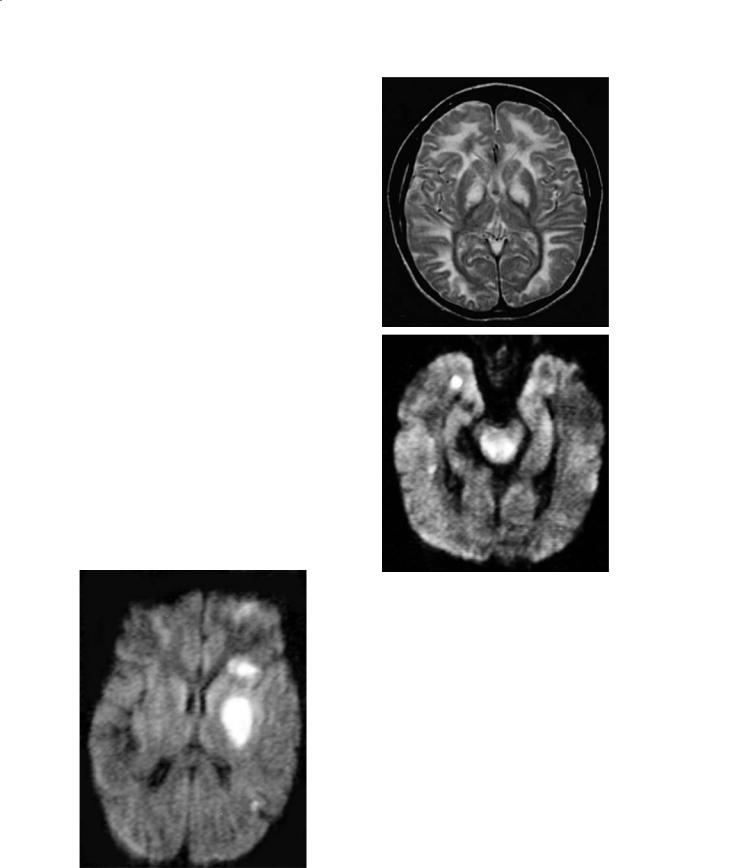
tory mechanism (usually due to impaired production of adenosine triphosphate) that leads to accumulation of lactic acid. Lactic acid may then be detected in serum or in the CSF on laboratory studies or by proton MR spectroscopy (Shan et al. 1998).Although most patients begin to have symptoms during childhood, some may present when they are adults. Most mitochondrial disorders affect the skeletal muscles and brain and as such most present with weakness and seizures (due to ischemia) (Kashihara et al. 1998). Mitochondrial disorders and organic acidurias share many biochemical and clinical features. The most common mitochondrial disease is MELAS (mitochondrial myopathy, encephalopathy, lactic acidosis, and strokes) that results in large non-territorial cerebral infarctions (including the basal ganglia and thalami) (Castillo et al. 1995) (Fig. 12.12). It more commonly manifests during the second decade of life, and strokes are the result of impaired function of the muscle in the walls of cerebral arteries.Pathologically there is spongy degeneration, neuronal loss, gliosis, and microcystic liquefaction in the affected regions.
MERFF is characterized by myoclonic epilepsy and its imaging findings are identical to those described for MELAS. Leigh disease (subacute necrotizing encephalomyelopathy) is due to pyruvate and cytochrome C oxidase deficiencies (Allard et al. 1988). This disease is usually diagnosed during the first year of life. It produces abnormalities in the basal ganglia,
a
b
Fig. 12.13a,b. Mitochondriopathy of the Leigh type. a Axial T2-weighted image shows abnormal high signal intensity in all of the white matter and in the medial lentiform nuclei and thalami. b In the same patient, axial trace diffusion-weighted image shows increased signal intensity in the peri-aqueductal region of the midbrain
Fig. 12.12. Mitochondriopathy of the MELAS type. Axial trace diffusion-weighted image shows acute infarction confined mostly to the left lentiform nucleus
the periaqueductal gray matter, and the subcortical white matter (Kim et al. 1996) (Fig. 12.13a,b).
Kearns-Sayre syndrome is characterized by abnormalities in the basal ganglia and in the white matter (which are extensive) (Medina et al. 1990). The typical clinical findings in these patients are ophthalmoplegia and cardiac conduction abnormalities. Pathologically there is capillary proliferation, necrosis, vacuolization, and demyelination of the affected areas. The MR imaging findings are extensive and include involvement of all deep gray matter structures (high T2 signal intensity) and extensive increased T2 signal in the white matter.
Imaging of Inherited and Acquired Metabolic Brain Disorders |
191 |
12.6.2
Amino Acidurias
Although amino acid disorders are not true leukodystrophies, they affect predominantly the white matter. In these disorders there is an abnormal formation of proteolipids that are needed to form normal myelin. The most common disorders in this group are: phenylketonuria (PKU) (non-specific white matter changes and atrophy on MR imaging), maple syrup disease (white matter and basal ganglia shows high T2 signal on MR imaging), homocystinuria (strokes and arterial occlusions on MRI and MRA respectively), and glutaric (dilated sylvian fissures and increased T2 signal in the basal ganglia and thalami), methylmalonic, and propionic acidurias (both show increased T2 signal in the deep gray matter structures and hemispheric white matter) (Paltiel et al. 1987; Demange et al. 1989; Shaw et al. 1991; Brismar et al. 1990b; Ruano et al. 1998; Brismar and Ozand 1995; Hald et al. 1991). Because of the neonatal screening for PKU mandated by law, this disorder is no longer as severe as it used to be. Patients with PKU are promptly started with a special diet and the imaging findings are mild (Paltiel et al. 1987). Glutaric aciduria type 1 (type 2 is very rare) is the one that classically results in cyst formation in the regions of the sylvian fissures (some believe that these are arachnoid cysts while others believe that they are the reflection of underlying temporal lobe hypoplasia), white matter abnormalities, and basal ganglia abnormalities (Brismar et al. 1990b; Ruano et al. 1998) (Fig. 12.14a,b). Methylmalonic acidemia results in extensive white matter abnormalities and characteristically high T2 signal intensity in the globi pallidi (Brismar and Ozand 1995; Hald et al. 1991). The findings in propionic aciduria are similar to those seen in methylmalonic aciduria (Brismar and Ozand 1995). Many of these disorders will show a dramatic improvement on MRI after a few weeks of treatment. The myelination milestones are delayed in all of these disorders. Proton MR spectroscopy generally shows several peaks between 1.5 and 2.5 parts per million (ppm) which are thought to represent abnormal accumulation of amino acids and low NAA. In my opinion, it is extremely difficult to suggest these diagnoses based on imaging findings.
a
b
Fig. 12.14a,b. Glutaric aciduria type 1.aAxial CT shows prominent sylvian fissures and low density from the periventricular white matter and putamina. b Axial T2-weighted image in a different patient shows wide sylvian fissures and high signal intensity in the white matter and basal ganglia bilaterally

192
References
Albernaz VS, Castillo M, Mukherji SK, Siatkowski RM, Naidich TP (1997) Facies to remember, number 11, part I: the challenge. Int J Neuroradiol 3:206-217
Allard JC, Tilak S, Carter AP (1988) CT and MR of MELAS syndrome. AJNR 9:1234-1238
Alorayni IA, Patenaude YG, O’Gorman AM, Black DN, Mea- gher-Villemure K (1999) Cree leukoencephalopathy: neuroimaging findings. Radiol 213: 400-406
Andreula CF, De Blasi R, Carella A (1991) CT and MR studies of methylmalonic acidemia. AJNR Am J Neuroradiol 12:410-412
Aslan Y, Dinc H (1997) MR findings of neonatal hypoglycemia. AJNR Am J Neuroradiol 18:994-995
Barkovich AJ, Ferreiro DM, Bass N, Boyer R (1994) Involvement of the pontomedullary corticospinal tracts: a useful finding in the diagnosis of X-linked adrenoleukodystrophy. AJNR Am J Neuroradiol 15:1767-1771
Barkovich AJ, Ali FA, Rowley HA, Bass N (1998) Imaging patterns of neonatal hypoglycemia. AJNR Am J Neuroradiol 19:523-528
Berg D, Hoggenmuller U, Hofmann E, Fischer R, Kraus M, Scheurlen M, Becker G (2000) The basal ganglia in haemochromatosis. Neuroradiology 42:9-13
Bradley JL, Blake JC, Chamberlain S, Thomas PK, Cooper JM, Schapira AHV (2000) Clinical, biochemical and molecular genetic correlations in Freidreich’s ataxia. Hum Mol Genet 9:275-282
Brismar J, Ozand PT (1995) CT and MR of the brain in glutaric acidemia type I: a review of 59 published cases and a report of 5 new patients. AJNR Am J Neuroradiol 16:675-683
Brismar J, Brismar G, Gascon G, Ozand P (1990a) Canavan disease: CT and MR imaging of the brain. AJNR Am J Neuroradiol 11:805-810
Brismar J, Aqueel A, Brismar G, Coates R, Gascon G, Ozand P (1990b) Maple syrup urine disease: findings on CT and MR scans of the brain in 10 infants. AJNR Am J Neuroradiol 11:1219-1228
Castillo M, Kwock, Green C (1995) MELAS syndrome: imaging and proton MR spectroscopic findings. AJNR Am J Neuroradiol 16:233-239
Choi S, Enzmann DR (1993) Infantile Krabbe disease: complementary CT and MR findings. AJNR Am J Neuroradiol 14:1164-1666
Cordato DJ, Fulham MJ, Yiannikas C (1998) Pretreatment and posttreatment positron emission tomographic scan imaging in a 20-year-old patient with Wilson’s disease. Mov Disord 13:162-166
Demange P, Pham Gia H, Kalifa G, Sellier N (1989) MR of Kearns-Sayre syndrome. AJNR 10[5 Suppl]:S91
Engelbrecht V, Schlaug G, Hefter H, Kahn T, Modder U (1995) MRI of the brain in Wilson disease: T2 signal loss under therapy. J Comput Assist Tomogr 19:635-638
Erbetta A, Ciceri E, Chiapparini L, Botteon G, Erba A, Nardocci N, Savoiardo M (1998) Magnetic resonance imaging findings in bilirubin encephalopathy. Int J Neuroradiol 4:161164
Etsuo I, Shinichi H, Narumi Y, Fujita M, Kuriyama K, Kadota T, Kuroda T (1991) Portal-systemic encephalopathy: presence of basal ganglia lesions with high signal intensity on MR images. Radiology 179:551-555
Fell JME, Reynolds AP, Meadows N, Khan K, Long SG, Quaghe-
M. Castillo
beur G, Taylor WJ, Milla PJ (1996) Manganese toxicity in children receiving long-term parenteral nutrition. Lancet 347:1218-1221
Finelli DA, Tarr RW, Sawyer RN, Horwitz SJ (1994) Deceptively normal MR in early infantile Krabbe disease. AJNR Am J Neuroradiol 15:167-171
Gebarski SS, Gabrielsen TO, Knake JE, Latack JT (1983) Cerebral CT findings in methylmalonic acid propionic acidemas. AJNR Am J Neuroradiol 4:955-957
Geremia GK, Mccluney K, Adler S, Charletta D, Hoile R, Huckman M, Ramsey R (1989) The magnetic-resonance hypointense spine of AIDS. AJNR Am J Neuroradiol 10:880-881
Hald JK, Nakstad PH, Skjeldal, Stromme P (1991) Bilateral arachnoid cysts of the temporal fossa in four children with glutaric aciduria type I. AJNR Am J Neuroradiol 12:407409
Hawkins RA, Mazziotta JC, Phelps ME (1987) Wilson’s disease studied with FDG and positron emission tomography. Neurology 37:1707-1711
Hermann W, Reuter M, Barthel H, Dietrich J, Georgi P, Wagner A (2000) Diagnosis of Hallervorden-Spatz disease using MRI, I-123-beta-CIT-SPECT and I-123-IBZM-SPECT. Eur Neurol 43:187-188
Hittmair K, Wimberger D, Wiesbauer P, Zehetmayer M, Budka H (1994) Early infantile form of Krabbe disease with optic hypertrophy: serial MR examinations and autopsy correlation. AJNR Am J Neuroradiol 15:1454-1458
Ho VB, Fitz CR, Yoder CC, Geyer CA (1993) Resolving MR features in osmotic myelinolysis (central pontine and extrapontine myelinolysis). AJNR Am J Neuroradiol 14:163-167 Inoue Y, Fukuda T, Takashima S, Ochi H, Onoyama Y, Kusuda S, Matsuoka O, Murata R (1983) Adrenoleukodystrophy: new
CT findings. AJNR Am J Neuroradiol 4:951-954
Iwasa M, Kinosada Y, Nakatsuka A, Watanabe S, Adachi Y (1999) Magnetization transfer contrast of various regions of the brain in liver cirrhosis. AJNR Am J Neuroradiol 20:652-654
Jensen ME, Sawyer RW, Braun IF, Rizzo WB (1990) MR Imaging appearance of childhood adrenoleukodystrophy with auditory, visual, and motor pathway involvement. Radiographics 10:53-66
Johnson MA, Desai S, Hugh-Jones K, Starer F (1984) Magnetic resonance imaging of the brain in Hurler syndrome. AJNR Am J Neuroradiol 5:816-819
Kashihara K, Nakashima S, Kohira I, Shohmori T, Fujiwara Y, Kuroda S (1998) Hyperintense basal ganglia on T1-weighted MR images in a patient with central nervous system lupus and chorea. AJNR Am J Neuroradiol 19:284-286
Kim IO, Kim JH, Kim WS, Hwang YS, Yeon KM, Hang MC (1996) Mitochondrial myopathy-encephalopathy-lactic acidosis and strokelike episodes (MELAS) syndrome: CT and MR findings in seven children. AJR 166:641-645
Kim TS, Kim IO, Kim WS, Choi YS, Lee JY, Kim OW, Yeon KM, Kim KJ, Hwang YS (1997) MR of childhood metachromatic leukodystrophy. AJNR Am J Neuroradiol 18:733-738
King AD, Walshe JM, Kendall BE, Chinn RJS, Paley MNJ, Wilkinson ID, Halligan S, Hall-Craggs MA (1996) Cranial MR imaging in Wilson’s disease. AJR 167:1579-1584
Kinnala A, Rikalainen H, Lapinleimu H, Parkkola R, Kormano M, Kero P (1999) Cerebral magnetic resonance imaging and ultrasonography findings after neonatal hypoglycemia. Pediatrics 103:724-729
Korogi Y, Takahashi M, Shinzato J, Sakamoto Y, Mitsuzaki K,

Imaging of Inherited and Acquired Metabolic Brain Disorders
Hirai T, Yoshizumi (1993) MR findings in two presumed cases of mild central pontine myelinolysis.AJNR Am J Neuroradiol 14:651-654
Krieger D,Krieger S,Jansen O,Gass P,Theilmann L,Lichtnecker H (1995) Manganese and chronic hepatic encephalopathy. Lancet 346:270-274
Kumar AJ, Rosenbaum AE, Naidu S, Wener L, Citrin CM, Lindenberg R, Kim WS, Zinreich SJ, Molliver ME, Mayberg HS, Moser HW (1987) Adrenoleukodystrophy: correlating MR imaging with CT. Radiol 165:495-504
Kuwert T, Hefter H, Scholz D, Mitz M, Weiss P, Arendt G et al (1992) Regional cerebral glucose consumption measured by positron emission tomography in patients with Wilson’s disease. Eur J Nucl Med 19:96-101
Lee C, Dineen TE, Brack M, Kirsch JE, Runge VM (1995) The muccopolysaccharidoses: characterization by cranial MR imaging. AJNR Am J Neuroradiol 16:1402-1403
Lee J, Lacomis D, Comu S, Jacobsohn J, Kanal E (1998) Acquired hepatocerebral degeneration: MR and pathologic findings. AJNR Am J Neuroradiol 19:485-487
Loes DJ, Hite S, Moser H, Stillman AE, Shapiro E, Lockman L, Latchaw RE, Krivit W (1994) Adrenoleukodystrophy: a scoring method for brain MR observations. AJNR Am J Neuroradiol 15:1761-1776
Magalhaes ACA, Caramelli P, Menezes JR, Lo LS, Bacheschi LA, Barbosa ER, Rosemberg LA (1994) Wilson’s disease: MRI with clinical correlation. Neuroradiology 36:97-100
McAdams HP, Geyer CA, Done SL, Deigh D, Mitchell M, Ghaed VN (1990) CT and MR imaging of Canavan disease. AJNR Am J Neuroradiol 11:397-399
Medina L, Chi TL, DeVivo DC, Hilal SK (1990) MR findings in patients with subacute necrotizing encephalomyelopathy (Leigh syndrome): correlation with biochemical defect. AJNR Am J Neuroradiol 11:379-384
Melhem ER, Breiter SN, Ulug AM, Raymond GV, Moser HW (1996) Improved tissue characterization in adrenoleukodystrophy using magnetization transfer imaging. AJR 166:689-695
Mirowitz SA, Westrich TJ (1992) Basal ganglial signal intensity alterations: reversal after discontinuation of parenteral manganese administration. Radiology 185:535-536
Okamoto K, Ito J, Furusawa T, Sakai K, Tokiguchi S (1998) Reversible hyperintensity of the anterior pituitary gland on T1-weighted MR images in a patient receiving temporary parenteral nutrition. AJNR Am J Neuroradiol 19:1287-1289 Paltiel HJ, O’Gorman AM, Meagher-Villemure K, Rosenblatt B, Silver K, Watters GV (1987) Subacute necrotizing encephalomyelopathy (Leigh disease): CT study. Radiol-
ogy 162:115-118
Pomier-Layrargues G, Spahr L, Butterworth RF (1995) Increased manganese concentrations in pallidum of cirrhotic patients. Lancet 345:735
Price DB, Kramer J, Hotson GC, Loh JP (1987) Central pontine myelinolysis: report of a case with distinctive appearance on MR imaging. AJNR Am J Neuroradiol 8:576-577
Rajanayagam V, Grad J, Krivit W, Loes DJ, Lockman L, Shapiro E, Balthazor M, Aeppli D, Stillman AE (1996) Proton MR spectroscopy of childhood adrenoleukodystrophy. AJNR Am J Neuroradiol 17:1013-1024
Rajanayagam V, Balthazor M, Shapiro E, Krivit W, Lockman L, Stillman AE (1997) Proton MR spectroscopy and neuropsychological testing in adrenoleukodystrophy. AJNR Am J Neuroradiol 18:1909-1914
193
Rorke L (1998) Neuropathologic findings in bilirubin encephalopathy (Kernicterus). Int J Neuroradiol 4:165-170
Rosenbloom S, Buchholz D, Kumar AJ, Kaplan RA, Moses H 3d, Rosenbaum AE (1984) Evolution of central pontine myelinolysis on CT. AJNR Am J Neuroradiol 5:110-112
Ross BD, Jacobson S, Villamil F, Korula J, Kreis R, Ernst T, Shonk T, Moats RA (1994) Subclinical hepatic encephalopathy: proton MR spectroscopic abnormalities. Radiology 193:457-463
Ruano MM, Castillo M, Thompson JE (1998) MR imaging in a patient with homocystinuria. AJR 171:1147-1149
Shan DE, Ho DMT, Chang C, Pan HC, Teng MMH (1998) Hemi- chorea-hemiballism: an explanation for MR signal changes. AJNR Am J Neuroradiol 19:863-870
Shaw DW, Maravilla KR, Weinberger E, Garretson J, Trahms CM, Scott CR (1991) MR imaging of phenylketonuria.AJNR Am J Neuroradiol 12:403-406
SilversteinAM,Hirsch DK,Trobe JD,Gebarski SS (1990) MR imaging of the brain in five members of a family with PelizaeusMerzbacher disease. AJNR Am J Neuroradiol 11:495-499
Snyder RD, King JN, Keck GM, Orrison WW (1991) MR imaging of the spinal cord in 23 subjects with ALD-AMN complex. AJNR Am J Neuroradiol 12:1095-1098
Spar JA, Lewine JD, Orrison WW Jr (1994) Neonatal hypoglycemia: CT and MR findings. AJNR Am J Neuroradiol 15:1477-1478
Sparacia G, Midiri M, D’Angelo P, Lagalla R (1999) Magnetic resonance imaging of the pituitary gland in patients with secondary hypogonadism due to transfusional hemochromatosis. Magma 8:87-90
Sparacia G, Iaia A, Banco A, D’Angelo P, Lagalla R (2000) Transfusional hemochromatosis: quantitative relation of MR imaging pituitary signal intensity reduction to hypogonadotropic hypogonadism. Radiology 215:818-823
Stillman AE, Krivit W, Shapiro E, Lockman L, Latchaw RE (1994) Serial MR after bone marrow transplantation in two patients with metachromatic leukodystrophy. AJNR Am J Neuroradiol 15:1929-1932
Sztencel J, Baleriaux D, Borenstein S, Brunko E, Zegers de Beyl D (1983) Central pontine myelinolysis: correlation between CT and electrophysiologic data.AJNR Am J Neuroradiol 4:529-530 Van der Knaap MS, Valk J (1989) The reflection of histology in MR imaging of Pelizaeus-Merzbacher disease. AJNR Am J
Neuroradiol 18:99-103
Van der Knaap MS, Breiter SN, Naidu S, Hart AAM, Valk J (1999) Defining and categorizing leukoencephalopathies of unknown origin: MR imaging approach. Radiology 213:121-133
Van der Knaap MS, Naidu S, Breiter SN et al (2001) Alexander disease: diagnosis with MR imaging. AJNR Am J Neuroradiol 22:541-552
Van Wassenaer-van Hall HN, van den Heuvel AG, Algra A, Hoogenraad TU, Mali WPTM (1996) Wilson disease: findings at MR imaging and CT of the brain with clinical correlation. Radiology 198:531-536
Vanhanen SL, Raininko R, Santavuori P (1994) Early differential diagnosis of infantile neuronal ceroid lipofuscinosis, Rett syndrome, and Krabbe disease by CT and MR. AJNR Am J Neuroradiol 15:1443-1453
Wetzburger CL, Van Regemorter N, Szliwowski HB, Abramowicz MJ, van Bogaert P (1998) Gray matter heterotopia and acute necrotizing encephalopathy in trichothiodystrophy.
Pediatr Neurol 19:392-394

Proton MR Spectroscopy in Metabolic Disorders of the Central Nervous System |
195 |
13Proton MR Spectroscopy in Metabolic Disorders of the Central Nervous System
Nicola De Stefano and Marzia Mortilla
CONTENTS
13.1Introduction 195
13.2Proton MRS Changes in Demyelinating and Dysmyelinating Diseases 195
13.3Diagnostic-Specific MRS Changes
|
in WM Disorders 199 |
13.4 |
Metabolic Changes Beyond MRI Lesions 202 |
13.5Conclusions 206 References 206
13.1 Introduction
The advent of magnetic resonance (MR) imaging (MRI) has revolutionized the clinical approach to the evaluation of the metabolic disorders affecting the cerebral white matter and has contributed significantly to the expansion of these diseases. The clinical importance of MRI in the management of patients with metabolic disorders lies in its great sensitivity for detecting brain white matter lesions. However, in these disorders the detected lesions can be due to a variety of pathological processes and can be associated with many different types of myelin abnormality (demyelinization, hypomyelinization, myelin rarefaction, etc.) (Kolodny 1993).
On clinical grounds, the diagnostic work-up of a given metabolic disease is particularly challenging. This is due to both extreme variability of the clinical picture and heterogeneity of the underlying pathology. Unfortunately, the white matter lesions detected on MRI are often not characteristic enough to allow the diagnosis of these complex disorders (van der Knaap et al. 1991). Lack of specificity of conventional MRI and its limitations in analyzing the nature of the lesions can account, at least in part, for the significant amount of patients with focal or diffuse white matter
N. De Stefano, MD, PhD
Associate Professor, Department of Neurology and Behavioral Sciences, University of Siena, Viale Bracci 2, 53100 Siena, Italy M. Mortilla, MD
Department of Radiology, Children Hospital Anna Meyer, Florence, Italy
pathology that cannot fit the criteria for any defined disorder (van der Knaap et al. 1991; Schiffmann and van der Knaap 2004).
In recent years, nonconventional MR techniques have been used to complement conventional MRI and overcome some of its limitations. Among these, MR spectroscopy (MRS) techniques have proven to offer additional information and have been particularly useful in patients with metabolic disorders as they can simultaneously provide chemical-pathological correlates of changes occurring within and outside visible MRI lesions. Thus, an expanding number of research groups have been using single-voxel proton MRS and multivoxel MR spectroscopic imaging (MRSI) in vivo to study patients with metabolic disorders involving the cerebral white matter (Arnold and Matthews 1996; de Stefano et al. 2000b; van der Knaap 2001). These MRS techniques have demonstrated to increase diagnostic accuracy and the understanding of the evolution of pathology in many leukoencephalopathies. However, the increasing use of proton MRS techniques in white matter diseases also has revealed that most of the metabolic changes detected in these disorders are not disease-specific.
Metabolic changes of several white matter pathologies as detected by proton MRS techniques and their clinical interpretation are reported below. As mentioned before, the group of white matter diseases with inherited or acquired metabolic abnormalities is very heterogeneous and includes pathologies with different pathogenesis. Here, we will simply give an overview on MRS changes of the most frequently studied metabolic disorders affecting the cerebral white matter.
13.2
Proton MRS Changes in Demyelinating and Dysmyelinating Diseases
Myelinogenesis is a complex process that can be altered by various hereditary metabolic defects result-
196 |
N. De Stefano and M. Mortilla |
ing in disorders that are generically grouped under the term of leukodystrophies. This congenital failure in myelinogenesis is comprehensive of several mechanisms of myelin disruption such as hypomyelination, demyelination, myelin rarefaction, etc., and is due to very different genetic and biochemical abnormalities, most of which are still undefined (Kolodny 1993).
Proton MR spectra of the normal human brain at long echo time reveal four major resonances: a large signal from N-acetyl groups [mainly N-acetyl aspartate (NAA)], a smaller resonance from cholinecontaining phospholipids (Cho), a resonance from creatine and phosphocreatine (Cr), and a doublet from lactate (Lac) (Arnold and Matthews 1996). Excellent spectra also can be obtained using short echo time measurements, which allow the detection of a greater number of metabolites [including lipids
and myo-inositol (mI)] (Arnold and Matthews 1996).
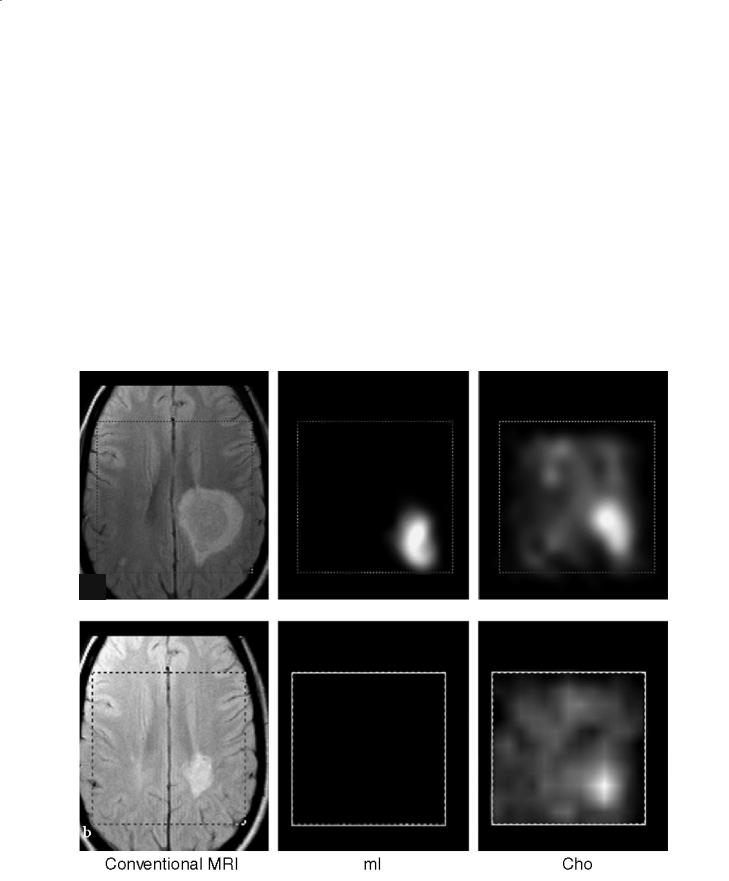
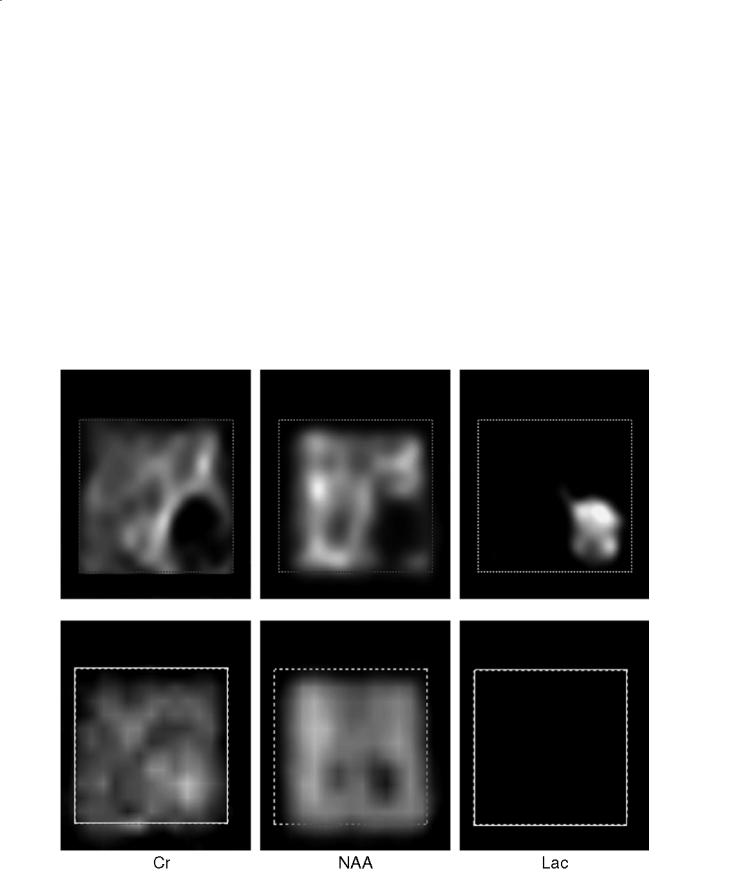
Changes in all of these metabolites can be seen within demyelinating lesions since the very early phase of the pathological process (de Stefano et al. 1995a) (Fig. 13.1a). Changes in the resonance intensity of Cho result mainly from increases in the steady state levels of phosphocholine and glycerolphosphocholine, both membrane phospholipids released during active myelin breakdown. Increases in Lac are likely to reflect the metabolism of inflammatory cells. In large, acute demyelinating lesions, decreases in Cr can also be seen (de Stefano et al. 1995a). Short echo time spectra give evidence for transient increases in mI (Koopmans et al. 1993) and lipids (Narayana et al. 1998), also released during myelin breakdown.
a
|
|
b |
Fig. 13.1a,b. Conventional brain MRI in transversal orientation and spectroscopic images of myo-inositol (mI), choline (Cho), creatine (Cr), N-acetylaspartate (NAA) and lactate (Lac) of a patient with a single giant demyelinating lesion during acute (a) and chronic (b) stages. a During the acute stage, images of the different metabolites show focal increases in mI, Cho and Lac and
Proton MR Spectroscopy in Metabolic Disorders of the Central Nervous System |
197 |
After the acute phase, metabolic modifications in the demyelinating lesion show a variable time course (de Stefano et al. 1995a) (Fig. 13.1b). Usually, resonance intensities of Cr and lipids return to normal within a few days. At this stage, small changes in Cr, due to changes in cellularity, can be found inside the demyelinating lesion (Davies et al. 1995). Resonance intensities of Lac show a progressive reduction over a period of weeks, whereas Cho and mI return to normal in months. The signal intensity of NAA remains decreased or may show a partial recovery (de Stefano et al. 1995b). Recovery of NAA may be related to resolution of edema, increases in the diameter of previously shrunken axons that are secondary to remyelination and clearance of inflammatory factors, and reversible metabolic changes in neurons (de Stefano et al. 1995b).
In slowly progressive disorders, such as many leukodystrophies, the loss of myelin can be very slow and released membrane phospholipids might not accumulate. Thus, MRS changes such as those detected in acute demyelination are not seen. In some cases, however, (i.e., adrenoleukodystrophy, Krabbe disease) the high membrane turnover may cause longterm increases in Cho (Kruse et al. 1993; de Stefano et al. 2000a). In contrast, a decrease in Cho that is secondary to hypomyelination or vacuolar myelinopathy can be detected in spongiform leukoencephalopathies (van der Knaap et al. 1995, 1997; Austin et al. 1991; Grodd et al. 1990) or mitochondrial disorders (Matthews et al. 1993).
A number of brain MRS studies of patients with white matter disorders have also shown changes in the relative resonance intensity of mI. The function
decreases in NAA and Cr that co-localize with the MRI lesion. b The examination performed 15 months later shows a reduction of the MRI lesion and normalization of mI, Cho, Cr and Lac metabolic images. NAA shows a partial recovery
198
a
N. De Stefano and M. Mortilla
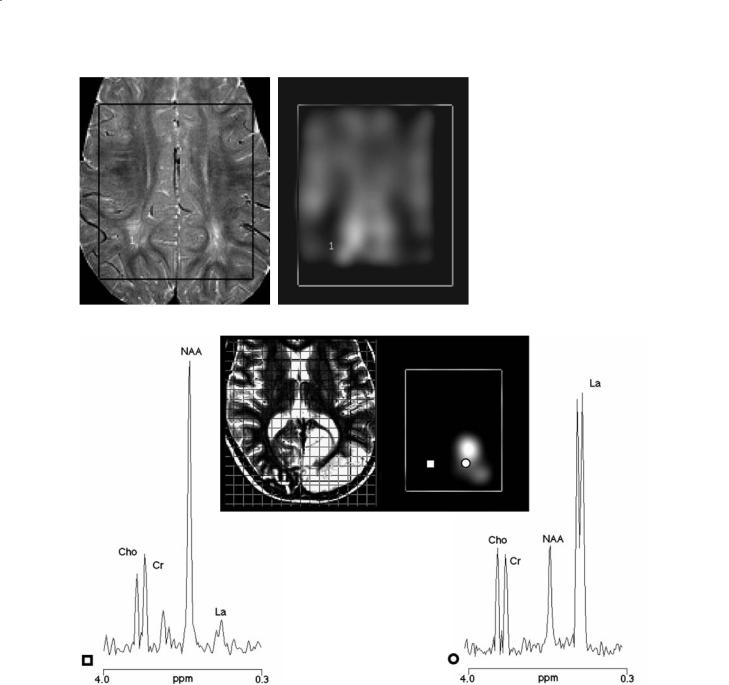
Fig. 13.2a,b. Conventional brain MRI in transversal orientation (a) and spectroscopic image of N-acetylaspartate (NAA) (b) of a patient with unknown leukoencephalopathy. The volume of interest of the multivoxel spectroscopic examination is shown in both images. In the metabolic image of NAA (b), note the decreases of the metabolite co-local- ized (1) with the white matter abnormalities on conventional MRI
b
Fig. 13.3. Conventional brain MRI in transversal orientation (central-left panel) and spectroscopic image of lactate (La) relative to a patient with mitochondrial encephalopathy with lactic acidosis and stroke-like episodes during an acute attack of the disease (central-right panel). The grid of the spectroscopic volume of interest is shown in the transverse MRI. The conventional MR image shows the hyperintense signal in the right occipital region due to the recent stroke-like episode. Proton spectra from a voxel localized in the stroke-like region (circle) and in a homologous voxel of the contralateral hemisphere are also shown (square). The proton spectrum from a voxel localized to the stroke-like region shows a large decrease in N-acetylaspartate (NAA) and a striking increase in lactate. These changes are not found in the homologous voxel of the contralateral hemisphere
of mI in the human brain is not clear, but increases of this metabolite seem to be related to the presence of white matter gliosis and appear consistently in disorders associated with impaired myelination such as adrenoleukodystrophy, metachromatic leukodystrophies, phenylketonuria and Zellweger syndrome
(Bruhn et al. 1992; Johannik et al. 1994; Kruse et al. 1993; Tzika et al. 1993).
Finally, a constant finding of all metabolic disorders affecting the brain white matter is the large decrease in cerebral NAA (de Stefano et al. 2000b) (Fig. 13.2).As NAA is found almost exclusively in neu-