

Книги по МРТ КТ на английском языке / MR Imaging in White Matter Diseases of the Brain and Spinal Cord - K Sartor Massimo Filippi Nicola De Stefano Vincent Dou
.pdf146 |
A. Kangarlu |
affinity for pathologic cells, MI appears to be poised to add a powerful tool to our diagnostic capabilities. The 8-T MR images have shown histologic quality. These images possess ultra-high resolution capable of visualizing microanatomic details. MI is capable of monitoring the cell trafficking. With regard to MS etiology, this aspect of MI offers the ability of directing cells to a specific target in the body. A wide range of cellular processes such as macrophage infiltration into CNS, leukocyte role in inflammatory diseases, and hematopoietic stem cell targeting have and will become available for imaging. These novel imaging strategies may provide methods for detecting early inflammatory events, at the cellular level, before the consequences of inflammation become macroscopically detectable by traditional imaging techniques. This would amount to a strategic transition in diagnostic imaging modalities. Such a transition could usher in the era of a functional and physiological approach versus the present conventional anatomic approach.
On another front, the need for possible extrapolation of animal results to human subjects necessitates that all possible enhancements that could be achieved be exploited in human scanners as well. Currently, whole body research scanners operate at 9.4 T. There are plans for construction of a few neuroimaging centers equipped with 3-T, 7-T, 9.4-T and 11.7-T MR systems for human clinical trials. Other scanners include 11.7-T and 14-T units for primate studies, and an up to 17-T MR scanner for rodent studies. Imaging centers are growing in number and size. Centers typically have 30–50 members, with some larger MR research units employing up to 200 researchers. The prospect of fruitful research in MR, and particularly in active areas such as MI, has brought biologists, physicists, engineers, and chemists into collaborative projects. These multidisciplinary efforts have given rise to innovative techniques such as MI. With higher field strength and more complex imaging techniques it is inevitable that targeted MR MI will accelerate its expansion to other areas of in vivo physiology imaging. MI is not restricted by the same limitations as other functional imaging techniques. The ability to probe cellular events and monitor their spatiotemporal evolution unrestricted by the time frame of fMRI is looming in many laboratories.
References
Ahrens ET, Laidlaw DH, Readhead C, Brosnan CF, Fraser SE, Jacobs RE (1998) MR microscopy of transgenic mice that spontaneously acquire EAE. Magn Reson Med 40:119
Allen MJ, MacRenaris KW, Venkatasubramanian PN, Meade TJ (2004)Cellular delivery of MRI contrast agents. Chem Biol 11:301-307
Alvord EC Jr, Kies MW, Suckling AJ (1984) Experimental encephalomyelitis: a useful model for multiple sclerosis. Liss, New York
Anderson SA, Shukaliak-Quandt J, Jordan EK, Arbab AS, Martin R, McFarland H, Frank JA (2004) Magnetic resonance imaging of labeled T-cells in a mouse model of multiple sclerosis. Ann Neurol 55:654-659
Arbab AS, Yocum GT, Kalish H, Jordan EK, Anderson SA, Khakoo AY, Read EJ, Frank JA (2004) Efficient magnetic cell labeling with protamine sulfate complexed to ferumoxides for cellular MRI. Blood 104:1217-1223
Arnold DL (1999) Magnetic resonance spectroscopy: imaging axonal damage in MS. J Neuroimmunol 98:2-6
Artemov D, Mori N, Okollie B, Bhujwalla ZM (2003) MR molecular imaging of the Her-2/neu receptor in breast cancer cells using targeted iron oxide nanoparticles. Magn Reson Med 49:403-408
Basser PJ, Pierpaoli C (1996) Microstructural features measured using diffusion tensor imaging. J Magn Reson B 111:209-219
Beckmann N, Falk R, Zurbrugg S, Dawson J, Engelhardt P (2003) Macrophage infiltration into the rat knee detected by MRI in a model of antigen-induced arthritis. Magn Reson Med 49:1047-1055
Bendszus M, Stoll G (2003) Caught in the act: in vivo mapping of macrophage infiltration in nerve injury by magnetic resonance imaging. J Neurosci 23:10892-10896
Bogdanov A Jr, Matuszewski L, Bremer C, Petrovsky A, Weissleder R (2002) Oligomerization of paramagnetic substrates result in signal amplification and can be used for MR imaging of molecular targets. Mol Imaging 1:16-23
Bourekas EC, Christoforidis GA, Abduljalil AM, Kangarlu A, Chakeres DW, Spigos DG, Robitaille PM (1999) High resolution MRI of the deep gray nuclei at 8 tesla. J Comput Assist Tomogr 23:867-874
Bulte JW, Arbab AS, Douglas T, Frank JA (2004) Preparation of magnetically labeled cells for cell tracking by magnetic resonance imaging. Methods Enzymol 386:275-299
Burgess RE, Yu Y, Christoforidis GA, Bourekas EC, Chakeres DW, Spigos D, Kangarlu A, Abduljalil AM, Robitaille PM (1999) Human leptomeningeal and cortical vascular anatomy of the cerebral cortex at 8 Tesla. J Comput Assist Tomogr 23:850-856
Cercignani M, Inglese M, Pagani E, Comi G, Filippi M (2001) Mean diffusivity and fractional anisotropy histograms of patients with multiple sclerosis. AJNR Am J Neuroradiol 22:952-958
Chen CN, Sank VJ, Cohen SM, Hoult DI (1986) The field dependence of NMR imaging. I. Laboratory assessment of signal-to-noise ratio and power deposition. Magn Reson Med 3:722-729
Chronik BA, Alejski A, Rutt BK (2000) Design and fabrication of a three-axis edge ROU head and neck gradient coil. Magn Reson Med 44:955-963
Collins CM, Smith MB (2001) Signal-to-noise ratio and

Molecular Imaging and High-Field MRI in Multiple Sclerosis
absorbed power as functions of main magnetic field strength, and definition of “90°” RF pulse for the head in the birdcage coil. Magn Reson Med 45:684-691
Corot C, Petry KG, Trivedi R, Saleh A, Jonkmanns C, Le Bas JF, Blezer E, Rausch M, Brochet B, Foster-Gareau P, Baleriaux D, Gaillard S, Dousset V (2004) Macrophage imaging in central nervous system and in carotid atherosclerotic plaque using ultrasmall superparamagnetic iron oxide in magnetic resonance imaging. Invest Radiol 39:619-625
Davie CA, Barker GJ, Thompson AJ, Tofts PS, McDonald WI, Miller DH (1997) 1H magnetic resonance spectroscopy of chronic cerebral white matter lesions and normal appearing white matter in multiple sclerosis, J Neurol Neurosurg Psychiatry 63:736-742
De Laquintane BD, Dousset V, Solanilla A, Petry KG, Ripoche J (2002) Iron particle labeling of haematopoietic progenitor cells: an in vitro study. Biosci Rep 22:549-554
De Stefano N, Narayanan S, Matthews PM, Francis GS, Antel JP, Arnold DL (1999) In vivo evidence for axonal dysfunction remote from focal cerebral demyelination of the type seen in multiple sclerosis. Brain 122:1933-1939
Dousset V, Ballarino L, Delalande C, Coussemacq M, Canioni P, Petry KG, Caille JM (1999) Comparison of ultrasmall particles of iron oxide (USPIO)-enhanced T2-weighted, conventional T2-weighted, and gadolinium-enhanced T1weighted MR images in rats with experimental autoimmune encephalomyelitis. AJNR Am J Neuroradiol 20:223-227
Duewell S, Wolff SD, Wen H, Balaban RS, Jezzard P (1996) MR imaging contrast in human brain tissue: assessment and optimization at 4 T. Radiology 199:780-786
Filippi, M, Tortorella C, Rovaris M, Bozzali M, Possa F, Sormani M P, Iannucci G, Comi G (2000) Changes in the normal appearing brain tissue and cognitive impairment in multiple sclerosis. J Neurol Neurosurg Psychiatry 68:157-161
Floris S, Blezer EL, Schreibelt G, Dopp E, van der Pol SM, Schadee-Eestermans IL, Nicolay K, Dijkstra CD, de Vries HE (2004) Blood-brain barrier permeability and monocyte infiltration in experimental allergic encephalomyelitis: a quantitative MRI study. Brain 127:616-627
Floyd E, McShane TM (2004) Development and use of biomarkers in oncology drug development. Toxicol Pathol 32 [Suppl 1]:106-115
Frank JA, Zywicke H, Jordan EK, Mitchell J, Lewis BK, Miller B, Bryant LH Jr, Bulte JWM (2002) Magnetic intracellular labeling of mammalian cells by combining (FDA-approved) superparamagnetic iron oxide MR contrast agents and commonly used transfection agents. Acad Radiol 9 [Suppl 2]:S484-S487
Gandhi OP, Hagmann MJ, D’Andrea JA (1979) Partbody and multibody effects on absorption of radio frequency electromagnetic energy by animals and by models of man. Radio Sci 14:15-22
Gillis RJ (2002) In vivo molecular imaging. J Cell Biochem [Suppl] 39:231-238
Glover GH (1999) 3D z-shim method for reduction of susceptibility effects in BOLD fMRI 3D z-shim method for reduction of susceptibility effects in BOLD fMRI. Magn Reson Med 42:290-299
Griswold MA, Jakob PM, Nittka M, Goldfarb JW, Haase A (2000) Partially parallel imaging with localized sensitivities (PILS). Magn Reson Med 44:602-609
Grossman RI, McGowan JC (1998) Perspectives on multiple sclerosis. AJNR Am J Neuroradiol 19:1251-1265
147
Gutin PH (2002) The potential value of iron oxide nanoparticles in brain tumor treatment. AJNR Am J Neuroradiol 23:505
Hayes CE, Edelstein WA, Schenk JF, Mueller OM, Eash M (1985) An efficient, highly homogeneous radiofrequency coil for whole-body NMR imaging at 1.5T. J Magn Reson 63:622628
Helms G, Stawiarz L, Kivisakk P, Fredrikson S, Hillert J, Link H (1999) Quantitative proton MRS of cerebral multiple sclerosis lesions: regression analysis of metabolite concentrations. Proceedings of International Society of Magnetic Resonance in Medicine , Philadelphia, p 43
Horsfield MA, Rocca MA, Cercignani M, Filippi M (2000) Activity revealed in MRI of multiple sclerosis without contrast agent - a preliminary report. Magn Reson Imaging 18:139-142
Kangarlu A, Robitaille PM (2000) Biological effects and health implications in magnetic resonance imaging. Concept Magn Reson 12:321-359
Kangarlu A, Abduljalil AM, Norris DG, Schwartzbauer C, Robitaille PM (1999) Human RARE imaging at 8 tesla:RF intense imaging without SAR violation. Magn Reson Mater Phys Biol Med (MAGMA) 9:81-84
Kangarlu A, Rammohan KW, Bourekas EC, Chakeres DW (2002) In-vivo microscopic imaging of multiple sclerosis with high filed MRI. In: Filippi M, Comi G (eds) New frontiers of MR-based techniques in MS. Springer, Berlin Heidelberg New York
Kangarlu A, Rammohan KW, Bourekas EC, RayChaudhry A (2004) Imaging of cortical lesions in multiple sclerosis. Proceedings of 12th Meeting of the International Society of Magnetic Resonance in Medicine, Kyoto
Kawczak JA, Mathisen PM, Drazba JA, Fuss B, Macklin WB, Tuohy VK (1998) Digitized image analysis reveals diffuse abnormalities in normal-appearing white matter during acute experimental autoimmune encephalomyelitis. J Neurosci Res 54:364-372
Kidd D, Barkhof F, McConnell R, Algra PR, Allen IV, Revesz T (1999) Cortical lesions in multiple sclerosis. Brain 122:1726
Lanens D, Van der Linden A, Gerrits PO, ‘s-Gravenmade EJ (1994) In vitro NMR micro imaging of the spinal cord of chronic relapsing EAE rats. Magn Reson Imaging 12:469
Lassmann H, Raine CS, Antel J, Prineas JW (1998) Immunopathology of multiple sclerosis: report on an international meeting held at the Institute of Neurology of the University of Vienna. J Neuroimmunol 86:213-217
Leary SM, Silver NC, Stevenson VL, Barker GJ, Miller DH, Thompson AJ (1999) Magnetization transfer of normal appearing white matter in primary progressive multiple sclerosis. Multiple Sclerosis 5:313-316
Li KC, Bednarski MD (2002) Vascular-targeted molecular imaging using functionalized polymerized vesicles. J Magn Reson Imaging 16:388-393
Luker GD, Sharma V, Pica CM, Dahlheimer JL, Li W, Ochesky J, Ryan CE, Piwnica-Worms H, Piwnica-Worms D (2002) Noninvasive imaging of protein-protein interactions in living animals. Proc Natl Acad Sci USA 99:6961-6966
Lumsden CE (1970) The neuropathology of multiple sclerosis: multiple sclerosis and other demyelinating diseases. In: Vinken P, Bruyn GW (eds) Handbook of clinical neurology, vol 9. North Holland, Amsterdam, pp 217-309
Moffat BA, Reddy GR, McConville P, Hall DE, Chenevert TL,

148
Kopelman RR, Philbert M, Weissleder R, Rehemtulla A, Ross BD (2003) A novel polyacrylamide magnetic nanoparticle contrast agent for molecular imaging using MRI. Mol Imaging 2:324-232
Moore A, Basilion J, Chiocca AE, Weissleder R (1998) Measuring transferin receptor gene expression by NMR imaging. Biochim Biophys Acta 1402:239-249
Morawski AM,Winter PM,Crowder KC,Caruthers SD,Fuhrhop RW, Scott MJ, Robertson JD, Abendschein DR, Lanza GM, Wickline SA (2004) Targeted nanoparticles for quantitative imaging of sparse molecular epitopes with MRI. Magn Reson Med 51:480-486
Norris DG, Kangarlu A, Abduljalil A, Schwartzbauer C, Robitaille PM (1999) Human MDEFT imaging at 8 tesla. Magn Reson Mater Phys Biol Med (MAGMA) 9:92-96
Oweida AJ, Dunn EA, Foster PJ (2004) Cellular imaging at 1.5 T: detecting cells in neuroinflammation using active labeling with superparamagnetic iron oxide. Mol Imaging 3:85-95
Pan JW, Hetherington HP, Vaughan JT, Mitchell G, Pohost GM, Whitaker JN (1996) Evaluation of multiple sclerosis by 1H spectroscopic imaging at 4.1 T. Magn Reson Med 36:72-77 Pirko I, Johnson A, Ciric B, Gamez J, Macura SI, Pease LR, Rodriguez M (2004) In vivo magnetic resonance imaging of immune cells in the central nervous system with super-
paramagnetic antibodies. FASEB J 18:179-182
Pomper MG (2002) Can small animal imaging accelerate drug development? J Cell Biochem [Suppl] 39:211-220
Pruessmann KP, Weiger M, Scheidegger MB, Boesiger P (1999) SENSE: sensitivity encoding for fast MRI. Magn Reson Med 42:952-962
Rausch M,Hiestand P,Baumann D,Cannet C,Rudin M (2003) MRIbased monitoring of inflammation and tissue damage in acute and chronic relapsing EAE. Magn Reson Med 50:309-314
Ray P, De A, Min JJ, Tsien RY, Gambhir SS (2004) Imaging trifusion multimodality reporter gene expression in living subjects. Cancer Res 64:1323-1330
Reichenbach JR, Essig M, Haacke EM, Lee BC, Przetak C, Kaiser WA, Schad LR (1998) High-resolution venography of the brain using magnetic resonance imaging. Magn Reson Mater Phys Biol Med (MAGMA) 6:62-69
Reichenbach JR, Jonetz-Mentzel L, Fitzek C, Haacke EM, Kido DK, Lee BC, Kaiser WA (2001) High resolution blood oxygen-level dependent MR venography (HRBV): a new technique. Neuroradiology 43:364-369
SchellenbergerEA,BogdanovAJr,HogemannD,TaitJ,Weissleder R, Josephson L (2002) Annexin V-CLIO: a nanoparticle for detecting apoptosis by MRI. Mol Imaging 1:102-107
Schenck JF (2000) Safety of strong, static magnetic fields. Magn Reson Imaging 12:2-19
Shahbazi-Gahrouei D, Williams M, Rizvi S, Allen BJ (2001) In vivo studies of Gd-DTPA-monoclonal antibody and Gdporphyrins: potential magnetic resonance imaging contrast agents for melanoma. J Magn Reson Imaging 14:169-174
Sodickson DK, Manning WJ (1997) Simultaneous acquisition of spatial harmonics (SMASH): fast imaging with radiofrequency coil arrays. Magn Reson Med 38:591-603
A. Kangarlu
Stoll G, Wesemeier C, Gold R, Solymosi L, Toyka KV, Bendszus M (2004) In vivo monitoring of macrophage infiltration in experimental autoimmune neuritis by magnetic resonance imaging. J Neuroimmunol 149:142-146
‘t Hart BA, Vogels J, Bauer J, Brok HP, Blezer E (2004) Noninvasive measurement of brain damage in a primate model of multiple sclerosis. Trends Mol Med 10:85-91
Thulborn KR, Waterton JC, Matthews PM, Radda GK (1982) Oxygenation dependence of the transverse relaxation time of water protons in whole blood at high field. Biochim Biophys Acta 714:265-270
Trapp BD, Bo L, Mork S, Chang A (1999) Pathogenesis of tissue injury in MS lesions. J Neuroimmunol 98:49-56
Tropres I, Lamalle L, Peoc’h M, Farion R, Usson Y, Decorps M, Remy C (2004) In vivo assessment of tumoral angiogenesis. Magn Reson Med 51:533-541
Ugurbil K, Garwood M, Ellermann J, Hendrich K, Hinke R, Hu X, Kim SG, Menon R, Merkle H, Ogawa S et al (1993) Imaging at high magnetic fields: initial experiences at 4 T. Magn Reson Q 9:259-277
Ugurbil K, Hu X, Chen W, Zhu X-H, Kim S-G, Georgopoulos A (1999) Functional mapping in the human brain using high magnetic fields. Philos Trans R Soc Lond B Biol Sci 354:1195-1213
Ugurbil K, Adriany G, Andersen P, Chen W, Garwood M, Gruetter R, Henry P, Kim SG, Lieu H, Tkac I, Vaughan T, van de Moortele PF,Yacoub E, Zhu XH (2003) Ultrahigh field magnetic resonance imaging and spectroscopy. Magn Reson Imaging 21:1263-1281
Vymazal J, Brooks RA, Baumgarner C, Tran V, Katz D, Bulte JW, Bauminger R, di Chiro G (1996) The relation between brain iron and NMR relaxation times: an in vitro study. Magn Reson Med 35:56-61
Weissleder R (2002) Scaling down imaging: molecular mapping of cancer in mice. Nat Rev Cancer 2:11-18
Weissleder R, Elizondo G, Wittenberg J, Rabito CA, Bengele HH, Josephson L (1990) Ultrasmall superparamagnetic iron oxide: characterization of a new class of contrast agents for MR imaging. Radiology 175:489-493
Wood JC, Fassler JD, Meade T (2004) Mimicking liver iron overload using liposomal ferritin preparations. Magn Reson Med 51:607-611
Xu S, Jordan EK, Brocke S, Bulte JW, Quigley L, Tresser N, Ostuni JL, Yang Y, McFarland HF, Frank JA (1998) Study of relapsing-remitting experimental allergic encephalomyelitis SJL mouse model using MION-46L enhanced in vivo MRI: early histopathological correlation. J Neurosci Res 52:549-558
Yang QX, Smith MB, Briggs RW, Rycyna RE (1999) Microimaging at 14 tesla using GESEPI for removal of magnetic susceptibility artifacts in T2*-weighted image contrast. J Magn Reson 141:1-6
Zelivyanskaya ML, Nelson JA, Poluektova L, Uberti M, Mellon M, Gendelman HE, Boska MD (2003) Tracking superparamagnetic iron oxide labeled monocytes in brain by highfield magnetic resonance imaging. J Neurosci Res 73:284295

MR Imaging of Brain Development |
149 |
Disorders of Myelination

MR Imaging of Brain Development |
151 |
11 MR Imaging of Brain Development
Charles Raybaud
CONTENTS |
|
|
11.1 |
The Factors of Early Brain Development |
151 |
11.1.1 |
The Morphological Changes 151 |
|
11.1.2 |
The Internal Appearance 152 |
|
11.2 |
MR Imaging: Technical Considerations |
154 |
11.2.1Problems in Imaging Infants
(Premature or Term-Born) 154
11.2.2Limits of MR Imaging of the Developing Brain 156
11.2.3 |
Special Problems of MR Imaging in Fetuses 156 |
11.3MR Imaging of the Brain in Fetuses and Prematures 157
11.1
The Factors of Early Brain Development
The brain development corresponds to morphological and maturational changes, which result from the histogenesis, synaptogenesis and myelination.
11.1.1
The Morphological Changes
11.3.1Gross Morphology of the Fetal and Premature The morphological changes include two main phe-
Brain 157
11.3.2The Intrinsic Anatomy of the Fetal
and Premature Brain 159
11.4MR Imaging of the Brain in Term-Born Infants 163
11.4.1 The Brain at Term 163
11.4.1.1T1 Imaging 163
11.4.1.2T2 Imaging 165
11.4.2 The Brain at 4 Months 165
11.4.2.1T1 Imaging 165
11.4.2.2T2 Imaging 168
11.4.3 The Brain from 8 to 12 Months 168
11.4.3.1T1 Imaging 168
11.4.3.2T2 Imaging 168
11.4.4 The Brain at 18–24 Months 168
11.5MR Morphometry, Diffusion, and Spectroscopy 168
11.5.1Morphometry 168
11.5.2Diffusion Imaging 169
11.5.3Spectroscopy 171
11.6 |
Imaging, Development, and Brain Disease 171 |
11.6.1 |
The Early Gross Brain Malformations 171 |
11.6.2 |
The Malformations of Cortical Development 172 |
11.6.3Destructive Lesions and the Developing Brain 172
11.7Conclusions 173 References 173
C. Raybaud, MD FRCPC
Division Head of Neuroradiology, The Hospital for Sick Children, 555 University Avenue, Toronto, Ontario, Canada M5G 1X8
nomena: the first one is the global process leading the neuroepithelium from the embryonal epiblast to an essentially recognizable brain; the second consists of the cellular development and organization, with the changes in brain weight and surface configuration (that is the developing sulcation).
The steps leading from the midline epiblast to the central nervous system (embryonic period) are outside the scope of this chapter. Briefly, they include the neurulation (differentiation of the neuroectoderm, and formation of the neural tube), the formation of the cerebral vesicles with the specific development of the anterior neural plate (forebrain) and of the rhombencephalon (hindbrain), the opening of the 4th ventricle together with the formation of the leptomeninges and of the dura. From the end (week 7) of the embryonic period, the neuroepithelial cells proliferate and, till midgestation (week 20), build up the cerebral cortex together with the telencephalic commissures. This cellular proliferation, along with migration and differentiation, accounts for the increase in brain weight during the embryonic and early fetal stages.
During the second half of gestation, the neuronal migration is achieved, and a significant number (30%–50%) of neurons are actually bound to disappear by apoptosis, as part of the organization of the brain. From then on, and during infancy, the cortical synaptogenesis develops tremendously, peaking at 2 years (Huttenlocher 1990),with the concomitant development of the fiber network, the increase of the

152 |
C. Raybaud |
metabolic activity that becomes mostly aerobic (and is therefore accompanied with an increase of the vascularity), the enormous development of the supporting cells, mostly the astrocytes, and of course, mostly after birth but beginning already in the fetus,the mass production of myelin by the oligodendrocytes. While the brain weighs approximately 80 g at 20 weeks of gestation, it weighs 350 g at birth at 40 weeks (a fourfold increase in 4.5 months), 1000 g at 1 year (threefold increase in 12 months), and 1400 g at 18 years (40% increase in nearly two decades). This early increase in volume concerns the cortex more than the subcortical white matter (Hüppi et al. 1998a), with an important tangential growth of the cortical plate, at least in the higher mammals, and therefore a cortical folding resulting in the species-specific sulcal/gyral pattern.
11.1.2
The Internal Appearance
The internal appearance of the parenchyma (that is the tissular organization of the cellular layers within the cortical mantle) also evolves according to the stages of histogenesis (Fees-Higgins and Larroche 1987), mostly during the fetal period and the first 2 post-natal years. The histogenetic processes include the proliferation, the differentiation and the migration of the cells toward their anatomical destination, and their organization.Because myelin is made of lipids, the maturation also leads to a significant change of the physical-chemical composition of the brain: the fatty myelin replaces the water, and some of its components modify the relaxivity of the water protons. The medical consequence of this is that, as MRI reflects the physical-chemical status of the brain, the orderly changes of the maturation will be reflected in the MR images, allowing a direct evaluation of normal development, as well as of the diseases that affect these processes.
All neural cells originate from common neural stem cells. These proliferate in the germinal matrices (McConnell 1995). Two different germinal matrices exist in the cerebral hemispheres (Lavdas et al. 1999; Letinic and Rakic 2001; Nadarajah and
Parnavelas 2002). The germinal matrix of the mantle lines the ventricular wall under the white matter of the hemispheres, lateral to the basal ganglia; it produces the cells for the cortical plate, namely the pyramidal neurons and the astrocytes. The germinal matrix of the ganglionic eminence covers the surface of the basal ganglia; it produces the interneu-
rons for both the cortical plate and the basal ganglia. Seemingly parts of both matrices may produce the oligodendrocytes for the white matter tracts to be myelinated. The germinal matrices are the sites of the cellular proliferation. There are two stages in this proliferation, depending on the type of division (McConnell 1995; Rakic 1995). The initial one is the stage of symmetrical division, in which a stem cell produces two identical stem cells. The second stage is of asymmetrical division, in which a stem cell produces another stem cell and a differentiated cell. The number of division cycles probably accounts for the differences of neural development between lower and higher mammals (Rakic 1995; Caviness et al. 1995). It is estimated that there are approximately 30– 35 cycles of divisions in the primates, against 7–11 in the rodents. If one cycle fails, the pool of brain cells is theoretically cut by 50%. In the very early stage of development, the germinal matrix of the mantle produces early, transient neurons to form a primary cortical preplate (or plexiform layer), which serves as an organizer for the coming cortical plate (Meyer et al. 2000; Xie et al. 2002).
There are basically four types of brain cells: the pyramidal neurons, the astrocytes, the interneurons and the oligodendrocytes.
The pyramidal neurons represent 80% of the neuronal population of the cortex. They are glutamatergic excitatory cells. They originate from the germinal matrix of the cerebral mantle lateral to the ganglionic eminence, deep to the future white matter. They migrate radially toward the brain surface (Sidman and Rakic 1973), settling within the pre-existing preplate to form the cortical plate (Meyer et al. 2000). In the process, the preplate is split in two layers. The superficial layer forms the (future) molecular layer (or layer 1) with its transient Cajal-Retzius cells (CRCs). The deep layer forms the transient subplate (Kostovic and Rakic 1990) which eventually attenuates during the second half of gestation to disappear about birth. The migration of the pyramidal neurons is conducted by specialized guiding cells, the radial glia (Sidman and Rakic 1973) from which they actually differentiate even during the migration (Tamamaki et al. 2001). This migration process is also under the control of the CRCs (MarinPadilla 1998),which stop the neurons before they reach the brain surface. Therefore, in the successive waves of migration, young neurons pass the older ones to be stopped only before the molecular layer and as a consequence, the oldest neurons

MR Imaging of Brain Development |
153 |
form the deep layers (5 and 6) of the cortex, the youngest ones, the superficial layers (2 and 3): this is called the “inside-out process”. The migration of the forebrain pyramidal neurons continues until mid-gestation (20–23 weeks). After that no neurons are produced in the brain, except in the hippocampal dentate gyrus (granule cells) and in the olfactory bulbs (Barres 1999).
The astrocytes are glial cells. They support the neurons, being interposed between the vessels and the neurons. They also assist the neuronal function, especially in the management of the neurotransmitters. They are initially produced together with the neurons in the germinal matrix of the mantle, and constitute the radial glia which guides the neurons toward the surface. Recent studies have shown that in fact, the neuron is produced by the radial glia and still differentiating while separating from it (Tamamaki et al. 2001). After the end of the neuronal migration, the cells of the radial glial become the cortical astrocytes. Other astrocytes keep being produced by the germinal matrix until it disappears, especially for the superficial cortical layers (Gressens et al. 1992). In contrast with neurons, astrocytes do die and form during the whole life by division of pre-existing astrocytes.
The interneurons are GABAergic inhibitory neurons, making up 20% of the cortical neuronal population. They originate from the germinal matrix of the ganglionic eminence over the future basal ganglia. From there, some migrate toward the cortex, while others move toward the basal ganglia and the thalamus (Lavdas et al. 1999; Zhu et al. 1999; Letinic and Rakic 2001; Nadarajah and
Parnavalas 2002). Their migration to the cortex is not well understood yet.They seem first to follow the fibers toward the cortex, then migrate inward to the germinal matrix of the mantle, where they get “messages” to be assigned a final position into the cortex, which they reach by outward migration.
The oligodendrocytes remain the most mysterious cells of the central nervous system, although they have been extensively studied (Baumann and Pham-Dinh 2001). It is not even clear whether they represent a single or multiple different lineages (Baumann and Pham Dinh 2001). Their best known role is the mass production of myelin, which has been extensively documented (Yakovlev and Lecours 1966; Holms 1986;
Brody et al. 1987; Kinney et al. 1988). Myelin facilitates the conduction of the potentials along
the axons, and the extensive myelination of the white matter is a characteristics of the development of the young brain during the end of gestation and the first years after birth. While the normal turn-over of the myelin components has been evaluated (in the range of several months to a year), the turn-over of the oligodendrocytes themselves is unknown. They seem to originate in restricted ventral or laterobasal areas of the prosencephalon (Bauman and Pham-Dinh 2001). They proliferate (myelination gliosis) and migrate toward the axonal fascicles when they are still in the progenitor stage. As dysmyelinating diseases often present with quite specific fascicular patterns (van der Knaap et al. 1991), it seems likely that the position of the oligodendrocytes is genetically defined.
After completion of the cortical plate, synaptogenesis develops intensively, especially after birth and during the first 2 years of life (Huttenlocher 1990). This means a tremendous expansion of the fibers network, and particularly of the axons. It has been demonstrated that the subplate, the transient subcortical remnant of the primary preplate (Kostovic and Rakic 1990) acts as a waiting zone for the axons approaching the cortex before the cortical organization is ready. This concerns the thalamo-cortical fibers, the association fibers as well as the commissural fi- bers (Kostovic and Rakic 1990; Super et al. 1998). In the hippocampus, this role of waiting zone may be played by the superficial molecular layer (Super et al. 1998). Synaptogenesis induces a significant increase of the needs of oxygen, with the subsequent development of an adapted vascularity (Raybaud 1990) and blood flow. The enormous development of the axons and dendrites, with their species-specific organization and attachments are likely to be responsible for the shaping of a species-specific cortical sulcal/gyral pattern (van Essen 1997). It makes up the white matter, which in mature humans represents 50% of the volume of the hemispheres (this does not take the intracortical fibers into account).
The synaptogenesis is also accompanied by the development of myelination.As stated above, the myelination has been extensively studied over the past decades, histologically and chemically. It develops according to a well defined program, roughly said from the cord to the hemispheres, the sensory structures before the motor before the associative ones (Yakovlev and Lecours 1966), and in the hemisphere, from the back to the front. In fact things are more complex. The primary systems (sensory-motor,

154 |
C. Raybaud |
auditory, visual, and the hippocampi) are myelinated first. In each system, the myelination of the fibers proceeds toward the cortex. The associative areas myelinate last, especially the anterior frontal and the anterior temporal cortices. Central myelination occurs in the portions of the basal ganglia adjacent to the posterior limbs of the internal capsules (PLICs). Together with the brainstem, this area appears already well developed even before birth.
On MR imaging, the demonstration of the myelination processes depends on two phenomena. The first is the depiction of the precursors of myelin. These precursors, cholesterol and specially galactocerebrosides, have a strong magnetization transfer effect (Fralix et al. 1991; Koenig 1991; Kucharczyk et al. 1994), and as such appear early on T1 imaging as a bright signal. The second is the replacement of water by the fatty myelin. The brain of fetus and neonates contains approximately 90% water; in the adult it drops to 70% in the white matter, and to 85% in the cortex after completion of the myelination.As the water is dark on T1 and bright on T2, the myelination reverses the white matter appearance to bright on T1 and dark on T2.
11.2
MR Imaging: Technical Considerations
11.2.1
Problems in Imaging Infants (Premature or Term-Born)
Conventional T1 and T2 sequences are used in neonates as in mature children or adults. T1 imaging includes spin-echo (SE) or gradient-echo (GE) imaging, and T2 imaging, spin-echo (SE) or turbo-spin-echo (TSE) sequences.These are more heavily T2-weighted sequences, and show “more” myelination than standard SE. Inversion-recovery (IR) sequences are heavily T1 weighted and yield superb images of the maturation of the brain (Christophe et al. 1990).
It was observed from the outset that the relaxation times in infants were different from those in adults (Holland et al. 1986); as they are strongly dependent on the stage of the maturation, MR imaging can be used to evaluate the progresses of myelination in normal and diseased brains (Barkovich et al. 1988;
Bird et al. 1989; Christophe et al. 1990; van der Knaap and Valk 1990; Girard et al.1991; Martin et al. 1991; Sie et al. 1997; Barkovich 1998), to a degree
that no other imaging modality had permitted before. This evolving normality should be taken into account to appreciate disease.But another consequence of this maturation process is that in the first months of life, the design of the sequences should be adapted to the physical-chemical status,that is the degree of maturation, of the cerebral tissue. Typically, when designing a T2w SE sequence, the TR is chosen to be three times longer than the calculated T1 in order to eliminate all T1 contamination effect (Kastler et al. 2001). In adults, at 1.5 T, the calculated T1 is approximately 750 ms: the TR of the T2w sequence should therefore be around 2250 ms, with a TE of about 90 ms. In neonates, depending on the part of the brain examined, the calculated T1 is around 3000 ms (personal data); this correlates with the high content of free water. Consequently, the TR of the T2w SE sequence should be set around 10,000 ms. In normal SE sequences, this would lead to too long an acquisition time, but it can be achieved in a couple of minutes with TSE techniques (although TSE yield images slightly different from standard SE, the myelination appearing “more advanced”). Also, as the T2 value is longer in infants than in adults, the TE should be prolonged at 120 ms to obtain as much T2 effect as possible, while keeping enough signal. In a similar way, in a T1w sequence, the TR having only to be maintained below the calculated T1 (Kastler et al.2001),it can be chosen longer for neonates than for mature children, resulting in a better signal-to-noise ratio.
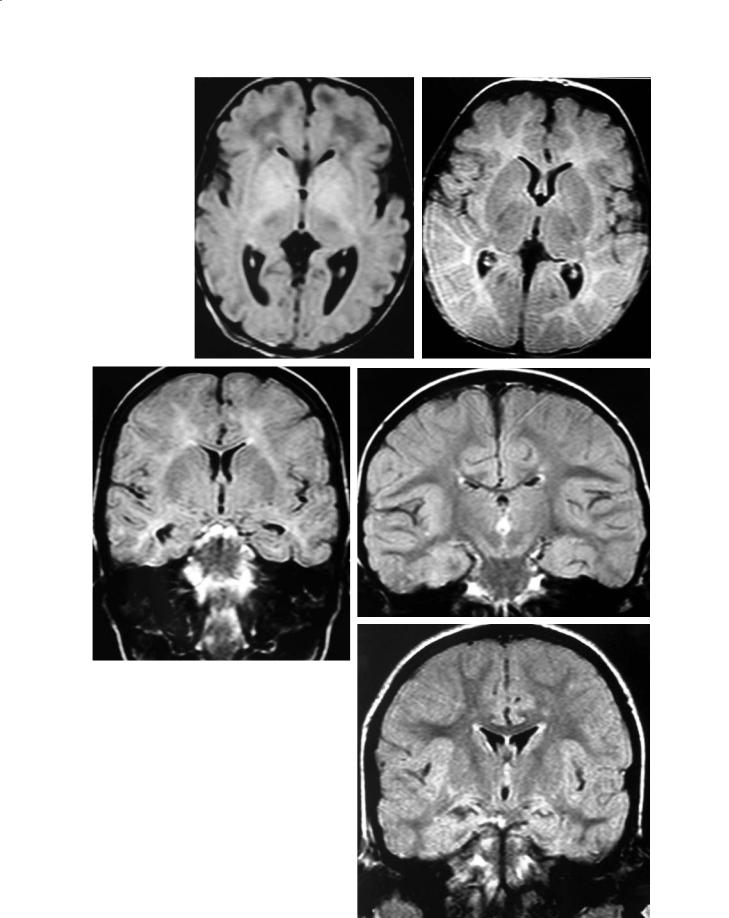
Another sequence routinely used in mature patients is the FLAIR sequence. It is a T2w sequence in which the signal of the free water has been suppressed by a 2200 ms pulse. The FLAIR images seem somewhat confusing in the first months and years (Fig. 11.1), but they can also be understood from the changing composition of the parenchyma (Ashikaga et al. 1999; Murakami et al. 1999). In the heavily hydrated neonatal brain, the signal of the white matter is canceled as well, so that it appears dark, and therefore looks the same as on T1 imaging. But as the myelination proceeds, the signal increases quickly and the white matter becomes fully bright by 4 or 5 months. Later, as on regular T2w images, the signal decreases progressively, but over a much longer span of time (up until 4 years of age).
To summarize, as the different types of sequences represent different factors of the physical-chemical composition of the brain, they evolve at their own pace which does not necessarily reflect the histology. As a consequence, the infantile brain appears mature at about 12 months on T1 images (when the magnetization transfer effect is predominant); at about
MR Imaging of Brain Development |
155 |
a |
b |
|
d |
c |
|
Fig. 11.1a–e. FLAIR imaging. a Neonate. The proportion of wa- |
|
ter is extremely high (90%), and the signal of the white matter |
|
therefore is canceled by the inversion pulse at 2200 ms. As a |
|
consequence, the image looks roughly like a T1 image at the |
|
same age, with the white matter darker than the gray mat- |
|
ter. Yet, the high signal in the basal ganglia is located more |
|
anteriorly than on T1 imaging, and the thalami present with |
|
a low signal related to a more advanced myelination there. b |
|
At 7 months. The myelination process is replacing the water, |
|
and the image looks more like a T2 image, except for the can- |
|
celation of the signal of CSF. Dark signal of the more myelin- |
|
ated PLICs. c At 14 months. The white matter is still globally |
|
brighter than the gray matter. However, maturation is more |
|
advanced in the circumvolutions, and the contrast, therefore, is |
|
now blurred between the cortex and the subjacent white mat- |
|
ter. d At 34 months. Image nearly identical to the adult pattern, |
|
but with persistence of a faintly brighter signal in the centrum |
|
semi-ovale. e At 4 years. The adult pattern, with the white mat- |
e |
ter diffusely darker than the gray matter, is now attained |

156 |
C. Raybaud |
2 years on T2 images (where the loss of signal due to the accumulation of myelin predominates); and at about 4 years on FLAIR images. These three patterns remain consistent in normal patients; they may diverge in disease, and should therefore be read accordingly.
11.2.2
Limits of MR Imaging of the Developing Brain
Even adapted to the developing brain, these approaches present two types of insufficiencies. The first is that the clinical images obtained from MR are not quantitative images similar to those of the X-ray scanner,but images of which the contrast results from the relative signals of the various structures under examination. As each structure matures according to its own timetable and pace, a given one may seem myelinating in the late fetus because nothing else is myelinated, but less myelinated months later because the rest of the brain then becomes more mature more quickly.To compensate for this,semi-quantitative imaging using relaxometry (images made with absolute relaxation time measurements) can be used, but they are time consuming and therefore not ethically acceptable in clinical conditions. Thus the milestones of maturation used by most correspond to patterns produced at a given time by the relative myelination of the most significant structures of the brain (Barkovich et al. 1988; Bird et al. 1989).
The second insufficiency of MR imaging regarding myelination is that it shows a so-called mature pattern while the brain is still developing: one year (T1), two years (T2), four years (FLAIR), whereas we know from histology that the myelination process is not completed until the end of adolescence. This means that a normal mature appearance may correspond to a maturation which is not complete. Sequences sensitive to the late maturational changes have still to be developed and clinically evaluated (Steen et al.1997). Also, the term “myelination delay”, commonly used in clinical practice, should be avoided unless successive studies have shown an improvement. And even if this is the case, the “normal” stage attained may be only the myelination stage of the age of 2 or 4 years.
A last point is important to keep in mind when reading the brain development through the MR signals. This point is that the signal intensity of the brain tissue reflects the myelination in normal subjects only. In a diseased brain, a low T1, high T2 signal may reflect absence of, or poor, myelination, but it may also mean a de-myelination. Beyond the myelination
status, it may express edema, or gliosis, or even a focal dysplasia of the brain tissue.
11.2.3
Special Problems of MR Imaging in Fetuses
Imaging fetuses is possible only at and after midpregnancy. The main reason for this is the size of the fetal brain (approximately 50 mm diameter at that stage), which yields little signal in the abdominal cavity (abdominal volume and especially fat volume) and allows only a poor imaging definition, the size of the voxels being disproportionate to the size of the brain. Another problem, at any time, is motion: the fetus moves with the mother’s organs, following respiration; this effect is diminished when the head is incarcerated in the pelvis. The fetus himself has his/her own motion, as a whole or when sucking, moving limbs, etc. Other motion artifacts result from the moving fluids and gas of the bowels, and from the flowing blood in moving aorta and vena cava. The magnetic field homogeneity is altered, and the signal received from the fetal brain uneven. Sedating the mother (and therefore the fetus) does not seem to improve things significantly, and may be unacceptable for the parents.
Therefore the imaging technique should compensate for these difficulties. Imaging equipment is important, especially the abdominal coil, as much as possible multiple and in phase array, to get a more homogeneous signal. The most dramatic improvement has been brought about by the introduction of ultrafast,“snapshot” single-slice T2 imaging, making it possible to minimize motion effects. Yet this ultrafast imaging,when used post-natally,is of suboptimal quality as compared with the conventional, adapted T2 sequences. But it allows a fairly good depiction of the fetal brain anatomy at as early as 18 weeks. For T1 imaging, only conventional GE sequences are available; they last a couple of minutes, and are therefore more often altered by the motion artifacts. They are still needed for proper identification of the tissues, as a complement to T2 imaging. Fat saturation reduces the loss of signal in the fat. Slices should be as thin as possible, and the fastest acquisition time compatible with the diagnostic needs should be obtained when defining the sequences.
Other sequences are not used routinely. Angio MR can be used, but without contrast agent (time of flight, TOF), to avoid any risk regarding toxicity. DWI and MR spectroscopy are potentially useful; they are still under evaluation and not used routinely.