

Книги по МРТ КТ на английском языке / MR Imaging in White Matter Diseases of the Brain and Spinal Cord - K Sartor Massimo Filippi Nicola De Stefano Vincent Dou
.pdf32 D. L. Kraitchman
Z Z
|
|
|
Slower |
|
|
|
precession |
X |
Y |
X |
Faster Y |
|
|
|
precession |
|
90 degree RF pulse |
|
Dephasing |
|
|
Z |
|
X  Y
Y
180 degree RF pulse
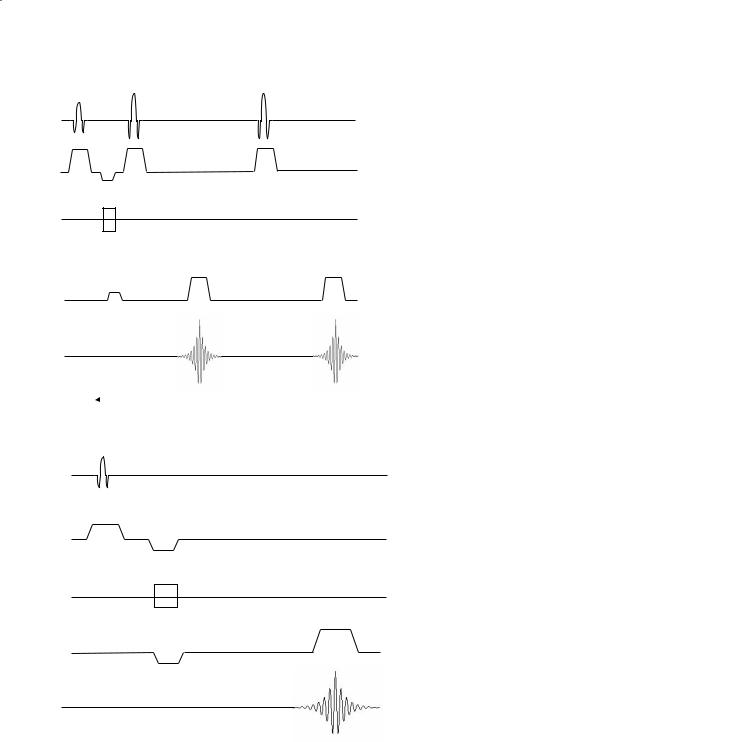
Fig. 3.4. The 90º RF pulse of the spin-echo pulse sequence tips the bulk magnetization to the x-axis with all the spins initially in phase. Due to inhomogeneities in the magnetic field and spin–spin interactions, the spins will dephase with time. The application of a 180º RF refocusing pulse reverses the slower spins (dotted lines) and faster spins (dashed lines) such that a spin echo is created at the echo time with all the spins rephased
pulse and the 180º pulse is TE/2 (Fig. 3.4). The entire sequence is repeated at a repetition time (TR) that is chosen much longer than TE.
To achieve T1 weighting in a spin-echo pulse sequence, a short repetition time is chosen. Similarly, T2 weighting is achieved by choosing a short TE and a longer TR. Proton density images are obtained with a TR longer than used for T1-weighted imaging and a TE shorter than used for T2-weighted imaging. Typical T1 and T2 values at 1.5 T (and 37ºC) are given in Table 3.1.
Table 3.1. Typical T1 and T2 values at 1.5 T and 37ºC
3.2.3
Multi-Echo Spin-Echo
Multi-echo spin-echo sequences are based on the single-echo spin-echo pulse sequence, but use additional 180º refocusing pulse(s) to create additional spin echo(s) (Fig. 3.5). Each spin echo occurs at a different TE and echoes from the same TEs are combined or reconstructed to form a single image. Thus, many images with different degrees of T2-weighting or T2-weighted and proton density images can easily be simultaneously created without extending the imaging time.
Tissue |
T1 (ms) |
T2 (ms) |
|
|
|
White matter |
600–790 |
90 |
Gray matter |
920–950 |
100 |
Cerebrospinal fluid |
4500 |
2000 |
Fat |
250 |
60 |
Blood |
1200 |
100–200a |
a Variation in T2 times in blood are due to differences between oxygenated arterial blood and deoxygenated venous blood.
3.3
Gradient-Echo Imaging
The main difference between gradient-echo imaging and spin-echo imaging is that in spin-echo imaging the dephasing of spins due to magnet inhomogeneity is refocused. This results in a profound advantage of sensitivity, as the signal is much stronger, all else equal. The cost of this quality advantage is time. The
Spinand Gradient-Echo Imaging
90º |
180º |
180º |
|
|
 TE1
TE1  TE2
TE2
α
“rephase”
“dephase”
33
RF
Slice
Phase
Readout
Fig. 3.5. Multi-echo spin-echo pulse se- Signal quence timing diagram using multiple refocusing RF pulses to produce several spin echoes each at a different TE (e.g., TE1 and
TE2)
RF
Slice
Phase
Fig. 3.6. Gradient-echo pulse sequence tim- Readout ing diagram where frequency encoded gradient pulses (i.e., readout) are used to first “dephase” and then “rephase” the spins to create the echo. The flip angle (α), repeti-
Signal tion time, and echo time help to determine the degree of T1 and T2 weighting of the
image
advent of better constructed, more homogeneous magnets made it possible to obtain imaging data without refocusing the spin-dephasing referred to above. Thus, a new method of imaging was created that did not employ refocusing pulses.
In gradient-echo imaging,paired gradient applications are used to dephase and subsequently rephase the spins.Here,the only rephasing that takes place is a reversal of the intentional dephasing provided by the gradients under control of the pulse sequence. This
is in contrast to spin-echo imaging, where dephasing due to magnet imperfections is “corrected” for a sizable advantage in signal-to-noise ratio (SNR).
In gradient-echo imaging, after the phase-encod- ing gradient is switched off, the frequency encoding gradient is reversed (Fig. 3.6). Spins that initially experienced an increased field due to the phase encoding will precess at a higher frequency. With the reversal of the magnitude of the gradient, the spins that were precessing faster are slowed down and the

34 |
D. L. Kraitchman |
slower spins precess faster thereby resulting in rephasing of the spins in a manner similar to the 180º refocusing pulse in spin-echo imaging. Thus, while the 180º RF pulse of spin echo refocuses the dephased spins, a negative gradient lobe in gradient-echo imaging initially causes a phase dispersion of spins that are refocused by reversing the gradient.
Gradient-echo imaging techniques are preferred in many applications where the most rapid imaging is required. The use of a gradient reversal to dephase and then rephase spins has several additional positive consequences. Because only a single RF pulse is applied, the echo can be acquired more quickly thereby significantly reducing echo time. In addition, if low flip angles are used, the repetition time can be reduced. These reductions in TR and TE are what enable gradient-echo techniques to acquire images more rapidly than spin-echo techniques. Moreover, since lower flip angles are frequently used with gra- dient-echo imaging, less energy is deposited than using the 90/180º RF pulses of spin-echo imaging. Therefore, specific absorption rates (SAR), which is defined as the RF power absorbed per unit mass of an object, can be reduced using gradient-echo imaging relative to spin echo.
T2 decay occurs between the dephasing and rephasing gradient pulses. Thus, unlike the 180º RF pulse of spin-echo imaging, rephasing in gradient echo does not completely recover the signal. Because of this loss of signal that cannot be rephased, gradient-echo techniques do not remove the effects of magnetic field inhomogeneities, differences in magnetic susceptibility, or the effects of chemical shift. Thus, gradient-echo techniques are sensitive to T2* effects. However, the ability to acquire images rapidly with gradient-echo pulse sequences has led to their inclusion in many MR imaging protocols. Moreover, the sensitivity to T2* changes can be exploited rather than viewed as a hindrance to demonstrate pathologies such as hemorrhage due to a breakdown in the blood–brain barrier or new techniques such as magnetic cell labeling (Bulte et al. 1999). Because the repetition time can be greatly reduced in gradient-echo techniques, often the longitudinal magnetization does not have the time to recover completely. Thus, the next 90º pulse would tip the net magnetization past the transverse plane resulting in reduced signal intensity. In order to not sacrifice the SNR in short TR gradient-echo sequences, a flip angle less than 90º is often used or a steady state of magnetization is achieved by repeated pulsing. In general, gradient-echo techniques are grouped into three major classes: spoiled gradient-echo, refocused gradi- ent-echo, and magnetization-prepared gradient-echo.
3.3.1
Spoiled Gradient-Echo
In spoiled gradient-echo techniques, only longitudinal magnetization is allowed to reach a steady state. Spoiling to minimize the residual transverse magnetization (Frahm et al. 1986) is accomplished either by applying gradient pulses to crush the transverse magnetization or by varying the phase of the RF excitation pulse. Spoiled gradient-echo techniques are often used for short breath-hold acquisitions or con- trast-enhanced imaging.
3.3.2
Refocused Gradient-Echo
Refocused gradient-echo techniques are also referred to as fast imaging with steady state precession (FISP), fast field echo (FFE), or gradient acquisition in the steady state (GRASS). Both longitudinal and transverse magnetization are allowed to approach a steady state. Thus,these techniques are based on the steady-state free precession (SSFP) methods. For long TRs and low flip angles,the transverse magnetization decays and the contrast of refocused gradient echo is comparable to spoiled gradient echo. For short TRs and large flip angles, a significant amount of transverse magnetization remains resulting in substantial T2-weighting or an image with mixed T1/T2-weighting. Refocused gradient echo is often used for breath-hold and perfusion imaging.
3.3.3
Magnetization-Prepared Gradient-Echo
In order to provide increased contrast compared to that available by varying TR, TE, and flip angle, additional RF preparation pulses can be applied to “prepare” the net magnetization (Fig. 3.7). Unlike the situation found in refocused gradient echo, the spins do not achieve a steady state condition. Image contrast is very sensitive to the time between the prep pulse and the acquisition of the center of k-space. Thus, changes in the ordering of phase encoding as well as the prep pulse can greatly change image contrast. A 180º RF prep pulse or inversion pulse is commonly used to provide T1-weighting. A 90-180-90º pulse or driven equilibrium approach can be used to provide T2-weighting. Collectively, these magnetization prepared gradient-echo sequences are often referred to as turboFLASH, MP-RAGE (magneti- zation-prepared rapid-acquisition gradient-echo), and TFE (turbo field-echo).

Spinand Gradient-Echo Imaging |
35 |
MP α
RF
Slice
Phase
Readout
Fig. 3.7. Magnetization prepared gradient-echo pulse sequence timing diagram where a preparation pulse
(MP) is applied prior to data collection. A 180º prepulse Signal is a special case of magnetization preparation termed
“inversion recovery”
180º |
90º |
180º |
RF
TI
Slice
Phase
Readout
Fig. 3.8. Inversion recovery spin-echo pulse sequence timing diagram where a 180º RF inversion pulse is added prior to the normal spin-echo image acquisition. The inversion time (TI) is chosen such that a specific tissue is crossing the null point to obtain maximal tissue contrast
Signal
TE 
3.4
Inversion Recovery
As mentioned in magnetization-prepared gradientecho, inversion recovery uses a 180º RF preparation pulse to invert the spins. Inversion recovery (IR) can also be performed with 180º pre-pulse using a spinecho or fast spin-echo pulse sequence (Fig. 3.8). T1 relaxation of each tissue occurs with each tissue magnetization passing through a null point as it recovers to equilibrium, with a rate depending upon tissue T1
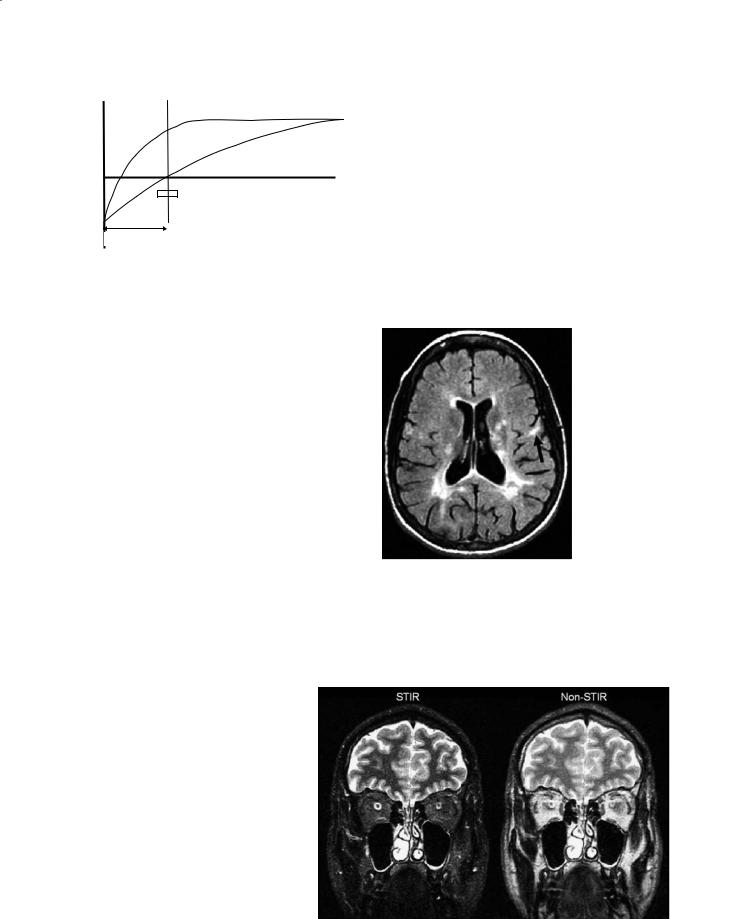
(Fig. 3.9).The time between read-out and the inversion pulse is called the inversion time (TI). By adjusting the TI, such that certain tissues are at the null point during image acquisition, T1 contrast can be maximized (Wehrli et al. 1984). The null point for any individual tissue is determined by: ~ln(2) * T1. For example, by choosing a TI at which cerebrospinal fluid (CSF) is passing thru zero during readout, CSF in the IR image will appear hypointense or black or hence is nulled. Care must be taken when TI is very short. In this case some tissue will still have inverted magnetization,
36
Mz
White matter
Grey matter
Time
Image Acquisition
Inversion Time
Fig. 3.9. Graphic representation of the recovery of longitudinal magnetization as a function of time for different tissues after an inversion pulse. If the image acquisition (shaded area) is placed at the zero crossing (i.e., null point) for a tissue, then maximum contrast between different tissues can be obtained
which will be flipped into the transverse plane and interpreted as positive signal in the images, leading to potential confusion (Young et al. 1985).
3.4.1
Short Inversion Time Recovery
Short tau inversion recovery or STIR is used to enhance contrast between gray and white matter while maintaining a high SNR and suppressing fat. By using a short TI, the signal from fat, which has the shortest T1, can be nulled while preserving soft tissue contrast. At short TI, all other tissue signals are negative which leads to positive values on magnitude reconstructed images (Fig. 3.10). Using STIR, better visualization of structures such as the optic nerve can be obtained (Atlas et al. 1988). STIR is not compatible with intravenous contrast.
Fig. 3.10. Short tau inversion recovery (STIR) image (left) is used to suppress signal form the peri-orbital fat. In a non-STIR image (right), the details of the optic nerve cannot be seen due to the strong signal from peri-orbital fat. The inversion time of 170 ms in the STIR image causes the fat to pass through zero or be nulled. The echo time (TE=90 ms) is the same in both images. (Image courtesy of Mark A. Horsfield)
D. L. Kraitchman
3.4.2
Fluid-Attenuated Inversion Recovery
Fluid-attenuated inversion recovery (FLAIR) is a heavily T2-weighted sequence with suppression of the signal from CSF (i.e., fluid) leading to increased conspicuity of brain lesions (Frahm et al. 1986; De Coene et al. 1992). Suppression of the CSF is performed by choosing a null point of ~2200 ms (i.e., 70% of T1 of CSF) combined with a long echo time for T2-weighting (Fig. 3.11). The suppression of the CSF signal leads to decreased artifacts from CSF flow thereby enhancing the conspicuity of small lesions (Hajnal et al. 1992) especially those that are close to the ventricles or sulci.
Fig. 3.11. Axial fluid attenuated inversion recovery (FLAIR) image of a patient with multiple sclerosis. A long inversion time (TI=2200 ms) almost completely suppresses the signal from the cerebrospinal fluid (CSF) such that the periventricular lesions are more conspicuous. In addition, several subcortical lesions (arrow) are seen that could not be demonstrated on standard T2-weighted images. (Image courtesy of Mark A. Horsfield)
Spinand Gradient-Echo Imaging |
37 |
3.5 Artifacts
3.5.1
Metal Artifacts
Metal objects are well known to cause hypointense artifacts due to local distortions of the magnetic field (Laakman et al.1985; Heindel et al.1986; Shellock
2001).Dental implants,surgical clips,stents,and mascara can all be sources of ferromagnetic or paramagnetic materials (Sacco et al. 1987). The 180º refocusing pulse of spin-echo imaging tends to decrease the severity of artifacts relative to gradient-echo imaging (Fig. 3.12). If gradient-echo pulse sequences are used, shorter echo times will decrease the severity of artifacts from metal objects.
3.5.2
Chemical Shift Artifacts
The hydrogen signal that is measured by MRI is primarily composed of fat and water. At the clinical MR field strengths, fat and water precess at significantly different frequencies (e.g., 3.5 ppm at 1.5 T or 230 Hz). Since spatial mapping in one direction is done according to frequency (i.e., frequency encoding), the
frequency difference with which water and fat precess causes fat and water signals in a single voxel to be mapped to different voxel locations (Fig. 3.13). This pixel shifting due to the chemical makeup is called a chemical shift artifact (Soila et al. 1984; Dwyer et al. 1985). The extent of misregistration of fat and water depends on the range of frequencies that can be assigned to spatial location (bandwidth). Low bandwidth imaging results in large degree of chemical shift artifacts. While higher bandwidth imaging will reduce chemical shift artifacts, low bandwidth imaging gives higher signal to noise and better image quality.Chemical shift artifacts increase with increasing field strength.
Fig. 3.12. Metal artifact causes a hypointense artifact on a spinecho image (left). The use of a shorter echo time (TE=10 ms, right) decreases the extent of the hypointense artifact in a gradient-echo image relative to a longer echo time (TE=20 ms, lower right). (Image courtesy of Peter Barker)
Fig. 3.13. A chemical shift artifact causes fat signal in the scalp to be mapped onto the posterior aspect of the brain in this low-bandwidth T2-weighted image. (Image courtesy of Peter Barker)
3.5.3
Motion Artifacts
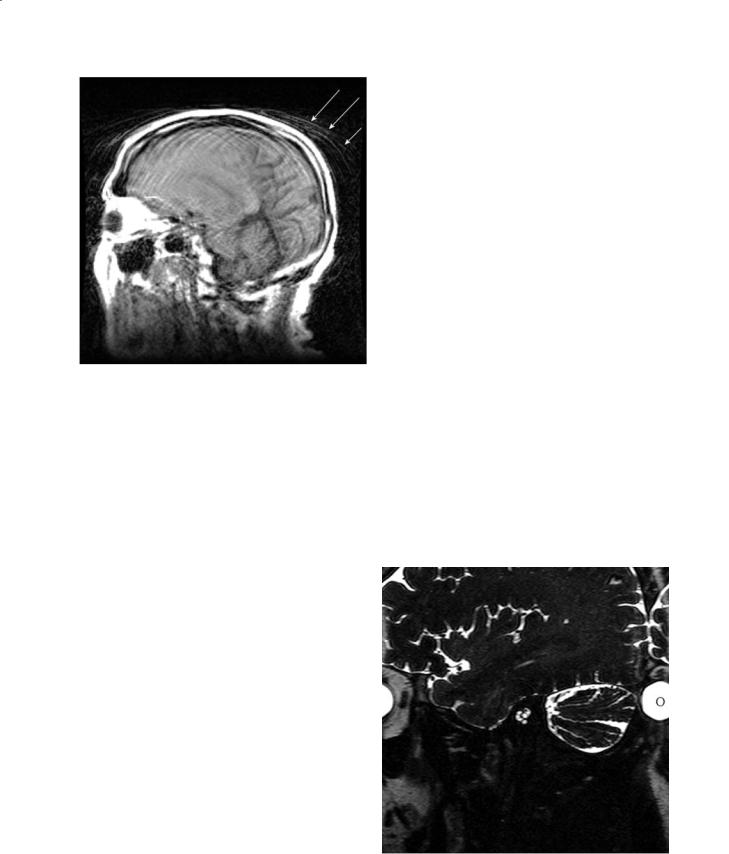
Movement due to patient motion or pulsatile motion such as from blood and CSF can become mismapped which leads to artifacts in the image. Ghosting artifacts are seen in the phase encode direction due to periodic motion such as due to blood flow (Wood and Henkelman 1985).Image blurring occurs due to random motion from signal cancellation (Fig. 3.14).
Artifacts due to patient motion are minimized by immobilizing the patient. Gating to the cardiac cycle or respiratory cycle is used to minimize artifacts due to the heart beating or the patient breathing, respectively. Alternately, respiratory motion can be reduced by suspending respiration or performing a breathhold (Paling and Brookeman 1986).
38 |
D. L. Kraitchman |
Fig. 3.14. The inability of a patient to remain still during a scan results in image blurring within the brain as well as ghosting artifacts (arrows) outside the head. (Image courtesy of Peter Barker)
One method for reducing the effect of motion artifacts due to blood flow into the imaging slice is to suppress the inflowing blood with spatial presaturation pulses.Spatially selective RF pulses in the regions adjacent to the imaging plane are used to saturate the unwanted inflowing blood.
Gradient moment nulling or flow compensation is used to compensate for phase shifts that occur due to motion during the application of the gradients (Dwyer et al. 1985; Haacke and Lenz 1987; Elster
1988; Ehman and Felmlee 1990). Typically additional pulses in the slice select and frequency encoding waveforms are incorporated. These pulses are equal but opposite in amplitude. Thus, motion of a constant velocity that would normally accumulate a net phase is rephased. The additional gradient pulses increase the TE, but can be a very effective method in gradient-echo pulse sequences of reducing CSF flow effects.
3.5.4
Wrap-Around Artifacts
Wrap-around artifact or aliasing (Fig. 3.15) occurs when a portion of the anatomy outside the field a view appears in the reconstructed image (Bellon et al. 1986; Pusey et al. 1988). Aliasing is purely a digitization phenomena that occurs when spatial locations
outside the field of view are detected and than reconstructed as wrapped data in the image.Aliasing in the read direction may be prevented by increasing the field of view.The use of surface coils to prevent excitation of spins outside the field of view or spatial saturation (Edelman et al. 1988) to reduce signal from outside the field of view can also offer a method to minimize aliasing. Another method for minimizing or eliminating aliasing artifacts is to oversample the signal by increasing the number of phase encoding steps. However, more imaging time will be required if more phase encoding steps are obtained.
3.6
Gadolinium Contrast Studies
Gadolinium-based contrast agents, such as gadolinium diethylene triamine pentaacetic acid (GdDTPA) (Weinmann et al. 1984), belong to the class of paramagnetic contrast agents. Paramagnetic contrast agents contain unpaired electrons. When these exogenous paramagnetic agents are injected intravenously, the interaction of the unpaired electrons with the precessing nuclei increased the relaxation rate of the neighboring protons or tissue water. The effect of these paramagnetic agents is to shorten T1 and T2 relaxation. At low doses, gadolinium-based
Fig. 3.15. Aliasing or wrap-around artifact occurred in this image when too small a field of view was chosen. Notice the fold-over artifact on the right-hand side of the image (letter O on eye). (Image courtesy of Peter Barker)
Spinand Gradient-Echo Imaging |
39 |
contrast agents exert their effects by primarily altering T1, which leads to an increase signal intensity in perfused tissues. At higher concentrations, the effect is primarily on T2 and leads to a signal loss or hypointense artifact when the contrast agent is present. Tissues that uptake gadolinium-based contrast agents appear darker on T2-weighted images.
First pass perfusion of bolus administration of gadolinium-based contrast agents leads to regional signal intensity changes that are related to tissue hemodynamics. Unlike conventional X-ray contrast agents where the concentration of the contrast agent directly affects the signal intensity, the gadoliniumbased MR contrast agents exert their effects on the local protons or water. In the normal brain, due to the blood–brain barrier, the contrast agent is retained within the cerebral vascular. However, water from the blood pool that has experienced shortening of T1 and T2 due to the presence of the contrast agent may diffuse into to the surrounding extracellular space. If the blood–brain barrier is damaged, then the agents can leak out into the brain parenchyma. Thus, MR contrast kinetics can become quite complex.
Typically, the dosages of gadolinium-based contrast agents are chosen such that there is a linear relationship between contrast concentration and changes in T1 or T2 relaxation. In addition, tracer kinetic theory is applied during the first pass of the
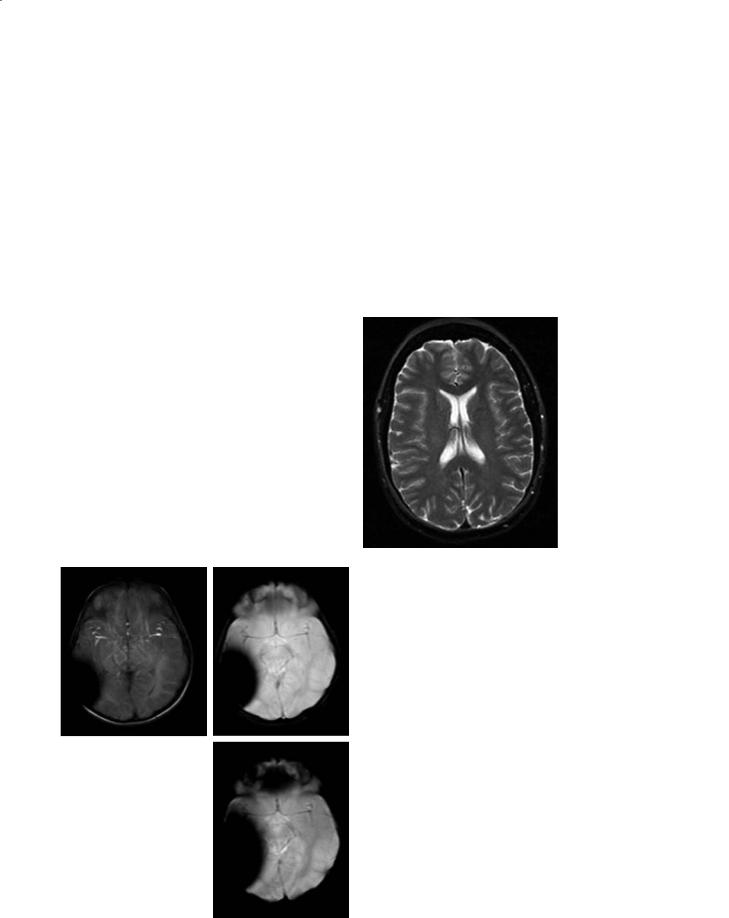
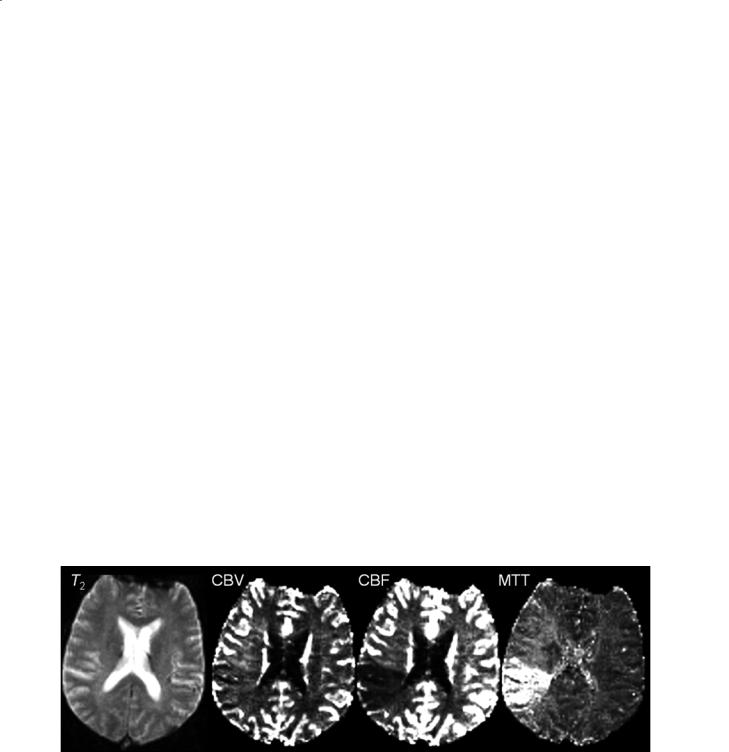
contrast agent through the brain to minimize any confounding effects of water diffusion. In perfusion imaging of the brain, T2-weighted images are often obtained during the first transit or passage of the contrast agent bolus through the brain. As the contrast agent transits the brain vasculature, T2* effects predominate resulting in a negative signal intensity in perfused tissues (Fig. 3.16). By evaluating the concentration versus time curves of the first pass of the contrast bolus, regional cerebral blood volume can be estimated as the area under the curve (Rosen et al. 1991). Moreover, if the arterial input function is know, then other quantities such as mean transit time (MTT) and regional cerebral blood flow (rCBF) can be estimated. Other parameters such as contrast arrival time can also be evaluated from these curves.
Several gadolinium-based contrast agents that have a larger molecular structure either by the formation of dendrimers or binding to macromolecules such as albumin are under investigation for use in magnetic resonance angiography (MRA). Due to the large size of these agents, they cannot diffuse from the vascular space and thus remain intravascular.
Increases in vascularity and permeability as may occur in tumors as well as edema which may occur secondary to an ischemic event or with certain pathologies often results in an increased signal intensity of T1-weighted images.
Fig. 3.16. Cerebral perfusion parameters can be estimated from analysis of the first passage of a contrast agent through the brain in a stroke patient. A single T2-weighted image (left) from a series of 100 images that were collected as the contrast bolus traverses the brain is shown. Parameters such as cerebral blood volume (CBV), cerebral blood flow (CBF), and mean transit time (MTT) can be calculated from the series of first pass images. In order to achieve a high temporal resolution of the scan, spatial resolution is decreased which results in poor image quality and image distortion. (Images courtesy of Mark A. Horsfield)

40
References
Atlas SW, Grossman RI, Hackney DB, Goldberg HI, Bilaniuk LT, Zimmerman RA (1988) STIR MR imaging of the orbit. AJR Am J Roentgenol 151:1025–1030
Bellon EM, Haacke EM, Coleman PE, Sacco DC, Steiger DA, Gangarosa RE (1986) MR artifacts: a review. Am J Roentgenol 147:1271–1281
Bulte JW, Zhang S, van Gelderen P, Herynek V, Jordan EK, Duncan ID, Frank JA (1999) Neurotransplantation of magnetically labeled oligodendrocyte progenitors: magnetic resonance tracking of cell migration and myelination. Proc Natl Acad Sci U S A 96:15256–15261
De Coene B, Hajnal JV, Gatehouse P, Longmore DB, White SJ, Oatridge A, Pennock JM, Young IR, Bydder GM (1992) MR of the brain using fluid-attenuated inversion recovery (FLAIR) pulse sequences. Am J Neuroradiol 13:1555–1564 Dwyer AJ, Knop RH, Hoult DI (1985) Frequency shift artifacts
in MR imaging. J Comput Assist Tomogr 9:16–18 Edelman RR, Atkinson DJ, Silver MS, Loaiza FL, Warren WS
(1988) FRODO pulse sequences: a new means of eliminating motion, flow, and wraparound artifacts. Radiology 166:231–236
Ehman RL, Felmlee JP (1990) Flow artifact reduction in MRI: a review of the roles of gradient moment nulling and spatial presaturation. Magn Reson Med 14:293–307
Elster AD (1988) Motion artifact suppression technique (MAST) for cranial MR imaging: superiority over cardiac gating for reducing phase-shift artifacts. AJNR Am J Neuroradiol 9:671–674
Frahm J, Haase A, Matthaei D (1986) Rapid NMR imaging of dynamic processes using the FLASH technique. Magn Reson Med 3:321–327
Haacke EM, Lenz GW (1987) Improving MR image quality in the presence of motion by using rephasing gradients. AJR Am J Roentgenol 148:1251–1258
Hajnal JV, Bryant DJ, Kasuboski L, Pattany PM, De Coene B, Lewis PD, Pennock JM, Oatridge A, Young IR, Bydder GM, Gatehouse P, Longmore DB, White SJ (1992) Use of fluid
D. L. Kraitchman
attenuated inversion recovery (FLAIR) pulse sequences in MRI of the brain. J Comput Assist Tomogr 16:841–844
Heindel W, Friedmann G, Bunke J, Thomas B, Firsching R, Ernestus RI (1986) Artifacts in MR imaging after surgical intervention. J Comput Assist Tomogr 10:596–599
Laakman RW, Kaufman B, Han JS, Nelson AD, Clampitt M, O’Block AM, Haaga JR, Alfidi RJ (1985) MR imaging in patients with metallic implants. Radiology 157:711–714
Paling MR, Brookeman JR (1986) Respiration artifacts in MR imaging: reduction by breath holding. J Comput Assist Tomogr 10:1080–1082
Pusey E, Yoon C, Anselmo ML, Lufkin RB, Stark DD, Brown R, Leikind B, Hanafee WN, Brown RK, Solomon MA, Tarr RW (1988) Aliasing artifacts in MR imaging. Comput Med Imaging Graph 12:219–224
Rosen BR, Belliveau JW, Buchbinder BR, McKinstry RC, Porkka LM, Kennedy DN, Neuder MS, Fisel CR, Aronen HJ, Kwong KK (1991) Contrast agents and cerebral hemodynamics. Magn Reson med 19:285–292
Sacco DC, Steiger DA, Bellon EM, Coleman PE, Haacke EM, Gangarosa RE (1987) Artifacts caused by cosmetics in MR imaging of the head. Am J Roentgenol 148:1001–1004
Shellock FG (2001) Metallic neurosurgical implants: evaluation of magnetic field interactions, heating, and artifacts at 1.5-Tesla. J Magn Reson Imaging 14:295–299
Soila KP, Viamonte M, Jr., Starewicz PM (1984) Chemical shift misregistration effect in magnetic resonance imaging. Radiology 153:819–820
Wehrli FW, MacFall JR, Glover GH, Grigsby N, Haughton V, Johanson J (1984) The dependence of nuclear magnetic resonance (NMR) image contrast on intrinsic and pulse sequence timing parameters. Magn Reson Imaging 2:3–16 Weinmann H, Brasch R, Press W, Wesbey G (1984) Characteristics of gadolinium-DTPA complex: a potential NMR
contrast agent. AJR 142: 619–624
Wood ML, Henkelman RM (1985) MR image artifacts from periodic motion. Med Phys 12:143–151
Young IR, Bailes DR, Bydder GM (1985) Apparent changes of appearance of inversion-recovery images. Magn Reson Med 2:81–85

Fast Imaging with an Introduction to k-Space |
41 |
4Fast Imaging with an Introduction to k-Space
Joseph C. McGowan
CONTENTS
4.1Introduction 41
4.2k-Space 42
4.3 |
Spin-Echo Acquisition with Multiple Echoes 48 |
4.4Fast Spin-Echo 48
4.5 |
Image Quality and Artifacts |
50 |
4.6 |
Echo-Planar Imaging 52 |
|
4.7 |
Hybrid Techniques: GRASE |
53 |
4.8Burst Imaging 53
4.9Parallel Imaging 54
4.10Conclusion 55 References 55
4.1 Introduction
The quest for speed in diagnostic imaging is understandable from all perspectives. The physician desires a “snapshot” of the anatomy or process in question and is concerned about the effect of physiologic motion on the examination. Repetition of the examination is often indicated when the process to be investigated is dynamic. The patient may be limited in ability to remain still, or may be uncomfortable during the imaging procedure.All participants desire a quick answer to the questions being addressed by the study. Finally, economic imperatives often favor a rapid exam.
It has always been possible to trade quality for speed, or vice versa, in magnetic resonance imaging. For example, repeating an exam and averaging the results is a classic method of improving the quality of some images. This method may fail, however, in the presence of some types of physiologic motion. Fortunately, much attention has been focused on methods to improve imaging speed while maintaining quality. Some improvements have been realized
J. C. McGowan, PhD
Associate Professor of Electrical Engineering, Dept. of Electrical Engineering, United States Naval Academy, Annapolis, MD 21405-5025, USA
via advances in technology. Specifically, improvements in signal preservation, noise rejection and gradient performance have allowed optimization of existing techniques with maximal yield of usable signal. The most impressive improvements, however, have been realized by finding means of circumventing the physical limitations imposed by relaxation, some of which will be explained below.
Gradient-echo imaging may be thought of as the “original” fast scan technique. It was known that the inherent spin dephasing via T2 decay was a relatively longer process compared to the signal decay due to the imperfections of the magnet. When magnet technology improved, it was found that sufficient signal to reconstruct an image could be obtained without refocusing the spins. Gradient-echo imaging could not, however, replace all conventional spin-echo imaging as it did not produce “pure” T2weighting. Gradient and spin-echo techniques can be thought of as bases for all fast imaging techniques. In fact, it will be shown that all current fast imaging techniques are in some way hybrid forms of these two. To begin, we will trace the development of fast spin-echo imaging.
The success of magnetic resonance imaging (MRI) as a diagnostic modality can be attributed to a number of factors, but prominent among them is that in many disease states the observed transverse relaxation time (T2) is altered. Thus, the most clinically useful results in MRI are obtained with so-called T2 weighted contrast, where the intensity of an individual picture element (pixel) in the image reflects the observed T2 of the tissue. For many years these studies were performed with the spin-warp pulse sequence, discussed in an earlier chapter. Briefly, in that sequence one chooses principally the repetition rate (TR) and the echo time (TE). Using relatively long TR and TE values, the signal intensity in regions with long T2 is higher, causing those regions to appear hyperintense on the resulting images. The TR must be long enough so that progressive saturation, which would contribute T1 contrast, is minimized to the degree necessary. The compromise, of course, is that the