

Книги по МРТ КТ на английском языке / MR Imaging in White Matter Diseases of the Brain and Spinal Cord - K Sartor Massimo Filippi Nicola De Stefano Vincent Dou
.pdfConventional MRI Techniques in Multiple Sclerosis
and the accumulation of T2 burden, chronic black holes, and progressive brain and spinal cord atrophy likely reflect worsening disease irrespective of the clinical status. What is required before they can be used and applied in the management of the individual is the validation of what these changes mean for the long-term outcome of the individual patient and how they are modified and affected by treatment.
14.7 Summary
Conventional MRI techniques include measures of new inflammation (new and enlarging T2W lesions, gadolinium-enhancing T1W lesions), measures of acute and chronic disease (total T2 volume or BOD), and measures of degeneration (global brain and spinal cord atrophy, and chronic black holes on T1W images). Combined, they provide a unique insight into the dynamics of MS lesion development and the long-term pathological consequences on CNS tissues. The limited clinical correlation reflects, in part, the unique sensitivity of MRI to detect clinically silent disease. Although not required for the clinical diagnosis of MS, conventional MRI methods can be invaluable in establishing an earlier diagnosis. These techniques can also be standardized on routine clinical MRI scanners and used in multicenter therapeutic trials. Conventional MRI measures have become important outcome measures in clinical trials of new therapies for MS. It is likely that conventional MRI measures will be augmented, rather than replaced, by newer methods as the conventional methods reflect the basic pathological processes of MS. However, additional validation will be needed before they can be used to effectively monitor treatment response in the individual patient.
References
Bagnato F, Jeffries N, Richert ND, et al (2003) Evolution of T1 black holes in patients with multiple sclerosis imaged monthly for 4 years. Brain 126:1782–1789
Barkhof F, McGowan JC, van Waesberghe JH, et al (1998) Hypointense multiple sclerosis lesions on T1-weighted spin echo magnetic resonance images: their contribution in understanding multiple sclerosis evolution. J Neurol Neurosurg Psychiatry 64 [Suppl 1]:S77–S79
Barnes D, Munro PM, Youl BD, et al (1991) The longstanding
221
MS lesion. A quantitative MRI and electron microscopic study. Brain 114:1271–1280
Beck RW, Trobe JD, Moke PS, et al (2003) Highand low-risk profiles for the development of multiple sclerosis within 10 years after optic neuritis: experience of the optic neuritis treatment trial. Arch Ophthalmol 121:944–949
Boggild MD, Williams R, Haq N, et al (1996) Cortical plaques visualised by fluid-attenuated inversion recovery imaging in relapsing multiple sclerosis. Neuroradiology 38 [Suppl 1]:S10–S13
Bot JC, Barkhof F, Lycklama A, et al (2002) Differentiation of multiple sclerosis from other inflammatory disorders and cerebrovascular disease: value of spinal MR imaging. Radiology 223:46–56
Brex PA, Jenkins R, Fox NC, et al (2000) Detection of ventricular enlargement in patients at the earliest clinical stage of MS. Neurology 54:1689–1691
Brex PA, Ciccarelli O, O’Riordan JI, et al (2002) A longitudinal study of abnormalities on MRI and disability from multiple sclerosis. N Engl J Med 346(3):158–164
Cala LA, Mastaglia FL, Black JL (1978) Computerized tomography of brain and optic nerve in multiple sclerosis. Observations in 100 patients, including serial studies in 16. J Neurol Sci 36:411–426
Ciccarelli O, Werring DJ, Wheeler-Kingshott CAM, et al (2001) Investigation of MS normal-appearing brain using diffusion tensor MRI with clinical correlations. Neurology 56:926–933
Cole SR, Beck RW, Moke PS, et al (2000) The National Eye Institute Visual Function Questionnaire: experience of the ONTT. Optic Neuritis Treatment Trial. Invest Ophthalmol Vis Sci 41:1017–1021
Comi G, Filippi M, Barkhof F, et al (2001a) Effect of early interferon treatment on conversion to definite multiple sclerosis: a randomised study. Lancet 357:1576–1582
Comi G, Filippi M, Wolinsky JS (2001b) European/Canadian multicenter, double-blind, randomized, placebo-controlled study of the effects of glatiramer acetate on magnetic resonance imaging-measured disease activity and burden in patients with relapsing multiple sclerosis. European/ Canadian Glatiramer Acetate Study Group. Ann Neurol 49:290–297
Dalton CM, Brex PA, Miszkiel KA, et al (2002) Application of the new McDonald criteria to patients with clinically isolated syndromes suggestive of multiple sclerosis. Ann Neurol 52:47–53
Dalton CM, Brex PA, Miszkiel KA, et al (2003) New T2 lesions enable an earlier diagnosis of multiple sclerosis in clinically isolated syndromes. Ann Neurol 53:673–676
Damian MS, Schilling G, Bachmann G, et al (1994) White matter lesions and cognitive deficits: relevance of lesion pattern? Acta Neurol Scand 90:430–436
Davies MB, Williams R, Haq N, et al (1998) MRI of optic nerve and postchiasmal visual pathways and visual evoked potentials in secondary progressive multiple sclerosis. Neuroradiology 40:765–770
de Seze J, Devos D, Castelnovo G, et al (2001) The prevalence of Sjogren syndrome in patients with primary progressive multiple sclerosis. Neurology 57:1359–1363
De Stefano N, Narayanan S, Francis SJ, et al (2002) Diffuse axonal and tissue injury in patients with multiple sclerosis with low cerebral lesion load and no disability. Arch Neurol 59:1565–1571

222
Edwards SG, Liu C, Blumhardt LD (2001) Cognitive correlates of supratentorial atrophy on MRI in multiple sclerosis.Acta Neurol Scand 104:214–223
Filippi M, Paty DW, Kappos L, et al (1995) Correlations between changes in disability and T2-weighted brain MRI activity in multiple sclerosis: a follow-up study. Neurology 45:255–260
Filippi M,Yousry T, Baratti C, et al (1996a) Quantitative assessment of MRI lesion load in multiple sclerosis. A comparison of conventional spin-echo with fast fluid-attenuated inversion recovery. Brain 119:1349–1355
Filippi M, Yousry T, Campi A, et al (1996b) Comparison of triple dose versus standard dose gadolinium-DTPA for detection of MRI enhancing lesions in patients with MS. Neurology 46:379–384
Filippi M, Marciano N, Capra R, et al (1997) The effect of imprecise repositioning on lesion volume measurements in patients with multiple sclerosis. Neurology 49:274–276
Filippi M, Mastronardo G, Rocca MA, et al (1998) Quantitative volumetric analysis of brain magnetic resonance imaging from patients with multiple sclerosis. J Neurol Sci 158:148– 153
Filippi M, Rovaris M, Rice GP, et al (2000) The effect of cladribine on T(1) ‘black hole’ changes in progressive MS. J Neurol Sci 176:42–44
Fox NC, Jenkins R, Leary SM, et al (2000) Progressive cerebral atrophy in MS: a serial study using registered, volumetric MRI. Neurology 54:807–812
Gawne-Cain ML, O’Riordan JI, Thompson AJ, et al (1997) Multiple sclerosis lesion detection in the brain: a comparison of fast fluid-attenuated inversion recovery and conventional T2-weighted dual spin echo. Neurology 49:364–370
Ge Y, Grossman RI, Udupa JK, et al (2000) Brain atrophy in relapsing-remitting multiple sclerosis and secondary progressive multiple sclerosis: longitudinal quantitative analysis. Radiology 214:665–670
Ge Y, Grossman RI, Babb JS, et al (2003) Dirty-appearing white matter in multiple sclerosis: volumetric MR imaging and magnetization transfer ratio histogram analysis. AJNR Am J Neuroradiol 24:1935–1940
Harris JO, Frank JA, Patronas N, et al (1991) Serial gadoliniumenhanced magnetic resonance imaging scans in patients with early, relapsing-remitting multiple sclerosis: implications for clinical trials and natural history. Ann Neurol 29:548–555
Hoogervorst EL, Polman CH, Barkhof F (2002) Cerebral volume changes in multiple sclerosis patients treated with high-dose intravenous methylprednisolone. Mult Scler 8:415–419
Horowitz AL, Kaplan RD, Grewe G, et al (1989) The ovoid lesion: a new MR observation in patients with multiple sclerosis. AJNR Am J Neuroradiol 10:303–305
Isaac C, Li DKB, Genton M, et al (1988) Multiple sclerosis: a serial study using MRI in relapsing patients. Neurology 38:1511–1515
Jacobs LD, Cookfair DL, Rudick RA, et al (1996) Intramuscular interferon beta-1a for disease progression in relapsing multiple sclerosis. The Multiple Sclerosis Collaborative Research Group (MSCRG). Ann Neurol 39:285–294
Kappos L, Moeri D, Radue EW, et al (1999) Predictive value of gadolinium-enhanced magnetic resonance imaging for relapse rate and changes in disability or impairment in
A. Traboulsee et al.
multiple sclerosis: a meta-analysis. Gadolinium MRI Metaanalysis Group. Lancet 353:964–969
Kermode AG, Tofts PS, Thompson AJ, et al (1990) Heterogeneity of blood-brain barrier changes in multiple sclerosis: an MRI study with gadolinium-DTPA enhancement. Neurology 40:229–235
Kidd D, Barkhof F, McConnell R, et al (1999) Cortical lesions in multiple sclerosis. Brain 122:17–26
Koopmans RA, Li DK, Oger JJ, et al (1989a) Chronic progressive multiple sclerosis: serial magnetic resonance brain imaging over six months. Ann Neurol 26:248–256
Koopmans RA, Li DKB, Grochowski E, et al (1989b) Benign vesus chronic progressive multiple sclerosis: magnetic resonance imaging features. Ann Neurol 25:74–81
Koopmans RA, Li DKB, Oger JJF, et al (1989c) The lesion of multiple sclerosis: imaging of acute and chronic stages. Neurology 39:959–963
Kurtzke JF (1983) Rating neurologic impairment in multiple sclerosis: an expanded disability status scale (EDSS). Neurology 33:1444–1452
Lee MA, Smith S, Palace J, et al (1999) Spatial mapping of T2 and gadolinium-enhancing T1 lesion volume in multiple sclerosis: evidence for distinct mechanisms of lesion genesis? Brain 122:1261–1270
Li DK, Paty DW (1999) Magnetic resonance imaging results of the PRISMS trial: a randomized, double-blind, placebocontrolled study of interferon-beta1a in relapsing-remit- ting multiple sclerosis. Prevention of Relapses and Disability by Interferon-beta1a Subcutaneously in Multiple Sclerosis. Ann Neurol 46:197–206
Liu C, Edwards S, Gong Q, et al (1999) Three dimensional MRI estimates of brain and spinal cord atrophy in multiple sclerosis. J Neurol Neursurg Psychiatry 66:323–330
Losseff NA, Wang L, Lai HM, et al (1996a) Progressive cerebral atrophy in multiple sclerosis. A serial MRI study. Brain 119:2009–2019
Losseff NA, Webb SL, O’Riordan JI, et al (1996b) Spinal cord atrophy and disability in multiple sclerosis. A new reproducible and sensitive MRI method with potential to monitor disease progression. Brain 119:701–708
Lublin FD, Reingold SC (1996) Defining the clinical course of multiple sclerosis: results of an international survey. National Multiple Sclerosis Society (USA) Advisory Committee on Clinical Trials of New Agents in Multiple Sclerosis. Neurology 46:907–911
Lycklama G, Thompson A, Filippi M, et al (2003) Spinal-cord MRI in multiple sclerosis. Lancet Neurol 2:555–562
McDonald WI, Ron MA (1999) Multiple sclerosis: the disease and its manifestations (review). Philos Trans R Soc Lond B Biol Sci 354:1615–1622
McDonald WI, Compston A, Edan G, et al (2001) Recommended diagnostic criteria for multiple sclerosis: guidelines from the International Panel on the Diagnosis of Multiple Sclerosis. Ann Neurol 50:121–127
McFarland HF, Frank JA, Albert PS, et al (1992) Using gado- linium-enhanced magnetic resonance imaging lesions to monitor disease activity in multiple sclerosis. Ann Neurol 32:758–766
Miller DH, Rudge P, Johnson G, et al (1988) Serial gadolinium enhanced magnetic resonance imaging in multiple sclerosis. Brain 111:927–939
Miller DH, Barkhof F, Frank JA, et al (2002) Measurement of atrophy in multiple sclerosis: pathological basis, method-

Conventional MRI Techniques in Multiple Sclerosis
ological aspects and clinical relevance. Brain 125:1676– 1695
Nesbit GM, Forbes GS, Scheithauer BW, et al (1991) Multiple sclerosis: histopathologic and MR and/or CT correlation in 37 cases at biopsy and three cases at autopsy. Radiology 180:467–474
Newcombe J, Hawkins CP, Henderson CL, et al (1991) Histopathology of multiple sclerosis lesions detected by magnetic resonance imaging in unfixed postmortem central nervous system tissue. Brain 114:1013–1023
O’Riordan JI, Thompson AJ, Kingsley DP, et al (1998) The prognostic value of brain MRI in clinically isolated syndromes of the CNS. A 10-year follow-up. Brain 121:495–503
Ostuni JL, Richert ND, Lewis BK, et al (1999) Characterization of differences between multiple sclerosis and normal brain: a global magnetization transfer application. AJNR Am J Neuroradiol 20:501–507
Paolillo A, Pozzilli C, Gasperini C, et al (2000) Brain atrophy in relapsing-remitting multiple sclerosis: relationship with ‘black holes’, disease duration and clinical disability. J Neurol Sci 174:85–91
Paty DW (1988) Magnetic resonance imaging in the assessment of disease activity in multiple sclerosis. Can J Neurol Sci 15:266–272
Paty DW, Li DK (1993) Interferon beta-1b is effective in relaps- ing-remitting multiple sclerosis. II. MRI analysis results of a multicenter, randomized, double-blind, placebo-controlled trial. UBC MS/MRI Study Group and the IFNB Multiple Sclerosis Study Group. Neurology 43:662–667
Paty DW, Li DK, Oger JJ, et al (1994) Magnetic resonance imaging in the evaluation of clinical trials in multiple sclerosis. Ann Neurol [Suppl] 36:S95–S96
Poser CM, Paty DW, Scheinberg L, et al (1984) New diagnostic criteria for multiple sclerosis. Guidelines for research protocols. In: Poser CM, Paty DW, Scheinberg L, Ebers GC (eds) The diagnosis of multiple sclerosis. Thieme-Stratton, New York, pp 225–233
Pozzilli C,Fieschi C,Perani D,et al (1992) Relationship between corpus callosum atrophy and cerebral metabolic asymmetries in multiple sclerosis. J Neurol Sci 112:51–57
PRISMS Study Group (2001) PRISMS-4: long-term efficacy of interferon-beta-1a in relapsing MS. Neurology 56:1628– 1636
Rovaris M, Rocca MA, Capra R, et al (1998) A comparison between the sensitivities of 3-mm and 5-mm thick serial brain MRI for detecting lesion volume changes in patients with multiple sclerosis. J Neuroimaging 8:144–147
Rovaris M, Comi G, Rocca MA, et al (2001) Short-term brain volume change in relapsing-remitting multiple sclerosis: effect of glatiramer acetate and implications. Brain 124:1803–1812
Rudick RA, Fisher E, Lee JC, et al (1999) Use of the brain parenchymal fraction to measure whole brain atrophy in relapsing-remitting MS. Multiple Sclerosis Collaborative Research Group. Neurology 53:1698–1704
Rydberg JN, Riederer SJ, Rydberg CH, et al (1995) Contrast optimization of fluid-attenuated inversion recovery (FLAIR) imaging. Magn Reson Med 34:868–877
Silver NC, Good CD, Barker GJ, et al (1997) Sensitivity of con-
223
trast enhanced MRI in multiple sclerosis. Effects of gadolinium dose, magnetization transfer contrast and delayed imaging. Brain 120:1149–1161
Smith ME, Stone LA, Albert PS, et al (1993) Clinical worsening in multiple sclerosis is associated with increased frequency and area of gadopentetate dimeglumine-enhancing magnetic resonance imaging lesions. Ann Neurol 33:480–489
Stewart WA, Hall LD, Berry K, et al (1986) Magnetic resonance imaging (MRI) in multiple sclerosis (MS): pathological correlation studies in eight cases. Neurology 36:320
Stone LA, Albert PS, Smith ME (1995) Changes in the amount of diseased white matter over time in patients with relaps- ing-remitting multiple sclerosis. Neurology 45:1808–1814 Tartaglino LM, Friedman DP, Flanders AE, et al (1995) Multiple sclerosis in the spinal cord: MR appearance and correlation
with clinical parameters. Radiology 195:725–732
Thielen KR, Miller GM (1996) Multiple sclerosis of the spinal cord: magnetic resonance appearance. J Comput Assist Tomogr 20:434–438
Thorpe JW, Kidd D, Moseley IF, et al (1996) Serial gadoliniumenhanced MRI of the brain and spinal cord in early relaps- ing-remitting multiple sclerosis. Neurology 46:373–378
Tien RD, Hesselink JR, Szumowski J (1991) MR fat suppression combined with Gd-DTPA enhancement in optic neuritis and perineuritis. J Comput Assist Tomogr 15:223–227
Traboulsee A, Dehmeshki J, Peters KR, et al (2003) Disability in multiple sclerosis is related to normal appearing brain tissue MTR histogram abnormalities. Mult Scler 9:566– 573
Truyen L, van Waesberghe JH, van Walderveen MA, et al (1996) Accumulation of hypointense lesions (“black holes”) on T1 spin-echo MRI correlates with disease progression in multiple sclerosis. Neurology 47:1469–1476
van Walderveen MA, Barkhof F, Tas MW, et al (1998) Patterns of brain magnetic resonance abnormalities on T2-weighted spin echo images in clinical subgroups of multiple sclerosis: a large cross-sectional study. Eur Neurol 40:91–98
van Walderveen MA, Barkhof F, Pouwels PJ, et al (1999) Neuronal damage in T1-hypointense multiple sclerosis lesions demonstrated in vivo using proton magnetic resonance spectroscopy. Ann Neurol 46:79–87
Whittall KP, MacKay AL, Li DK, et al (2002) Normal-appearing white matter in multiple sclerosis has heterogeneous, diffusely prolonged T(2). Mag Reson Med 47:403–408
Willoughby EW, Grochowski E, Li DKB, et al (1989) Serial magnetic resonance scanning in multiple sclerosis: a second prospective study in relapsing patients. Ann Neurol 25:43– 49
Wolinsky JS, Narayana PA, NoseworthyJH, et al (2000) Linomide in relapsing and secondary progressive MS: part II: MRI results. Neurology 54:1734–1741
Young IR, Hall AS, Pallis CA, et al (1981) Nuclear magnetic resonance imaging of the brain in multiple sclerosis. Lancet 2:1063–1066
Zhao GJ, Li DK, Wang XY, et al (2000) MRI of dirty-appearing white matter in MS. Neurology 54:A121
Zivadinov R, Zorzon M (2002) Is gadolinium enhancement predictive of the development of brain atrophy in multiple sclerosis? J Neuroimaging 12:302–309

Multiple Sclerosis: Other MR Techniques |
225 |
15 Multiple Sclerosis: Other MR Techniques
Massimo Filippi and Maria A. Rocca
CONTENTS
15.1Introduction 225
15.2MT MRI 226
15.2.1 |
MT MRI Findings in Individual MS Lesions 227 |
15.2.2 |
MT MRI Findings in NABT 227 |
15.2.3Correlations with Clinical Manifestations and Disability 228
15.2.4 MT MRI to Monitor Treatment Efficacy 228
15.3DW MRI 229
15.3.1 |
DW MRI Findings in Individual MS Lesions 230 |
15.3.2 |
DW MRI Findings in NABT 230 |
15.3.3 Correlations with Clinical Manifestations and Disability 231
15.41H-MRS 231
15.4.1 |
1H-MRS Findings in Individual MS Lesions 231 |
15.4.2 |
1H-MRS Findings in NABT 232 |
15.4.3 Correlations with Clinical Manifestations |
|
|
and Disability 232 |
15.4.4 |
1H-MRS to Monitor Treatment Efficacy 233 |
15.5Functional MRI 234
15.5.1 Correlations with Structural Tissue Damage 235
15.5.2Correlations with Clinical Manifestations and Disability 235
15.6Conclusions 236 References 236
15.1 Introduction
Multiple sclerosis (MS) is the commonest chronic inflammatory demyelinating disease affecting the central nervous system (CNS) of young adults in western countries, leading, in the majority of cases, to severe and irreversible clinical disability. Pathologically, the essential brain lesion in MS has always been considered the demyelinated plaques, which are widely distributed throughout the brain and spinal cord.The evolution of these lesions may be extremely variable in a given patient and between different patients.
M. Filippi, MD; M.A. Rocca, MD
Neuroimaging Research Unit, Department of Neurology, Scientific Institute and University Ospedale San Raffaele, Milan, Italy.
The application of conventional magnetic resonance imaging (cMRI) to the study of MS has greatly improved our ability to diagnose MS and to monitor its evolution. The sensitivity of T2-weighted MRI in the detection of MS lesions and that of post-contrast T1-weighted images to detect lesions with an increased blood–brain barrier permeability associated with inflammatory activity make it possible to demonstrate the dissemination of MS lesions in space and time earlier than with clinical assessment and to detect disease activity with an increased sensitivity with respect to clinical evaluation of relapses (McDonald et al. 2001). However, the magnitude of the relationship between cMRI measures of disease activity or burden and the clinical manifestations of the disease is weak (Rovaris and Filippi 1999; Molyneux et al. 2001). This clinical/MRI discrepancy is likely to be the result, at least partially, of the inability of cMRI to quantify the extent and to define the nature of MSrelated tissue damage.
Pathological studies (Lumsden 1970; Kidd et al. 1999; Peterson et al. 2001) have shown that MS is not exclusively a demyelinating disease and that demyelination alone is not sufficient to explain the neurological deficits of the disease. There are compelling pieces of evidence that axonal damage is one of the main contributors to the clinical manifestations of the disease and to its clinical worsening over time. Pathologically, marked axonal transection in inflamed MS lesions has been demonstrated by several authors (Ferguson et al.1997; Trapp et al.1998).The pathological heterogeneity of MS lesions, which can range from lesions which undergo a significant remyelination after their acute formation to lesions with permanent axonal loss, has to be considered among the factors responsible for the limited ability of cMRI to provide an accurate picture of MS-related tissue damage. In addition, lesions located in the gray matter (GM) have also been described in MS (Lumsden 1970; Kidd et al.1999; Peterson et al.2001).Although MS cortical lesions are characterized by the paucity of inflammatory changes, they are associated with neuronal injury, including neuritic swelling, and den-
226 |
M. Filippi and M. A. Rocca |
dritic and axonal transections (Peterson et al. 2001). These lesions are usually missed on conventional T2weighted images because of their small size, their relaxation characteristics which result in poor contrast between them and the surrounding normal GM and because of partial volume effects with cerebrospinal fluid. Another reason for the clinical/MRI discrepancy in MS is the inability of cMRI to measure and quantify the presence and extent of normal-appear- ing tissue damage. Post-mortem studies have shown subtle changes in the normal-appearing brain tissue (NABT) from MS patients, which include diffuse astrocytic hyperplasia, patchy edema, and perivascular cellular infiltration, as well as axonal damage (Allen and McKeown 1979; Evangelou et al. 2000;
Bjartmar et al. 2001).
Modern quantitative MR techniques have the potential to overcome some of the limitations of cMRI. Metrics derived from magnetization transfer (MT) (Filippi et al. 1999a) and diffusion-weighted (DW) (Filippi and Inglese 2001) MRI enable us to quantify the extent and severity of structural changes occurring within and outside cMRI-visible lesions of patients with MS. Proton MR spectroscopy (1H- MRS) (Filippi et al. 2001a) can add information on the biochemical nature of such changes. Functional MRI (fMRI) (Filippi and Rocca 2003) can provide new insights into the role of cortical adaptive changes in limiting the clinical consequences of MS structural damage.
This chapter provides an update of the current “state-of-the-art” of the application of structural, metabolic and functional MR-based techniques to the study of MS pathophysiology.
15.2 MT MRI
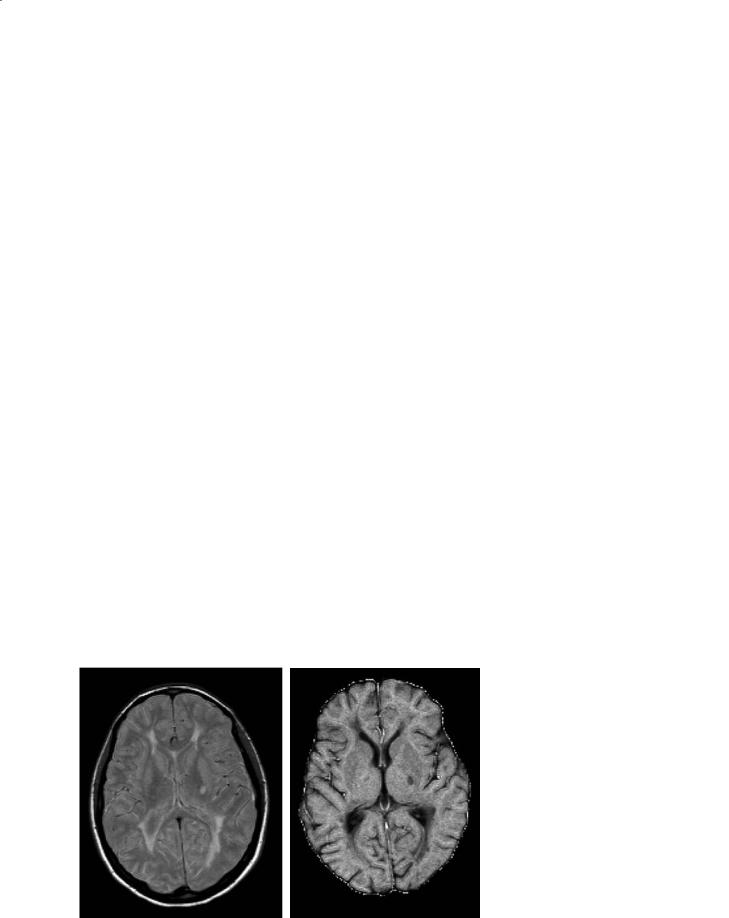
The basic principles of MT MRI are described elsewhere in this book. An example of a magnetization transfer ratio (MTR) map is shown in Fig. 15.1. On MTR maps, the degree of signal loss depends on the density of macromolecules in a given tissue, and low MTR values indicate a reduced capacity of the macromolecules in the CNS to exchange magnetization with the surrounding water molecules, reflecting damage to myelin or to the axonal membrane. MT MRI has several advantages over cMRI in the assessment of MS. First of all, it provides quantitative information with a high specificity to demyelination and axonal loss, the more disabling substrates of MS pathology. Secondly, it enables us to assess the “invisible” disease burden in the brain tissue which does not show macroscopic abnormalities on cMRI. Thirdly, with the application of MTR histogram analysis, it provides, from a single procedure, multiple parameters influenced by both the macroand microscopic lesion burden, that might also be used as paraclinical measures of MS evolution, either natural or modified by treatment.
A post-mortem study in MS (van Waesberghe et al. 1999) has provided the most compelling evidence that a marked reduction of MTR values in MS diseased tissues indicates severe structural damage, by showing strong correlations of MTR values from MS lesions and normal-appearing white matter (NAWM) with the percentage of residual axons and the degree of demyelination. More recently, a study performed on human specimens has confirmed the sensitivity
Fig. 15.1a,b. Axial magnetic resonance images from a patient with multiple sclerosis. The proton-density weighted scan (a) shows multiple lesions. On the magnetization transfer (MT) map (b), lesions appear as hypointense areas. The degree of hypointensity is related to a decrease in the MT ratio and indicates damage to the myelin or to the axonal membranes
a |
b |

Multiple Sclerosis: Other MR Techniques |
227 |
of this technique towards the different pathological substrates of the disease, by showing that MTR values of remyelinated lesions are higher than those of demyelinated lesions and lower than those of the NAWM (Barkhof et al. 2003).
15.2.1
MT MRI Findings in Individual MS Lesions
The following are the main findings obtained by the application of MT MRI for the study of individual MS lesions:
1.New enhancing lesions are pathologically heterogeneous, as suggested by the demonstration that MTR values are higher: (a) in homogeneously enhancing lesions, which probably represent new lesions, than in ring-enhancing lesions, which may represent pre-existent, reactivated lesions (Silver et al. 1998); (b) in lesions enhancing on a single scan than in those enhancing on two or more serial scans (Filippi et al. 1998a); (c) in lesions enhancing after the injection of a triple dose of gadolinium than in those enhancing after the injection of a standard dose (Filippi et al. 1998b).
2.MTR changes can be detected in NAWM before lesion formation (Filippi et al. 1998c; Goodkin et al. 1998; Pike et al. 2000; Fazekas et al. 2002).
3.Longitudinal studies have shown that, in new enhancing lesions, MTR drops dramatically when the lesions start to enhance and can show a partial or complete recovery in the subsequent 1–6 months (Dousset et al. 1998; Filippi et al. 1998a,b; Goodkin et al. 1998; Silver et al. 1998; van Waesberghe et al. 1998).
4.Established MS lesions are also heterogeneous, as shown by the demonstration of lower MTR values in hypointense lesions than in lesions that are isointense to NAWM on T1-weighted scans (van Waesberghe et al. 1998).
5.Average lesion MTR has been found to be lower in patients with relapsing-remitting (RR) MS than in those with clinically isolated syndromes (CIS) suggestive of MS (Filippi et al. 1999), whereas no differences have been found in cross-sectional studies between patients with RRMS and those with secondary progressive (SP) MS (Filippi et al. 1999b) or between patients with SPMS and those with primary progressive (PP) MS (Rovaris et al. 2001). However, longitudinal studies have shown a more severe and faster decline of average lesion MTR values in SPMS patients than in patients with other disease phenotypes (Rocca et al. 1999;
Filippi et al. 2000a), consistent with the unfavorable clinical evolution of these patients.
15.2.2
MT MRI Findings in NABT
The pathological abnormalities observed in the NAWM of MS patients (Allen and McKeown 1979; Evangelou et al. 2000; Bjartmar et al. 2001) have the potential to modify the relative proportions of mobile and bound protons in the affected tissue and, as a consequence, the corresponding MTR values. Therefore, MT MRI can show NABT microstructural abnormalities not detected when using conventional imaging. MT MRI analysis of the NABT can be performed using either a region of interest (ROI) approach, or, alternatively, a histogram analysis. More recently, with the development of new techniques capable of automatically segmenting the NAWM and the NAGM, it has become possible to study these two tissue compartments separately.
The following are the main results obtained by the application of MT MRI to the study of the NABT of MS patients:
1.Using ROI-analysis, a reduction of MTR values has been shown in the NAWM of MS patients with all the major MS phenotypes (Filippi et al. 1995; Loevner et al. 1995). More recently, MTR changes, of a lower magnitude than those observed in T2visible lesions, have also been detected in the dirty-appearing white matter of MS patients (Ge et al. 2003).
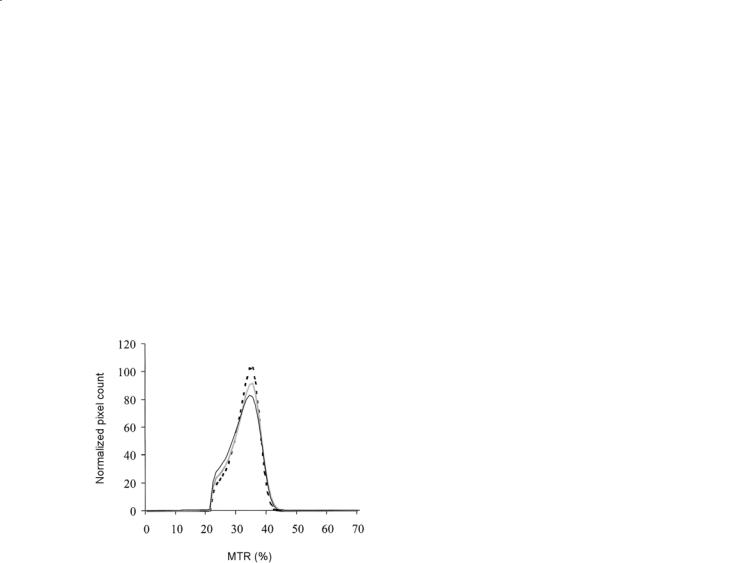
2.The application of histogram analysis (Filippi et al. 1999b; Iannucci et al. 2000; Kalkers et al. 2001; Rovaris et al. 2001; Tortorella et al. 2000; Traboulsee et al. 2002) to the study of the NABT and of the NAWM confirmed and extended the previous findings obtained with ROI analysis, by showing that these abnormalities can be detected even in patients with CIS suggestive of MS (Iannucci et al. 2000; Traboulsee et al. 2002), are more pronounced in SPMS and PPMS patients than in patients with the other disease phenotypes (Tortorella et al. 2000), and are similar between patients with SPMS and those with PPMS (Rovaris et al. 2001) (Fig. 15.2).
3.NABT MTR values tend to decline over time in all MS phenotypes, even if these changes seem to be more pronounced in SPMS patients (Filippi et al. 2000a).
4.NABT MTR values are only partially correlated with the extent of macroscopic lesions and the
228 |
M. Filippi and M. A. Rocca |
severity of intrinsic lesion damage (Tortorella et al. 2000), thus suggesting that NABT pathology does not only reflect Wallerian degeneration of axons traversing large focal abnormalities, but they may also represent small focal abnormalities beyond the resolution of conventional scanning and independent of larger lesions.
5.Using ROI (Cercignani et al.2001) and histogram analysis (Cercignani et al. 2001; Ge et al. 2001, 2002; Dehmeshki et al. 2003), MT MRI abnormalities have also been shown in the NAGM of MS patients, including those with PPMS (Dehmeshki et al. 2003). As shown for the NABT, also NAGM changes are more pronounced in patients with SPMS than in those with RRMS (Ge et al. 2002).
Fig. 15.2. Average MTR graphs of normal-appearing brain tissue from healthy controls (dotted line), primary progressive (PP) multiple sclerosis (MS) (gray line) and secondary progressive (SP) MS (black line) patient groups. PPMS and SPMS patients had lower average brain MTR and MTR histogram peak height than healthy controls, suggesting a diffuse NABT damage
15.2.3
Correlations with Clinical Manifestations and Disability
Due to its capability of quantifying the extent and the severity of tissue damage within T2-visible lesion and NABT, MT MRI is increasing the degree of correlation between MRI and clinical findings, as summarized below:
1.Moderate to strong correlations between various brain MTR histogram-derived metrics and the severity of physical disability have been shown by several studies (Iannucci et al. 1999;
Dehmeshki et al. 2001; Kalkers et al. 2001; Traboulsee et al. 2003). These correlations have been found to be stronger in patients with RRMS and SPMS than in other disease phenotypes (Dehmeshki et al. 2001; Kalkers et al. 2001).
2.Subtle MTR changes in the NABT (Rovaris et al. 1998; van Buchem et al. 1998) and in the cortical/subcortical (Rovaris et al. 2000) brain tissue are well correlated with the presence of neuropsychological impairment in MS patients. In addition, a multivariate analysis of several MRI and MT MRI variables, has demonstrated that average NABT MTR is more strongly associated to cognitive impairment in MS patients than the extent of T2-visible lesions and their intrinsic tissue damage (Filippi et al. 2000b).
3.MTR histogram parameters from the cerebellum and brainstem of MS patients are significantly associated with impairment of these functional systems (Iannucci et al. 1999).
4.NAGM MTR metrics are correlated with the severity of clinical disability in patients with RR (Ge et al. 2001) and PP (Dehmeshki et al. 2003) MS.
5.Longitudinal studies (Iannucci et al. 2000; Santos et al. 2002; Rovaris et al. 2003) demonstrated that MT MRI metrics are useful markers to monitor disease evolution. In patients at presentation with CIS, the extent of NABT changes has been found to be an independent predictor of subsequent evolution to clinically definite MS (Iannucci et al. 2000); whereas in patients with established MS, NAWM MTR reduction has been shown to predict the accumulation of clinical disability over the subsequent 5 years (Santos et al. 2002; Rovaris et al. 2003).
15.2.4
MT MRI to Monitor Treatment E cacy
MT MRI holds substantial promise to provide good surrogate markers for MS evolution (Filippi et al. 2002a). As a consequence, several recent MS clinical trials have already incorporated MT MRI, with a view to assessing the impact of treatment on demyelination and axonal loss. MT MRI has been used in phase II and phase III trials for RRMS (injectable and oral interferon beta-1a, interferon beta-1b, and oral glatiramer acetate) and SPMS (interferon beta1b and immunoglobulins). In these phase III trials, MT MRI acquisition has been limited to highly-spe- cialized MR centers and only subgroups of patients
Multiple Sclerosis: Other MR Techniques |
229 |
(about 50–100 per trial) have been studied using this technique. Two phase II studies have shown that treatment with interferon beta-1b (Richert et al. 2001) or interferon beta-1a (Kita et al. 2000) favorably modifies the recovery of MTR values which follows the cessation of gadolinium enhancement in newly-formed lesions from RRMS patients. On the contrary, Richert et al. (2001) did not find any significant difference in the MTR values of NAWM ROI before and during interferon beta-1b therapy, as well as in the parameters derived from whole brain MTR histograms (Richert et al. 1998) in RRMS patients. More recently, it has also been shown that treatment with interferon beta-1b does not affect the MTR loss seen in whole brain tissue and NAWM of patients with SPMS recruited in the European phase III trial (Inglese et al. 2003a).
15.3 DW MRI
Diffusion is the microscopic random translational motion of molecules in a fluid system. In the CNS, diffusion is influenced by the microstructural components of tissue, including cell membranes and organelles. The diffusion coefficient of biological tissues (which can be measured in vivo by MRI) is, therefore, lower than the diffusion coefficient in free water and for this reason is named apparent diffusion coefficient (ADC) (Le Bihan et al. 1986). Pathological processes which modify tissue
integrity, thus resulting in a loss or increased permeability of “restricting” barriers, can determine an increase of the ADC. Since some cellular structures are aligned on the scale of an image pixel, the measurement of diffusion is also dependent on the direction in which diffusion is measured. As a consequence, diffusion measurements can give information about the size, shape, integrity, and orientation of tissues (Le Bihan et al. 1991). A measure of diffusion which is independent of the orientation of structures is provided by the mean diffusivity (MD), the average of the ADCs measured in three orthogonal directions.A full characterization of diffusion can be obtained in terms of a tensor (Basser et al. 1994), a 3×3 matrix which accounts for the correlation existing between molecular displacement along orthogonal directions. From the tensor, it is possible to derive MD, equal to the one third of its trace, and some other dimensionless indexes of anisotropy. One of the most used of these indices is named fractional anisotropy (FA) (Pierpaoli et al. 1996). A more detailed description of technical aspects of DW MRI is provided in another chapter of this book.
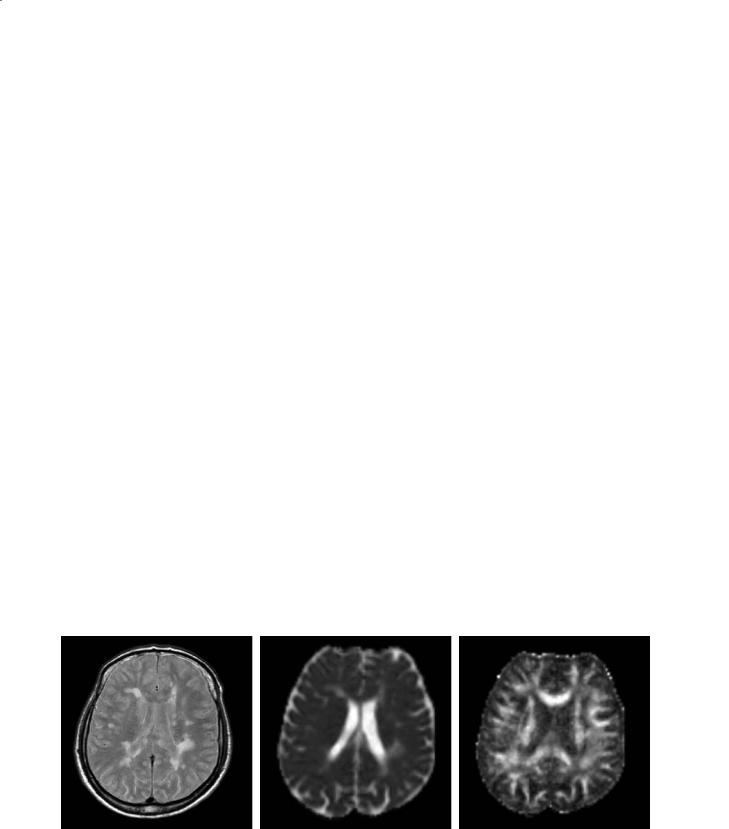
The pathological elements of MS have the potential to alter the permeability or geometry of structural barriers to water molecular diffusion in the brain (Fig. 15.3). The application of DW MRI technology to MS is, therefore, appealing to provide quantitative estimates of the degree of tissue damage and, as a consequence, to improve the understanding of the mechanisms leading to irreversible disability.
a |
b |
c |
Fig. 15.3a–c. Axial magnetic resonance images from a patient with multiple sclerosis. The proton density-weighted scan (a) shows multiple lesions. On the mean diffusivity (MD) map (b), some of the lesions appear as hyperintense areas. The degree of hyperintensity is related to an increased MD and indicates a loss of structural barriers to water molecular motion. On the fractional anisotropy (FA) map (c), white matter pixels are bright because of the directionality of the white matter fiber tracts. Dark areas corresponding to some of the macroscopic lesions indicate a loss of FA and suggest the presence of structural disorganization

230 |
M. Filippi and M. A. Rocca |
15.3.1
DW MRI Findings in Individual MS Lesions
The following are the main findings obtained by the application of DW MRI for the study of individual MS lesions:
1.Consistently with their pathological heterogeneity, T2-visible lesions are characterized by highly variable ADC, MD, and FA values (Horsfield et al. 1996; Droogan et al. 1999; Werring et al. 1999, 2000a; Filippi et al. 2000c, 2001b; Cercignani et al. 2000, 2001; Rocca et al. 2000). In particular, ADC and MD values have been shown to be higher in T1-hypointense than in T1-isointense lesions (Droogan et al. 1999; Werring et al. 1999; Filippi et al. 2000c, 2001b).
2.While FA values are consistently lower in enhancing than in non-enhancing lesions (Werring et al. 1999; Filippi et al. 2001b), conflicting results have been achieved when comparing ADC or MD between these two lesion populations. While some studies reported higher ADC or MD values in non-enhancing than in enhancing lesions (Droogan et al. 1999; Werring et al. 1999), others, based on larger samples of patients and lesions, did not report any significant difference between the two lesion populations (Filippi et al. 2000c, 2001b). The heterogeneity of enhancing lesions has also been underlined by the demonstration that water diffusivity is markedly increased in ring-enhancing lesions when compared to homogeneously-enhanc- ing lesions (Roychowdhury et al. 2000), or in the non-enhancing portions of enhancing lesions when compared with enhancing portions (Roychowdhury et al. 2000).
3.As for MT MRI,DW MRI changes have been shown in regions that will develop new lesions (Rocca et al. 2000; Werring et al. 2000a).
15.3.2
DW MRI Findings in NABT
As for MT MRI, DW MRI analysis of regions that appear as “normal” on conventional imaging can be performed using either an ROI or histogram analysis. The major findings derived by the application of DW MRI to the assessment of NABT pathology of MS patients are the following:
1.ROIs of the NAWM of MS patients have increased ADC or MD and decreased FA values when compared to the corresponding white matter
from controls. However, these abnormalities are milder than those measured in T2-visible lesions (Horsfield et al. 1996; Droogan et al. 1999; Werring et al. 1999, 2000a; Filippi et al. 2000c, 2001b; Cercignani et al. 2000, 2001; Rocca et al. 2000; Ciccarelli et al. 2001).
2.MD and FA changes in the whole brain and in the NABT have been shown also using histogram analysis in all the major MS clinical phenotypes (Cercignani et al. 2000, 2001; Nusbaum et al. 2000), including PPMS (Rocca et al. 2003a).
3.Using ROI (Cercignani et al. 2001) and histogram analysis (Cercignani et al. 2001; Bozzali et al. 2002; Rovaris et al. 2002a), MD changes have been shown to involve also the NAGM of MS patients (Fig. 15.4). Consistently with their worse clinical evolution, these changes tend to be more pronounced in patients with the progressive forms of the disease (Bozzali et al. 2002; Rovaris et al. 2002a), whereas no MD abnormalities have been detected in the NAGM and NAWM of patients with early RRMS (Griffin et al. 2001).
4.In a 1-year follow up study, Caramia et al. (2002)
Fig. 15.4. Mean diffusivity (MD) histogram of the normalappearing gray matter (NAGM) from a group of healthy controls (gray line) and a large sample of MS patients (black line). All MD histogram-derived metrics of the NAGM were significantly different between healthy controls and MS population, indicating the presence of structural damage of this tissue compartment
showed the development of MD abnormalities in the NAWM of CIS patients that evolved to definite MS. In an 18-month follow up study, OrejaGuevara et al. (2003) showed that NAGM changes in patients with RRMS worsen over time.

Multiple Sclerosis: Other MR Techniques |
231 |
15.3.3
Correlations with Clinical Manifestations and Disability
The following are the major results obtained by the application of DW MRI to investigate the correlations between structural brain changes and the clinical manifestations of the disease:
1.While correlations between DW MRI findings and MS clinical manifestations or disability were not found in some of the earliest studies (Horsfield et al. 1996; Droogan et al. 1999; Cercignani et al. 2000; Filippi et al. 2000c), with improved DW MRI technology and increased numbers of patients studied, correlations between DW MRI findings and MS clinical manifestations or disability are now emerging (Castriota Scanderbeg et al. 2000; Nusbaum et al. 2000; Cercignani et al. 2001; Filippi et al. 2001b; Rovaris et al. 2002a).
2.In a large sample of MS patients, average lesion MD, but not average lesion FA, was found to be significantly correlated, albeit moderately, with clinical disability (Filippi et al. 2001b). Interestingly, in patients with SPMS a moderate and significant correlation was found between average lesion MD or FA and disability (Castriota Scanderbeg et al. 2000; Filippi et al. 2001b), whereas no significant correlation was found between disability and T2 lesion volume. On the contrary, a significant correlation between disability and T2 lesion volume was found in patients with RRMS, where, in turn, there was no correlation between average lesion MD or FA and disability (Filippi et al. 2001b). These findings suggest that mechanisms leading to disability are likely to be different in patients with RRMS and SPMS.
3.DW MRI metrics of specific brain structures, such as the pyramidal tracts (Wilson et al. 2003) or the cerebellar peduncles (Ciccarelli et al. 2001) are strongly correlated with the impairment of these functional systems.
4.In patients with RRMS, a moderate correlation between cognitive impairment and NAGM MD histogram metrics has been shown (Rovaris et al. 2002b).
15.4
1H-MRS
Water suppressed, proton MR spectra of normal human brain at long echo times reveal four major
resonances: one at 3.2 ppm from tetramethylamines (mainly from choline-containing phospholipids [Cho]), one at 3.0 ppm from creatine and phosphocreatine (Cr), one at 2.0 ppm from N-acetyl groups (mainly NAA), and one 1.3 ppm from the methyl resonance of lactate (Lac). NAA is a marker of axonal integrity, while Cho and Lac are considered as chemical correlates of acute inflammatory/demyelinating changes (Filippi et al. 2001a). 1H-MRS studies with shorter echo times can detect additional metabolites, such as lipids and myoinositol (mI), which are also regarded as markers of ongoing myelin damage.Additional technical information on 1H-MRS are given elsewhere in this book.
1H-MRS can complement cMRI in the assessment of MS patients, by defining simultaneously several chemical correlates of the pathological changes occurring within and outside T2-visible lesions. An immunopathologic study (Bitsch et al. 1999) has shown that a decrease in NAA levels is correlated with axonal loss, while an increase in Cho correlates with the presence of active demyelination and gliosis.
15.4.1
1H-MRS Findings in Individual MS Lesions
As shown by other non-conventional MRI techniques, 1H-MRS can depict the heterogeneous pathological substrates of T2-visible MS lesions. The following are the major insights provided by the application of 1H- MRS to the study of MS lesions:
1. 1H-MRS of acute MS lesions at both short and long echo times reveals increases in Cho and Lac resonance intensities (Davie et al. 1994; De Stefano et al. 1995a), which reflect the releasing of membrane phospholipids and the metabolism of inflammatory cells, respectively. In large, acute demyelinating lesions, decreases of Cr can also be seen (De Stefano et al. 1995a). Short echo time spectra can detect transient increases in visible lipids, released during myelin breakdown, and mI (Narayana et al. 1998). All these changes are usually associated with a decrease in NAA. After the acute phase and over a period of days to weeks, there is a progressive reduction of raised Lac resonance intensities to normal levels. Resonance intensities of Cr also return to normal within a few days. Cho, lipid and mI resonance intensities return to normal over months. The signal intensity of NAA may remain decreased or show partial recovery, starting soon after the acute phase and lasting for several months (Arnold et al. 1992;